Nursing Facility Operator Touched New High - Monday, July 1, 2019
Ensign Group Inc (ENSG $57.01 +$0.09 +0.16%) hit another new all-time high but ended in the lower half of its intra-day range. It made gradual progress last shown in this FSU section on 6/03/19 with an annotated graph under the headline, "Resilient After Latest Quarterly Report Missed Minimum Guideline". Earnings rose +22% on +12% sales revenues for the Mar '19 quarter, below the +25% minimum earnings guideline (C criteria), raising fundamental concerns.
It was highlighted in yellow with pivot point cited based on its 12/12/18 high plus 10 cents in the 2/07/19 mid-day report (read here). Through Dec '18 it had shown earnings increases above the +25% minimum guideline (C criteria) while its sales revenues growth rate was in the 9-11% range. Annual earnings (A criteria) history has improved steadily after downturn in FY '13 and '14. It has an 89 Earnings Per Share Rating.
The number of top-rated funds owning its shares rose from 324 in Mar '18 to 483 in Mar '19, a reassuring sign concerning the I criteria. It has a Timeliness Rating of A and Sponsorship Rating of C. Its small supply of 53 million shares outstanding (S criteria) can contribute to greater volatility in the event of institutional buying or selling.
Charts courtesy of www.stockcharts.com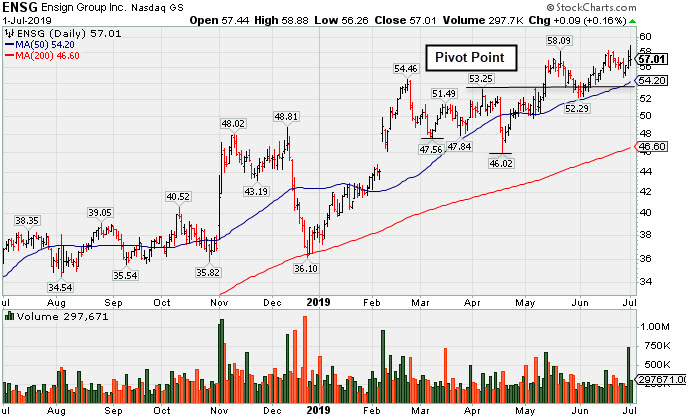
Resilient After Latest Quarterly Report Missed Minimum Guideline - Monday, June 3, 2019
Ensign Group Inc (ENSG -$0.25 or -0.47% to $53.01) showed resilience in recent weeks after it reported earnings +22% on +12% sales revenues for the Mar '19 quarter, below the +25% minimum earnings guideline (C criteria), raising fundamental concerns. Its 50-day moving average (DMA) line ($52.05) defines near-term support to watch.
ENSG found prompt support and rebounded impressively since last shown in this FSU section on 4/17/19 with an annotated graph under the headline, "Two Damaging Losses Hurt Outlook". It was highlighted in yellow with pivot point cited based on its 12/12/18 high plus 10 cents in the 2/07/19 mid-day report (read here).
Through Dec '18 showed earnings increases were above the +25% minimum guideline (C criteria) while its sales revenues growth rate was in the 9-11% range. Annual earnings (A criteria) history has improved steadily after downturn in FY '13 and '14. It has an 89 Earnings Per Share Rating.
The number of top-rated funds owning its shares rose from 324 in Mar '18 to 474 in Mar '19, a reassuring sign concerning the I criteria. It has a Timeliness Rating of A and Sponsorship Rating of C. Its small supply of 53 million shares outstanding (S criteria) can contribute to greater volatility in the event of institutional buying or selling.
Charts courtesy of www.stockcharts.com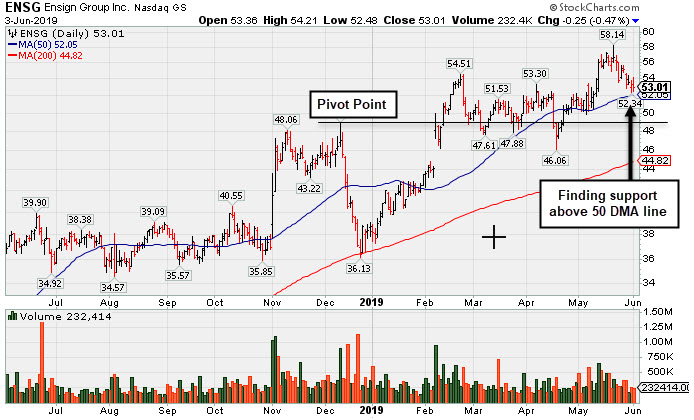
Two Damaging Losses Hurt Outlook - Wednesday, April 17, 2019
Ensign Group Inc (ENSG -$0.96 or-1.98% to $47.55) suffered a 2nd consecutive big loss today with higher volume. The loss violating the 50-day moving average (DMA) line ($50.30) on the prior session triggered a technical sell signal. It slumped into the prior base and at today's low undercut prior lows in the $47 area raising more concerns, yet it found support and finished the session in the middle of its intra-day range. A prompt rebound above the 50 DMA line is needed to help its outlook improve.
ENSG was highlighted in yellow with pivot point cited based on its 12/12/18 high plus 10 cents in the 2/07/18 (read here). It was last shown in this FSU section on 3/11/19 with an annotated graph under the headline, "Consolidating Near Prior High and Above 50-Day Average".
The 5 most recent quarters through Dec '18 showed earnings increases above the +25% minimum guideline (C criteria) while its sales revenues growth rate has been in the 9-11% range. Annual earnings (A criteria) history has improved steadily after downturn in FY '13 and '14. It has an 84 Earnings Per Share Rating.
The number of top-rated funds owning its shares rose from 324 in Mar '18 to 464 in Mar '19, a reassuring sign concerning the I criteria. It has a Timeliness Rating of B and Sponsorship Rating of C. Its small supply of 52.7 million shares outstanding (S criteria) can contribute to greater volatility in the event of institutional buying or selling.
Charts courtesy of www.stockcharts.com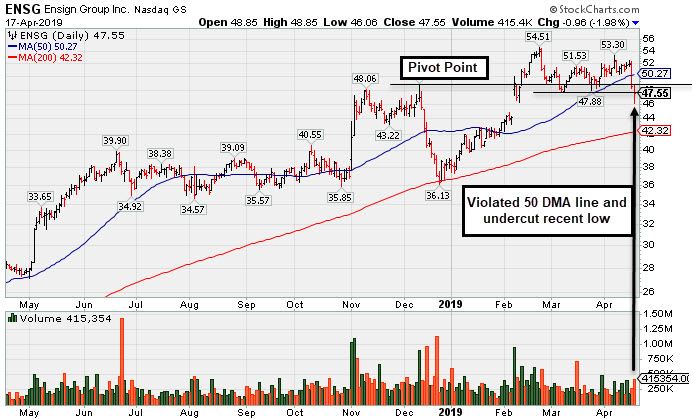
Consolidating Near Proir High and Above 50-Day Average - Monday, March 11, 2019
Ensign Group Inc (ENSG +$0.84 or +1.73% to $49.34) found support after pulling back on light volume, consolidating near prior highs in the $48 area. It was highlighted in yellow with pivot point cited based on its 12/12/18 high plus 10 cents in the 2/07/18 (read here). Solid confirming gains backed by at least +40% above average volume triggered a technical buy signal. It was last shown in this FSU section on 2/07/19 with an annotated graph under the headline, "Closed Near Pivot Point After Gap Up and Big Volume-Driven Gain".
The 5 most recent quarters through Dec '18 showed earnings increases above the +25% minimum guideline (C criteria) while its sales revenues growth rate has been in the 9-11% range. Annual earnings (A criteria) history has improved steadily after downturn in FY '13 and '14. It has an 83 Earnings Per Share Rating.
The number of top-rated funds owning its shares rose from 324 in Mar '18 to 454 in Dec '18, a reassuring sign concerning the I criteria. It has a Timeliness Rating of A and Sponsorship Rating of B. Its small supply of 52.7 million shares outstanding (S criteria) can contribute to greater volatility in the event of institutional buying or selling.
Charts courtesy of www.stockcharts.com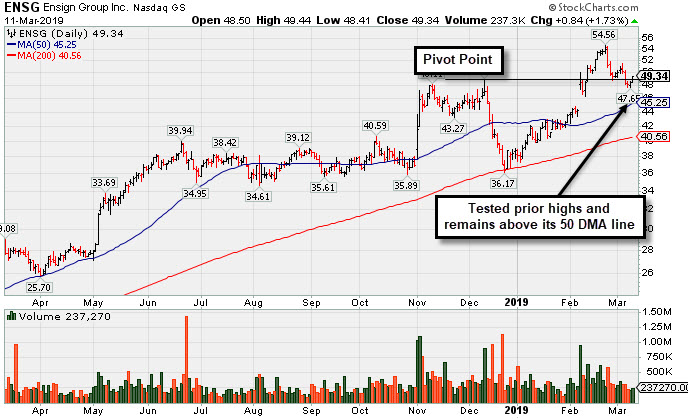
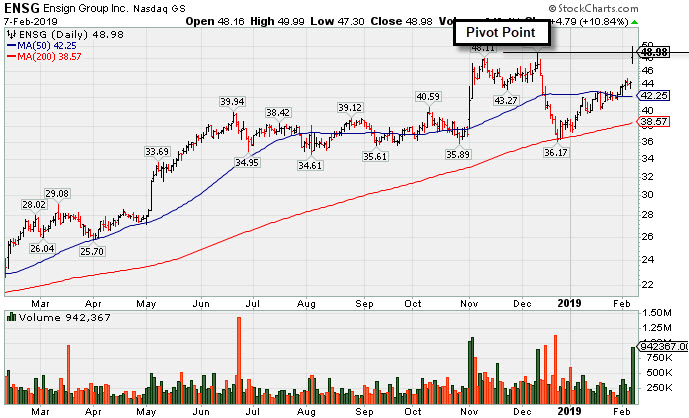
Closed Near Pivot Point After Gap Up and Big Volume-Driven Gain - Thursday, February 7, 2019
Ensign Group Inc (ENSG +$4.79 or +10.84% to $48.98) gapped up today hitting new 52-week and all-time highs with a considerable volume-driven gain. It was highlighted in yellow with pivot point cited based on its 12/12/18 high plus 10 cents. Subsequent confirming gains backed by at least +40% above average volume and a close above the pivot point ($49.06) may trigger a proper technical buy signal.
The 5 most recent quarters through Dec '18 showed earnings increases above the +25% minimum guideline (C criteria) while its sales revenues growth rate has been in the 9-11% range. Annual earnings (A criteria) history has improved steadily after downturn in FY '13 and '14.
The number of top-rated funds owning its shares rose from 324 in Mar '18 to 443 in Dec '18, a reassuring sign concerning the I criteria. It has a Timeliness Rating of A and Sponsorship Rating of C. Its small supply of 52.3 million shares outstanding (S criteria) can contribute to greater volatility in the event of institutional buying or selling. .
Charts courtesy of www.stockcharts.com