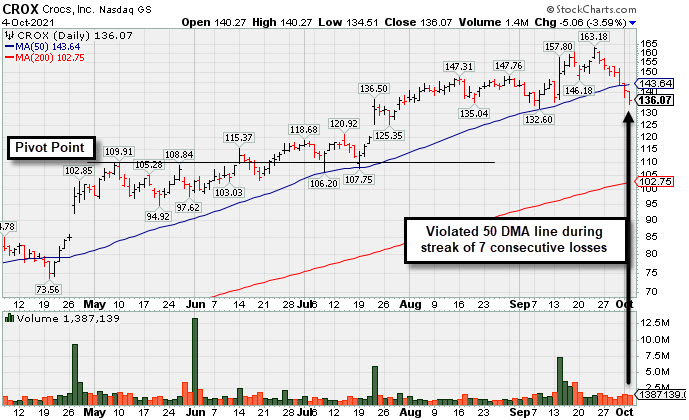
Streak of Losses Violated 50-day Moving Average Line - Monday, October 4, 2021
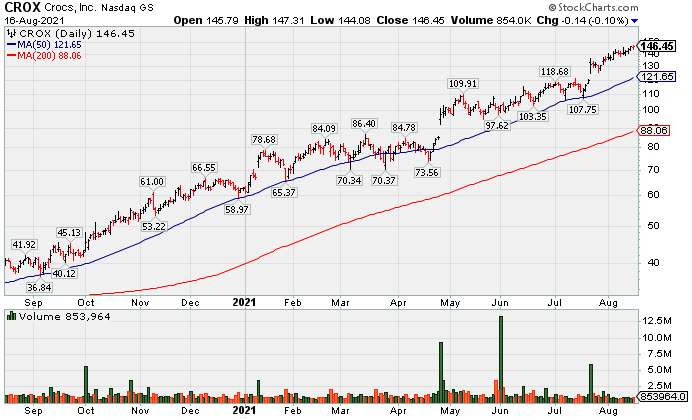
Wedging Higher and Very Extended From Any Sound Base - Monday, August 16, 2021
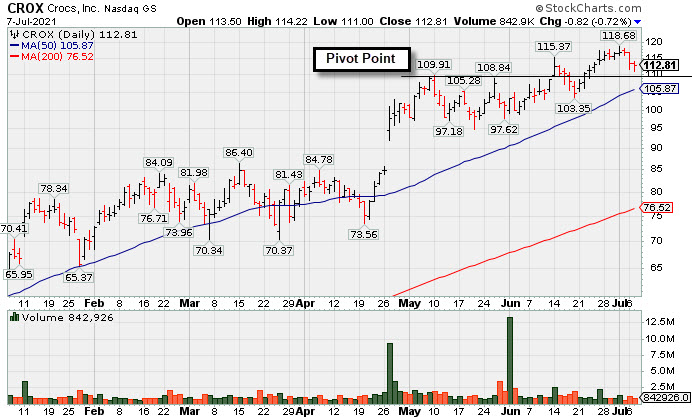
Quietly Consolidating Below "Max Buy" Level - Wednesday, July 7, 2021
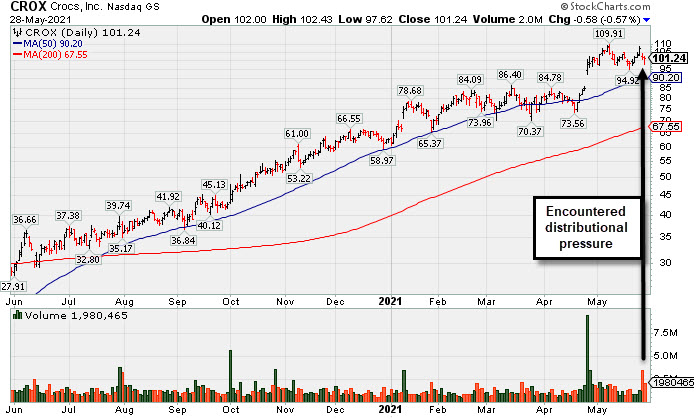
Encountered Distributional Pressure Late This Week - Friday, May 28, 2021
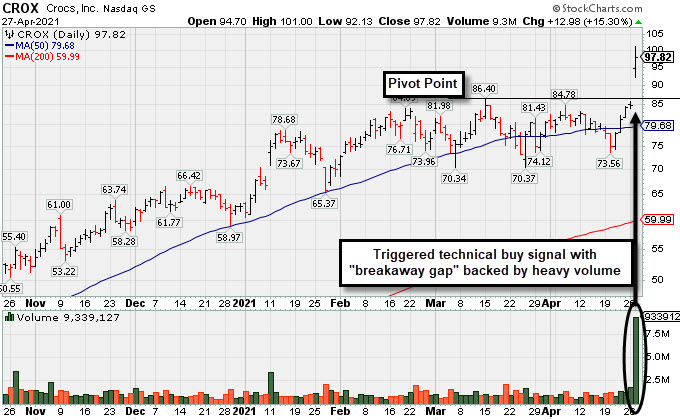
Bullish action came after it reported Mar '21 quarterly earnings +577% on +64% sales revenues versus the year ago period, its 3rd strong quarterly comparison after some negative comparisons. Annual earnings (A criteria) growth has been strong and steady following losses in FY '15 and '16. CROX has the highest possible Earnings Per Share Rating of 99.
Powerful "Breakaway Gap" for CROX - Tuesday, April 27, 2021
Bullish action came after it reported Mar '21 quarterly earnings +577% on +64% sales revenues versus the year ago period, its 3rd strong quarterly comparison after some negative comparisons. Annual earnings (A criteria) growth has been strong and steady following losses in FY '15 and '16. CROX has the highest possible Earnings Per Share Rating of 99.
Gaps Down With Heavy Volume Are A Classic Sign of Institutional Selling - Friday, October 24, 2008
A detailed analysis and annotated graph in the Featured Stock Update section of the 11/01/07 CANSLIM.net After-Market Update called attention to the extremely poor action in a previously strong leader, observing that it had "triggered a decisive technical sell signal as it plunged to a new multi-month low and violated prior chart highs and its 50-day moving average line." That company, Crocs Inc (CROX), was then dropped from the Featured Stocks list 11/7/07. This stock is worth revisiting now, because investors can see the fundamental deterioration that followed its horrible technical breakdown.
CROX rose as much as +44.71% after it was first featured at $51.97 on Tuesday, January 30, 2007 in the CANSLIM.net Mid Day Breakouts Report (read here). When it gapped down on 11/01/07, many late comers were slapped with an especially painful loss. Taking that loss quickly was the right thing to do! Notice that each subsequent rally attempt was followed by another classic gap down for a huge loss on volume, followed by another, followed by another, then followed by yet another. Today there is the conclusive fundamental evidence behind its breakdown, as sales revenues growth decelerated and earnings dried up. Refer to this example the next time a stock breaks down and you might be tempted to say, "it is still a good company and it still has great earnings." Usually when you see a bad gap down, the technical action foreshadows a deterioration in the fundamentals. Gaps down with heavy volume are a classic sign of heavy institutional selling pressure.
C A N S L I M | StockTalk | News | Chart | SEC | Zacks Reports | ![]()
![]()
![]()
Technical Gap Down After Lofty Expectations Are Not Met - Thursday, November 01, 2007
It is very important to isolate the noise and pay attention to price and volume as we make our way through yet another earnings season. There are a slew of analysts that come out and set "targets" and who constantly engage in publishing upgrades or downgrades on various securities. An important element in profitably navigating through a busy earnings season is to see how your individual holdings react to their latest earnings news and guidance. While it is a common occurrence to see stocks sell off after a new earnings report, it is healthy to see investors promptly bid the stocks higher after a company reports their quarterly results. Investors that objectively analyze price and volume will likely do better than blindly following a plethora of analysts' upgrades and downgrades.
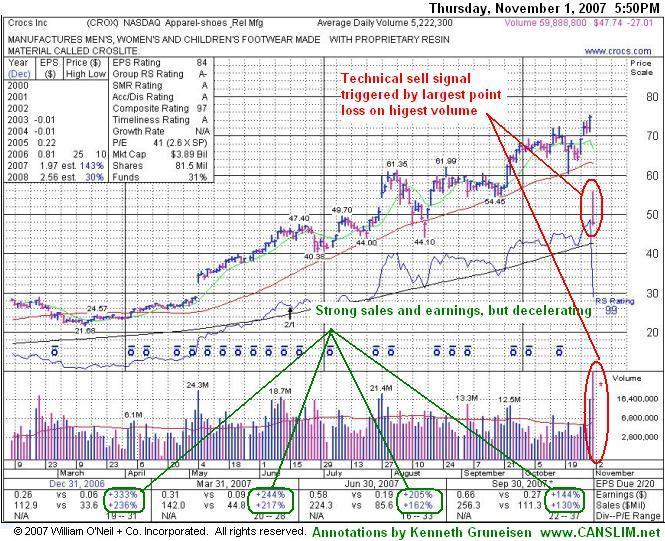
Crocs Inc. (CROX -$27.01 or -36.13% to $47.74) triggered a decisive technical sell signal as it plunged to a new multi-month low and violated prior chart highs and its 50-day moving average line (DMA). After Wednesday's close, the stock reported its third quarter results and plunged in after hours trade. The maker of the peculiar-looking resin shoes earned $0.66 cents a share, up +144% vs. a year earlier. Meanwhile, sales jumped +130% to $256.3 million, missing views of $258.4 million. Crocs' full-year targets suggest that it will fall short in the fourth quarter. It sees 2007 profit of $1.94-$1.98 a share on sales of $820 million to $830 million. Wall Street had forecast that Crocs would earn +$1.97 a share on sales of $835.6 million. The company has enjoyed a stunning run since going public, soaring past views every quarter since its market debut on February 8, 2006. Its stock price has more than tripled since May 2007.
One of the most important rules of successful investing is knowing how and when to sell. Once of the most important sell rules is to always sell a stock if it falls 7-8% below its purchase price, no questions. The stock gapped down on Thursday, experiencing its largest single day decline in the stock's history. If anyone was looking for additional evidence on whether or not to sell on such a horrible meltdown all they would have to do is look at the session's volume. A whopping 59,888,800 shares were traded as the stock suffered its largest single day loss of volume that was clearly indicative of institutional sellling (the I criteria) activity. The company only has 67.7 million shares in the float.
CROX was first featured in the Tuesday, January 30, 2007 CANSLIM.net Mid Day Breakouts Report (read here) with a $25.18 (split adjusted) pivot point. Early on, CROX experienced a lot of whipsaw type action which made it difficult to trade for meaningful gains. Then in early May, CROX experienced a "break-away" gap after reporting their first quarter results. Along the way it found support near its 50 DMA line before ultimately topping at $75.21 just before its breakdown. Investors need to recognize that, even though the market has not dished out a lot of treacherous action like this in recent years, the market conditions are eroding and many recent leaders are coming under pressure during this earnings season. CROX is an example of how and when a stock needs to be sold without emotion, no excuses.
C A N S L I M | StockTalk | News | Chart | SEC | Zacks Reports | ![]()
![]()
![]()
View all notes | Alert me of new notes | CANSLIM.net Company Profile
Volume Iffy Behind BreakOut From 3-Weeks Tight Pattern - Monday, October 15, 2007
A classic example of the success enjoyed by many CANSLIM.net readers usually starts when an investor reads a CANSLIM.net report and buys a featured stock before it has risen above the pivot point by greater than 5%. After a stock breaks out above its pivot point, there is only a +5% window that investors have to purchase the stock under the proper guidelines. Once a stock rises above the "maximum buy price" the risk of a shake out balloons, meaning that even a normal retracement in the stock might force you to employ the 7-8% loss cutting rule. Much can be told by the stock's daily action in the weeks and months that follow a breakout. Typically, a light volume and orderly pullback suggests that the bulls remain in control. However, high volume pullbacks that violate support paint a totally different picture.
CROCS Inc. (CROX +$2.59 or +3.83% to $70.30) rose to a new all-time high with volume +38% above average today as it broke out of an advanced "three weeks tight" type of trading pattern marked by very quiet volume and many closes in a very tight range. The stock was recently featured at $58.99 in the Special Report titled ''7 Stocks That Should Now Be On Your Watch List'' with an annotated graph (click here). A few days later, on Thursday, August 30, 2007, CROX appeared in the CANSLIM.net Featured Stock Update (read here) with a pivot point of $61.45 among the details in the write-up explaining how this high-ranked leader was setting up to trigger a technical buy signal. Approximately one month later, patient CANSLIM.net members were rewarded when CROX surged above its pivot point on enough more than enough volume needed to trigger a proper new technical buy signal. That action was recognized on Tuesday, September, 25, 2007 in the CANSLIM.net Mid Day Breakouts Report (read here). The stock quickly rallied approximately +10%, then spent the next three weeks tracing out an advance 3-weeks tight trading pattern.
The fact that this stock was up while the major averages and majority of leading stocks declined is a great sign of relative strength. Based upon CROX's new pivot point of $69.40 (10/3/07 high plus $0.10) and its maximum buy price of $72.87, the stock triggered its latest technical buy signal when it vaulted into new high territory with a solid gain on above average volume, however volume under the +50% above average guideline left some questions about the level of institutional buying (the I criteria) demand. When a strong stock breaks out of a three weeks tight pattern, it offers shareholders, and other investors, a chance to accumulate more shares at a strategically advantageous price. CROX sports a healthy Earnings Per Share (EPS) rating of 84. It is also encouraging to see the company earn a highest-possible Relative Strength (RS) rating of 99. The company has managed to increase its earnings by triple digit percentages, well above the +25% guideline, in each of the past six quarterly comparisons versus the year earlier, satisfying the C criteria. CROX resides in the Apparel-shoes group which is currently ranked 64th of out the 197 Industry Groups covered in the paper, placing it just outside the much preferred top quartile. Leadership from others in the group like Deckers Outdoor Corp (DECK) help it satisfy the L criteria. Always limit losses per the 7-8% sell rule, and never hold a stock if it falls more than that much from your purchase price.
This stock was first featured in the Tuesday, January 30, 2007 CANSLIM.net Mid Day Breakouts Report (read here) with a $25.18 (split adjusted) pivot point. Early on, CROX experienced a lot of whipsaw type action which made it difficult to trade for meaningful gains. Then in early May, CROX experienced a "break-away" gap after reporting their first quarter results and found support near its 50-day moving average line on the pullbacks since.
C A N S L I M | StockTalk | News | Chart | SEC | Zacks Reports | ![]()
![]()
![]()

View all notes | Alert me of new notes | CANSLIM.net Company Profile
Leader Consolidating Near Pivot Point - Thursday, August 30, 2007
Group action plays a very important role, and experienced investors learn that they can increase their odds of picking a great winner by always focusing their buying efforts in the market's leading groups. The "L" criteria in CAN SLIM(R) tells us to choose leading companies in leading industry groups, thus it is suggested that investors choose from the top quartile of the 197 Industry Groups (listed in the paper most days on page B4). A classic example of the success enjoyed by many CANSLIM.net readers usually starts when an investor reads a CANSLIM.net report and buys a featured stock before it has risen above the pivot point by greater than 5%. After a stock breaks out above its pivot point, there is only a +5% window that investors have to purchase the stock under the proper guidelines. Once a stock rises above the "maximum buy price" the risk of a shake out balloons, meaning that even a normal retracement in the stock might force you to employ the 7-8% loss cutting rule. Much can be told by the stock's daily action in the weeks and months that follow a breakout. Typically, a light volume and orderly pullback suggests that the bulls remain in control. However, high volume pullbacks that violate support paint a totally different picture.
Crocs Inc. . (CROX -$0.96 or -1.62% to $58.18) ended lower on light volume as it continued consolidating below its latest pivot point. The stock was recently featured in the Special Report titled ''7 Stocks That Should Now Be On Your Watch List'' with a graph annotated by the CANSLIM.net expert staff (click here) with pivot point of $61.45. CROX sports a very healthy Earnings Per Share (EPS) rating of 84. It is also encouraging to see the company earn a highest-possible Relative Strength (RS) rating of 99. The company has managed to increase its earnings by triple digit percentages, well above the +25% guideline, in each of the past six quarterly comparisons versus the year earlier, satisfying the "C" criteria. CROX resides in the Apparel-shoes group which is currently ranked 60th of out the 197 Industry Groups covered in the paper, placing it just outside the much preferred top quartile. The stock is currently trading below its pivot point and above its 50 DMA line. As long as CROX does not trade below its 50 DMA line, the bulls are in control. A new technical buy signal may be triggered if it trades above its latest pivot point with gains backed by at least +50% above average volume, and it should remain on disciplined investors' watch list until then. Always limit losses per the 7-8% sell rule, and never hold a stock if it falls more than that much from your purchase price.
This stock was first featured in Tuesday's January 30, 2007 CANSLIM.net Mid Day Breakouts Report (read here) with a $25.18 (split adjusted) pivot point. Early on, CROX experienced a lot of whipsaw type action which made it difficult to trade for meaningful gains.
Then in early May, CROX experienced a "break-away" gap after reporting their first quarter results and has hardly looked back since.C A N S L I M | StockTalk | News | Chart | SEC | Zacks Reports

View all notes | Alert me of new notes | CANSLIM.net Company Profile
CROX - 7 Stocks That Should Now Be On Your Watch List - Sunday, August 26, 2007
|
Crocs Inc. |
||
|
Ticker Symbol: CROX (NASDAQ) |
Industry Group: Apparel - Shoes Rel Mfg |
Shares Outstanding: 81,500,000 |
|
Price: $58.99 4:00PM ET 8/24/2007 |
Day's Volume: 5,476,800 8/24/2007 |
Shares in Float: 67,700,000 |
|
52 Week High: $61.35 8/03/2007 |
50-Day Average Volume: 7,060,400 |
Up/Down Volume Ratio: 1.3 |
|
Pivot Point: $61.45 8/03/2007 high plus .10 |
Pivot Point +5% = Max Buy Price: $64.52 |
Web Address: http://www.crocs.com/ |
C A N S L I M | StockTalk | News | Chart | SEC | Zacks Reports

CANSLIM.net Company Profile: Crocs, Inc. and its subsidiaries design, develop, and manufacture consumer products from specialty resins worldwide. It is mainly known for its funky footwear styles for men, women, and children. The company also offers apparel and accessories, including t-shirts, sweatshirts, hats, beanies, and socks. It also manufactures spa pillows for the home spa market; seats and pads for use in kayaks and canoes; and scuba diving fins for other water sports, and produces and distributes hockey and lacrosse equipment. It sells its products through other specialty channels, including gift shops, uniform suppliers, independent bicycle dealers, specialty food retailers, health and beauty stores, and other specialty stores. Crocs has company-operated kiosks that are located in high foot traffic areas, and directly sells to consumers through its Web site. The company is headquartered in Niwot, Colorado and was founded as Western Brands, LLC in 1999 and changed its name in 2005. Insiders own 12% of its shares, keeping their focus on building and maintaining sharesholder value. This high-ranked leader hails from the Apparel-shoes Rel Mfg group which is ranked 48th out of the 197 Industry Groups covered in the newspaper, placing it in the top quartile needed to satisfy the "L" criteria. The number of top-rated mutual funds owning this company's shares rose from 62 in September '06 to 147 in Jun '07, which is encouraging news concerning the "I" criteria. It has a healthy 84 Earnings Per Share Rank (EPS) and a best-possible 99 Relative Strength (RS) rank.
What to Look For and What to Look Out For: Look for CROX do some additional base building and eventually follow through with a breakout above prior chart highs with considerable gains coming on at least +50% heavier than average volume being a proper technical buy signal. Meanwhile, any negative reversal would prompt concern, and a close back under its 50-day moving average (DMA) line would trigger a technical sell signal. Always limit losses per the 7-8% sell rule, and never hold a stock if it falls more than that much from your purchase price. Also, keep in mind that satisfying the "M" criteria calls for being sure the major averages first produce a proper follow-through day before initiating any new positions. Market conditions need to show technical improvement and leadership (new highs) must expand, otherwise odds are stacked against investors for now. Investors are not following the guidelines and discipline needed to be most successful when they try to get a head start by buying stocks "early", before a proper follow-through day occurs. Those who do not follow the guidelines are more prone to failure.
Technical Analysis: This chart pattern may now be considered an advanced bullish pattern known as an "ascending base", which typically features a considerable run up marked by three price corrections of 10-20%. CROX was first featured in the January 30th, 2007 CANSLIM.net Mid Day Breakouts Report (read here) with a $25.18 pivot point (split adjusted). After triggering a technical buy signal CROX, and the broader market, went through a tough correction. The stock spent a few more months basing before triggering its latest technical buy signals. On May 4th, 2007 its "break-away gap" was a bullish buy signal after it reported stellar earnings results. The stock nearly doubled before it placed a near term top of $61.35 on August 3, 2007. Since then, the stock has pulled back and bounced near its 50 DMA line. It is again near new all-time highs with virtually no resistance remaining due to overhead supply.
STWNM - Leader Resting Near Its Latest Pivot Point - Wednesday, January 31, 2007
|
Crocs Inc. |
| |
|
Ticker Symbol: CROX (NASDAQ) |
Industry Group: Apparel-shoes MFG |
Shares Outstanding: 39,000,000 |
|
Price: $50.34 4:00PM ET |
Day's Volume: 1,403,000 1/31/2007 4:00PM ET |
Shares in Float: 30,000,000 |
|
52 Week High: $53.00 1/30/2007 4:00PM ET |
50-Day Average Volume: 1,598,200 |
Up/Down Volume Ratio: 1.1 |
|
Pivot Point: $50.35 11/15/2006 high plus $0.10 |
Pivot Point +5% = Max Buy Price: $52.87 |
Web Address: http://www.crocs.com/ |
C A N S L I M | StockTalk | News | Chart | SEC | Zacks Reports

View all notes | Alert me of new notes | CANSLIM.net Company Profile
Company Description: Crocs, Inc. engages in the design, manufacture, and marketing of footwear for men, women, and children under the crocs brand worldwide. The company produces soft and lightweight, non marking, and slip- and odor-resistant shoes. It also manufactures and sells a line of crocs-branded apparel and accessory items, which include t-shirts, sweatshirts, hats, beanies, and socks, sunglasses, baseball hats, power straps, and kneepads; and non-branded products, such as spa pillows and kayak seats that are marketed to original equipment manufacturers. The company distributes its products through approximately 6,500 store locations in the
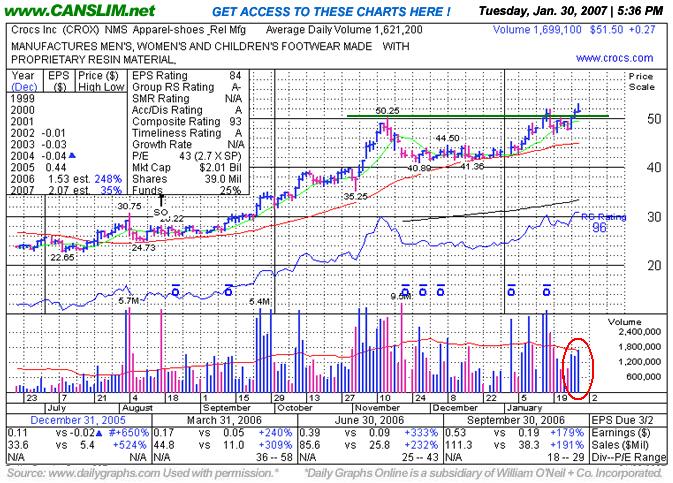
What to Look For and What to Look Out For: Unfortunately, volume, a critical indicator of institutional demand ("I" criteria), was only about average or below average for CROX on its 5 most recent up sessions. This week CROX traded above its $50.35 pivot point again, but its volume was below the minimum guideline of at least +50% above average which is necessary to trigger a proper technical buy signal. Whenever a stock clears resistance at prior chart highs with gains backed by heavy volume, the odds become greatly skewed in favor of that stock making even further gains. A new technical buy signal will be triggered for CROX only when there are meaningful gains and volume jumps above the guideline behind those gains. However, if this issue rolls over and technically falls back into its prior base, any close under its November 18th high close of $48.82 would raise greater concerns. An upward trendline can also be drawn connecting recent chart lows to determine additional technical support above its 50 DMA line. As always, selling whenever a stock falls more than 7-8% from your purchase price is the smartest defense.
Technical Analysis: This stock has already doubled since going public in February 2006, with much of the gains occurring in the third quarter of 2006. That already helps identify it as a strong performer. After such an impressive sprint, the stock pulled back and formed a cup shaped base, finding support near its 50 DMA line. Since surviving that test of important support the stock has bounced nicely from that level, and it recently spiked up to new all-time highs. However, the bullish action was immediately rejected and CROX pulled back, putting some recent buyers very close to the -8% sell point before finding support. The selling pressure abated, and CROX rallied to new highs again, but volume has failed to confirm the breakout. Therefore, sufficient volume will be needed for CROX to trigger a new technical buy signal.
Volume Lacks As Stock Trades Above Pivot Point - Tuesday, January 30, 2007
Volume is a vital component of technical analysis. Prudent investors that incorporate volume into their stock analysis have often benefited several fold. Ideally, healthy stocks will more often tend to rise on higher volume and pullback on lighter volume. Volume is a great proxy for institutional sponsorship. Conversely, high volume declines can be an ominous, as this usually signals distribution and further price deterioration are more likely to follow.
Crocs Inc. (CROX +0.27 or +0.52% to $51.50) jumped to a new all-time high, but volume behind the gains was unconvincing, failing to meet the necessary levels to trigger a proper technical buy signal. This stock was first featured in today's CANSLIM.net Mid Day Breakouts Report (read here) with a $50.35 pivot point. It recently bounced off its 50-day moving average (DMA) line after a considerable run up. CROX sports a healthy Earnings Per Share (EPS) rating of 84 which means that its earnings history is better than 84% of all other publicly traded companies. The stock resides in the Apparel-shoes group which is currently ranked 42nd out of 197 Industry Groups covered in the paper, placing it in the much coveted top quartile - satisfying the "L" criteria.
Whenever a stock clears resistance with gains backed by heavy volume, the odds are greatly skewed in favor of even further gains. Unfortunately, volume, a critical indicator of institutional demand ("I" criteria), was only about average. This is worrisome because it is less than the minimum guideline of at least +50% above average which is necessary to trigger a proper technical buy signal. A new technical buy signal will be triggered only when there are meaningful gains and volume jumps above the guideline. However, if this issue rolls over and falls back into its prior base, any close back under its best prior high closes prompts concern. In this case, any close below its pivot point will negate the recent bullish action, which would technically be a sign that even further consolidation may be in order. As always, selling whenever a stock falls more than 7-8% from your purchase price is the smartest defense.
C A N S L I M | StockTalk | News | Chart | ![]() DGO | SEC | Zacks Reports
DGO | SEC | Zacks Reports
View all notes | Alert me of new notes | CANSLIM.net Company Profile