There are 3 more featured stock write-ups on since to 1/6/2025
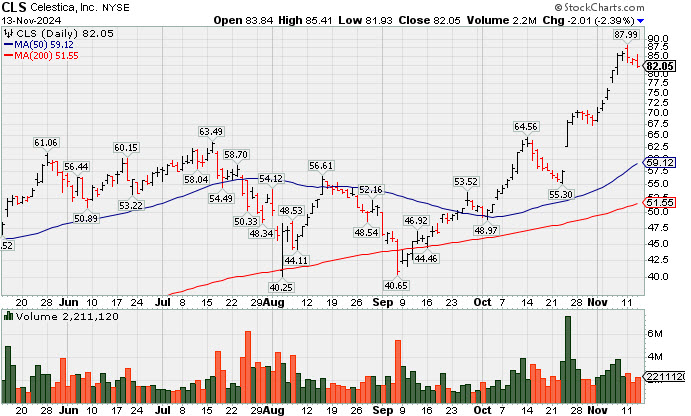
Pulling Back After Considerable Rally - Wednesday, November 13, 2024
Celestica (CLS -$2.01 or -2.39% to $82.05) pulled back for a 3rd consecutive loss backed by average volume after a "negative reversal" at its all-time high. It is extended from any sound base after a noted spurt of volume-driven gains. Prior highs in the $63 area define initial support to watch above its 50-day moving average (DMA) line ($59.12).CLS was highlighted in yellow in the 10/11/24 mid-day report (read here) with new pivot point cited based on its 7/16/24 high plus 10 cents. It was shown in greater detail in this FSU section that evening with an annotated graph under the headline, "Celistica Hits New All-Time High With 8th Straight Gain". It hails from the high ranked Elec-Contract Mfg group which is now ranked 50th on the 197 Industry Groups List (L criteria). CLS recently reported earnings +60% on +22% sales revenues for the Sep '24 quarter versus the year ago period, and 9 of the last 10 quarterly comparisons were at or above the +25% minimum earnings guideline (C criteria). Annual earnings (A criteria) history has been strong since bottoming in FY '19. It has a highest possible 99 Earnings Per Share Rating.
There are only 116.4 million shares outstanding (S criteria) which can contribute to greater price volatility in the event of institutional buying or selling. The number of top-rated funds owning its shares rose from 322 in Jun '23 to 644 in Sep '24, a reassuring sign concerning the I criteria. Its current Up/Down Volume Ratio of 2.1 is an unbiased indication its shares have been under accumulation over the past 50 days.
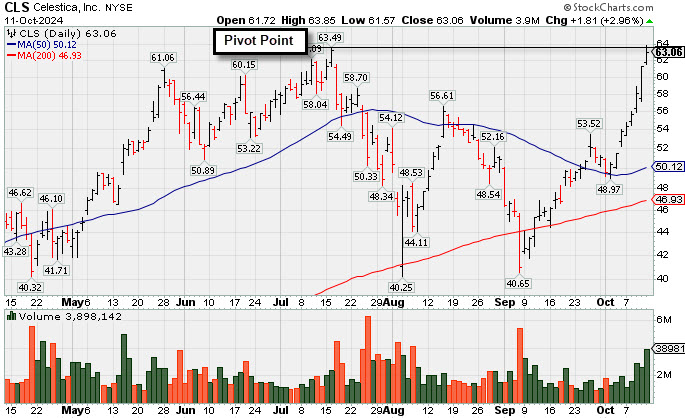
Celistica Hits New All-Time High With 8th Straight Gain -
Celestica (CLS +$1.81 or +2.96% to $63.06) was highlighted in yellow in the earlier mid-day report (read here) with new pivot point cited based on its 7/16/24 high plus 10 cents. It touched a new all-time high with its 8th consecutive volume-driven gain. Subsequent gains and a strong close above the pivot point backed by at leats +40% above average volume may trigger a proper new technical buy signal. Fundamentals remain strong.CLS was last shown in detail in this FSU section on 7/19/24 with an annotated graph under the headline, "Testing 50-Day Moving Average Line After Wedging to New High".It found prompt support near its 200-day moving average (DMA) line during its consolidation, then rebounded since dropped from the Featured Stocks list on 7/29/24.
There are only 121.5 million shares outstanding (S criteria) which can contribute to greater price volatility in the event of institutional buying or selling. The number of top-rated funds owning its shares rose from 322 in Jun '23 to 652 in Sep '24, a reassuring sign concerning the I criteria. Its current Up/Down Volume Ratio of 1.6 is an unbiased indication its shares have been under accumulation over the past 50 days.
Chart courtesy of www.stockcharts.com
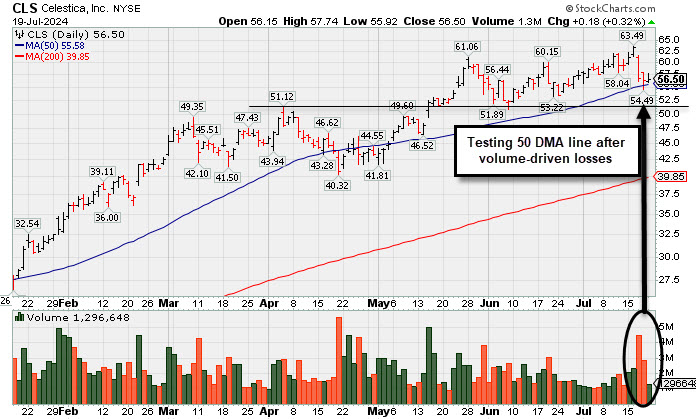
Testing 50-Day Moving Average Line After Wedging to New High - Friday, July 19, 2024
Celestica (CLS +$0.18 or +0.32% to $56.50) halted its slide today following 2 consecutive volume-driven losses testing its 50-day moving average (DMA) line after quietly touching a new all-time high. It has been repeatedly noted - "A gain backed by at least +40% above average volume and a close above the new pivot point cited based on its 5/28/24 high plus 10 cents may trigger a proper technical buy signal. Important support is at its 50 DMA line ($54.60)."
CLS was highlighted in yellow in the 5/15/24 mid-day report (read here) with pivot point cited based on its 4/04/24 high plus 10 cents after a 6-week flat base. It was last shown in detail in this FSU section on 6/27/24 with an annotated graph under the headline, "Consolidating Above Prior Highs in an Orderly Fashion".
There are only 119 million shares outstanding (S criteria) which can contribute to greater price volatility in the event of institutional buying or selling. The number of top-rated funds owning its shares rose from 322 in Jun '23 to 566 in Jun '24, a reassuring sign concerning the I criteria. Its current Up/Down Volume Ratio of 1.4 is an unbiased indication its shares have been under accumulation over the past 50 days.
Chart courtesy of www.stockcharts.com
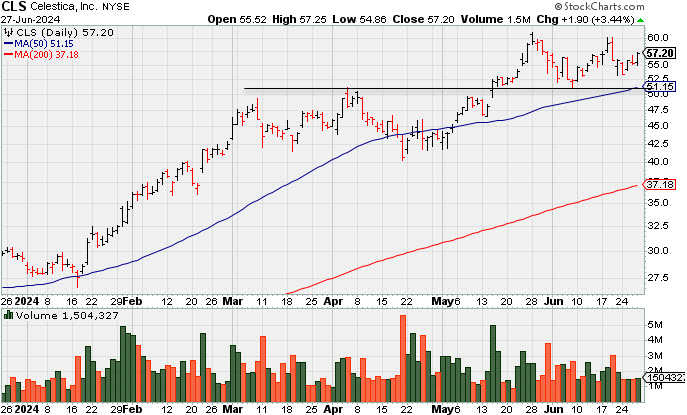
Consolidating Above Prior Highs in an Orderly Fashion - Thursday, June 27, 2024
Celestica (CLS +$1.90 or +3.44% to $57.20) is consolidating above its 50-day moving average (DMA) line and perched within striking distance of its all-time high. Prior highs and its 50 DMA line define near-term support to watch in the $51 area define near-term support to watch. CLS was highlighted in yellow in the 5/15/24 mid-day report (read here) with pivot point cited based on its 4/04/24 high plus 10 cents after a 6-week flat base. It was last shown in detail in this FSU section on 6/04/24 with an annotated graph under the headline, "Steady Pullback to Below "Max Buy" Level Following Rally".
There are only 119 million shares outstanding (S criteria) which can contribute to greater price volatility in the event of institutional buying or selling. The number of top-rated funds owning its shares rose from 322 in Jun '23 to 520 in Mar '24, a reassuring sign concerning the I criteria. Its current Up/Down Volume Ratio of 1.6 is an unbiased indication its shares have been under accumulation over the past 50 days.
Chart courtesy of www.stockcharts.com
| Symbol/Exchange Company Name Industry Group | PRICE | CHANGE | Day High | Volume (% DAV) (% 50 day avg vol) | 52 Wk Hi | Featured Date | Price Featured | Pivot Featured |
| Max Buy | ||||||||
TransDigm Group Aerospace/Defense | $1,288.65 | -12.18 -0.94% | $1,303.00 | 321,841 50 DAV is 219,000 | $1,369.58 -5.91% | 4/12/2024 | $1,224.21 | PP = $1,246.32 |
| MB = $1,308.64 | ||||||||
| Most Recent Note - 6/26/2024 5:33:02 PM G - Testing its 50 DMA line ($1,295) and recent lows which define important near-term support to watch. More damaging losses would raise greater concerns. Fundamentals remain strong. >>> FEATURED STOCK ARTICLE : Transdigm Consolidating Above 50-Day Moving Average - 6/12/2024 | View all notes | Set NEW NOTE alert | Company Profile | SEC News | Chart | Request a new note | ||||||||
U.S. Lime & Minerals Bldg-Cement/Concrt/Ag | $360.79 | +1.33 0.37% | $365.80 | 10,678 50 DAV is 24,000 | $378.78 -4.75% | 6/18/2024 | $356.30 | PP = $378.88 |
| MB = $397.82 | ||||||||
| Most Recent Note - 6/26/2024 5:33:58 PM Y - Volume totals have been cooling while consolidating above its 50 DMA line. Color code was changed to yellow with new pivot point cited based on its 5/15/24 high plus 10 cents. Subsequent gains above the pivot point backed by at least +40% above average volume may trigger a new technical buy signal. Recently found prompt support near its 50 DMA line ($334.61). Fundamentals remain strong. >>> FEATURED STOCK ARTICLE : Streak of Losses Testing 50-Day Moving Average Line - 6/6/2024 | View all notes | Set NEW NOTE alert | Company Profile | SEC News | Chart | Request a new note | ||||||||
Celestica Elec-Contract Mfg | $57.20 | +1.90 3.44% | $57.25 | 1,522,992 50 DAV is 2,446,000 | $61.06 -6.32% | 5/15/2024 | $51.52 | PP = $51.22 |
| MB = $53.78 | ||||||||
G - Consolidating in an orderly fashion but it has not formed a sound base of sufficient length. Important support is at prior highs in the $51 area and its 50 DMA line. See the latest FSU analysis for more details and a new annotated graph. >>> FEATURED STOCK ARTICLE : Consolidating Above Prior Highs in an Orderly Fashion - 6/27/2024 | View all notes | Set NEW NOTE alert | Company Profile | SEC News | Chart | Request a new note | ||||||||
Deckers Outdoor Apparel-Shoes and Rel Mfg | $999.91 | +18.65 1.90% | $1,003.04 | 327,517 50 DAV is 342,000 | $1,106.89 -9.66% | 5/24/2024 | $1,010.60 | PP = $956.27 |
| MB = $1,004.08 | ||||||||
| Most Recent Note - 6/26/2024 5:29:53 PM G - Paused today after 10 consecutive losses. Prior highs in the $956 area define initial support to watch. >>> FEATURED STOCK ARTICLE : Deckers Consolidating Near High - 6/13/2024 | View all notes | Set NEW NOTE alert | Company Profile | SEC News | Chart | Request a new note | ||||||||
e.l.f. Beauty Cosmetics/Personal Care | $218.00 | +13.41 6.55% | $218.50 | 1,424,454 50 DAV is 1,563,000 | $221.83 -1.73% | 6/18/2024 | $212.40 | PP = $221.93 |
| MB = $233.03 | ||||||||
Y - Posted a big gain today with near average volume for a best-ever close. Color code was changed to yellow with new pivot point cited based on its 3/04/24 high plus 10 cents. Subsequent gains above the pivot point backed by at least +40% above average volume may trigger a new (or add-on) technical buy signal. Its 50 DMA line ($179) defines important near-term support to watch. >>> FEATURED STOCK ARTICLE : Perched Within Striking Distance of All-Time High - 6/20/2024 | View all notes | Set NEW NOTE alert | Company Profile | SEC News | Chart | Request a new note | ||||||||
| Symbol/Exchange Company Name Industry Group | PRICE | CHANGE | Day High | Volume (% DAV) (% 50 day avg vol) | 52 Wk Hi | Featured Date | Price Featured | Pivot Featured |
| Max Buy | ||||||||
PDD Holdings ADR Retail-Internet | $131.94 | -6.29 -4.55% | $136.35 | 10,608,626 50 DAV is 9,659,000 | $164.69 -19.89% | 5/24/2024 | $161.85 | PP = $153.09 |
| MB = $160.74 | ||||||||
G - Color code is changed to green after slumping well below its 50 DMA line ($139.66) with today''s 9th consecutive loss. A rebound above the 50 DMA line is needed for its outlook to improve. >>> FEATURED STOCK ARTICLE : Still Sputtering Below Pivot Point After Negating Breakout - 6/17/2024 | View all notes | Set NEW NOTE alert | Company Profile | SEC News | Chart | Request a new note | ||||||||
CrowdStrike Holdings Computer Sftwr-Security | $387.29 | +6.92 1.82% | $391.54 | 3,294,382 50 DAV is 4,843,000 | $394.64 -1.86% | 5/28/2024 | $351.47 | PP = $365.10 |
| MB = $383.36 | ||||||||
| Most Recent Note - 6/25/2024 6:10:28 PM Y - Posted a gain today with lighter volume after 3 volume-driven losses, consolidating below its "max buy" level. Its 50 DMA line ($333) defines near-term support to watch. Bullish action came after it reported Apr '24 quarterly earnings +63% on +33% sales revenues versus the year-ago period, continuing its strong earnings track record. >>> FEATURED STOCK ARTICLE : Encountered Distributional Pressure Hovering Near All-Time High - 6/21/2024 | View all notes | Set NEW NOTE alert | Company Profile | SEC News | Chart | Request a new note | ||||||||
Novo Nordisk ADR Medical-Ethical Drugs | $144.49 | +0.82 0.57% | $145.36 | 2,586,967 50 DAV is 3,782,000 | $148.15 -2.47% | 6/7/2024 | $143.06 | PP = $138.38 |
| MB = $145.30 | ||||||||
| Most Recent Note - 6/26/2024 12:14:01 PM G - Gapped down today, pulling back from its all-time high after a gap up on the prior session capped a streak of 5 consecutive gains. Color code is changed to yellow after retreating below its "max buy" level. Fundamentals remain strong. >>> FEATURED STOCK ARTICLE : Wedging Into New High Ground - 6/7/2024 | View all notes | Set NEW NOTE alert | Company Profile | SEC News | Chart | Request a new note | ||||||||
Granite Construction Bldg-Heavy Construction | $61.58 | -0.06 -0.10% | $62.38 | 409,156 50 DAV is 463,000 | $65.08 -5.38% | 6/11/2024 | $59.76 | PP = $64.33 |
| MB = $67.55 | ||||||||
| Most Recent Note - 6/26/2024 5:31:15 PM Y - Volume totals have been cooling while hovering near its 52-week high. Color code was changed to yellow when highlighted on the 6/11/24 mid-day report as it was noted that a valid secondary buy point exists up to +5% above the recent high after finding support at its 10 WMA line following a prior breakout. Reported improved earnings in the Jun, Sep, Dec '23, and Mar '24 quarters versus the year ago periods. Annual earnings growth has been strong and steady. >>> FEATURED STOCK ARTICLE : Granite Construction Found Support at 10-Week Moving Average - 6/11/2024 | View all notes | Set NEW NOTE alert | Company Profile | SEC News | Chart | Request a new note | ||||||||
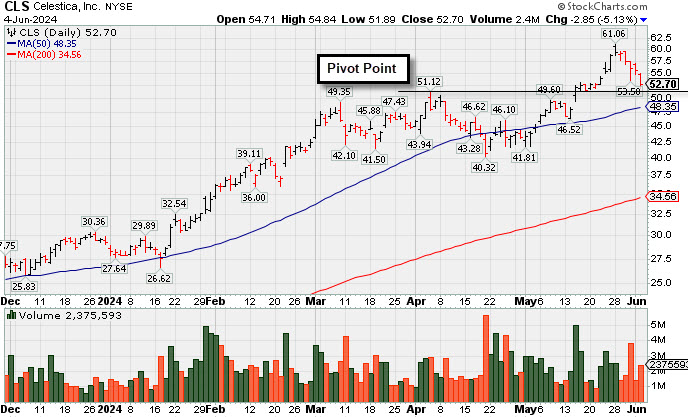
Steady Pullback to Below "Max Buy" Level Following Rally - Tuesday, June 4, 2024
Celestica (CLS -$2.86 or -5.15% to $52.71) suffered a 5th consecutive loss today, abruptly retreating from its all-time high and undercutting its 20-day moving average ($52.92). Its color code is changed to yellow affer retreating below its "max buy" level. CLS was noted recently - "Extended from the previously noted base. Prior highs in the $51 area define initial support to watch above its 50 DMA line."
CLS finished strong after highlighted in yellow in the 5/15/24 mid-day report (read here) with pivot point cited based on its 4/04/24 high plus 10 cents after a 6-week flat base. It was shown in detail that evening with an annotated graph under the headline, "Strong Breakout After 6-Week Flat Base".
There are only 119 million shares outstanding (S criteria) which can contribute to greater price volatility in the event of institutional buying or selling. The number of top-rated funds owning its shares rose from 322 in Jun '23 to 508 in Mar '24, a reassuring sign concerning the I criteria. Its current Up/Down Volume Ratio of 1.5 is an unbiased indication its shares have been under accumulation over the past 50 days.
Chart courtesy of www.stockcharts.com
| Symbol/Exchange Company Name Industry Group | PRICE | CHANGE | Day High | Volume (% DAV) (% 50 day avg vol) | 52 Wk Hi | Featured Date | Price Featured | Pivot Featured |
| Max Buy | ||||||||
TransDigm Group Aerospace/Defense | $1,340.83 | +1.64 0.12% | $1,342.32 | 153,181 50 DAV is 200,000 | $1,363.66 -1.67% | 4/12/2024 | $1,224.21 | PP = $1,246.32 |
| MB = $1,308.64 | ||||||||
| Most Recent Note - 6/3/2024 8:40:41 PM G - Still hovering near its all-time high after a "negative reversal" on 5/28/24. It is extended from any sound base and its 50 DMA line ($1,264) defines near-term support to watch on pullbacks. Fundamentals remain strong. >>> FEATURED STOCK ARTICLE : Aerospace/Defense Firm Hitting Another All-Time High - 5/21/2024 | View all notes | Set NEW NOTE alert | Company Profile | SEC News | Chart | Request a new note | ||||||||
U.S. Lime & Minerals Bldg-Cement/Concrt/Ag | $338.60 | -2.56 -0.75% | $339.85 | 19,272 50 DAV is 24,000 | $378.78 -10.61% | 2/9/2024 | $254.68 | PP = $265.09 |
| MB = $278.34 | ||||||||
G - Fell slightly today for a 13th loss in the span of 14 sessions with volume below average. Its 50 DMA line ($325) defines important near-term support to watch. Fundamentals remain strong. >>> FEATURED STOCK ARTICLE : Stubbornly Held Ground and Posted Quiet Gain for Best-Ever Close - 5/14/2024 | View all notes | Set NEW NOTE alert | Company Profile | SEC News | Chart | Request a new note | ||||||||
Celestica Elec-Contract Mfg | $52.71 | -2.86 -5.15% | $54.84 | 2,530,224 50 DAV is 2,281,000 | $61.06 -13.68% | 5/15/2024 | $51.52 | PP = $51.22 |
| MB = $53.78 | ||||||||
Y - Suffered a 5th consecutive loss today, abruptly retreating from its all-time high and undercutting its 20-day moving average ($52.92). Color code is changed to yellow after retreating below "max buy" level. Prior highs in the $51 area define initial support to watch above its 50 DMA line. See the latest FSU analysis for more details and a new annotated graph. >>> FEATURED STOCK ARTICLE : Steady Pullback to Below "Max Buy" Level Following Rally - 6/4/2024 | View all notes | Set NEW NOTE alert | Company Profile | SEC News | Chart | Request a new note | ||||||||
Archrock OilandGas-Machinery/Equip | $18.74 | -0.73 -3.75% | $19.32 | 1,665,656 50 DAV is 1,496,000 | $21.61 -13.28% | 5/20/2024 | $21.23 | PP = $21.50 |
| MB = $22.58 | ||||||||
G - Fell further today with higher (average) volume while testing its 4/19/24 low. Color code was changed to green when violating its 50 DMA line ($20) and undercutting recent lows in the $19 area raising concerns and triggering technical sell signals. A rebound above the 50 DMA line is again needed to help its outlook improve. See the latest FSU analysis for more details and an annotated graph. >>> FEATURED STOCK ARTICLE : Slump Below 50-Day Moving Average Again Hurts Outlook - 6/3/2024 | View all notes | Set NEW NOTE alert | Company Profile | SEC News | Chart | Request a new note | ||||||||
Deckers Outdoor Apparel-Shoes and Rel Mfg | $1,066.83 | -19.74 -1.82% | $1,092.20 | 225,236 50 DAV is 374,000 | $1,106.89 -3.62% | 5/24/2024 | $1,010.60 | PP = $956.27 |
| MB = $1,004.08 | ||||||||
G - Pulled back for a 2nd small loss with lighter volume. Perched at its all-time high following noted volume-driven gains. Extended from prior highs in the $956 area that define initial support to watch on pullbacks. >>> FEATURED STOCK ARTICLE : Big "Breakaway Gap" for Deckers Outdoor - 5/24/2024 | View all notes | Set NEW NOTE alert | Company Profile | SEC News | Chart | Request a new note | ||||||||
| Symbol/Exchange Company Name Industry Group | PRICE | CHANGE | Day High | Volume (% DAV) (% 50 day avg vol) | 52 Wk Hi | Featured Date | Price Featured | Pivot Featured |
| Max Buy | ||||||||
e.l.f. Beauty Cosmetics/Personal Care | $189.74 | -6.71 -3.42% | $198.49 | 1,053,708 50 DAV is 1,697,000 | $221.83 -14.47% | 5/24/2024 | $193.79 | PP = $182.73 |
| MB = $191.87 | ||||||||
Y - Pulled back today with lighter volume and its color code is changed to yellow while consolidating back below its "max buy" level after breaking out a "double-bottom" base. Prior low ($177.99 pn 5/31/24) and 50 DMA line ($172) define important near-term support to watch. >>> FEATURED STOCK ARTICLE : Down on Lighter Volume After Breakout From "Double Bottom" Base - 5/29/2024 | View all notes | Set NEW NOTE alert | Company Profile | SEC News | Chart | Request a new note | ||||||||
PDD Holdings ADR Retail-Internet | $145.88 | -1.04 -0.71% | $148.68 | 5,860,916 50 DAV is 9,515,000 | $164.69 -11.42% | 5/24/2024 | $161.85 | PP = $153.09 |
| MB = $160.74 | ||||||||
| Most Recent Note - 6/3/2024 8:37:37 PM Y - Slumping below prior highs with losses on below average volume raising concerns after it rallied to new 52-week highs with 3 consecutive volume-driven gains clearing a 20-week base. Disciplined investors avoid big losses by selling any stock that falls more than 7-8% below their purchase price. >>> FEATURED STOCK ARTICLE : Pulled Back Below Prior Highs Raising Concerns - 5/28/2024 | View all notes | Set NEW NOTE alert | Company Profile | SEC News | Chart | Request a new note | ||||||||
CrowdStrike Holdings Computer Sftwr-Security | $305.58 | -3.11 -1.01% | $312.38 | 8,305,087 50 DAV is 2,520,000 | $365.00 -16.28% | 5/28/2024 | $351.47 | PP = $365.10 |
| MB = $383.36 | ||||||||
| Most Recent Note - 6/3/2024 8:42:42 PM G - Suffered a 3rd consecutive loss today after violating its 50 DMA line ($317) triggering a technical sell signal. Due to report Apr '24 quarterly results on 6/04/24. >>> FEATURED STOCK ARTICLE : Volume-Driven Loss Triggered Technical Sell Signal - 5/30/2024 | View all notes | Set NEW NOTE alert | Company Profile | SEC News | Chart | Request a new note | ||||||||
Strong Breakout After 6-Week Flat Base - Wednesday, May 15, 2024
Celestica (CLS +$4.06 or +8.46% to $52.06) finished strong today after highlighted in yellow in the mid-day report (read here) with pivot point cited based on its 4/04/24 high plus 10 cents after a 6-week flat base. It gapped up hitting a new 52-week high (N criteria), adding to volume-driven gains after rebounding above its 50-day moving average (DMA) line. The gain and strong close above the pivot point backed by +133% above average volume clinched a proper technical buy signal.
There are only 119 million shares outstanding (S criteria) which can contribute to greater price volatility in the event of institutional buying or selling. The number of top-rated funds owning its shares rose from 322 in Jun '23 to 484 in Mar '24, a reassuring sign concerning the I criteria.
Chart courtesy of www.stockcharts.com
