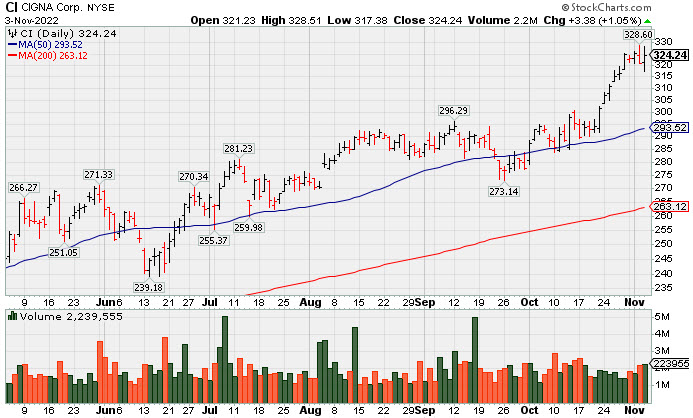
Cigna Reported Earnings Perched at High - Thursday, November 3, 2022
Cigna Corp (CI +$3.38 or +1.05% to $324.24) posted a gain today with near average volume, hovering this week at its all-time high. Its prior high ($296.29 on 9/12/22) and 50-day moving average (DMA) line ($293.68) define near-term support to watch on pullbacks. After the close it reported Sep '22 quarterly earnings +5% on +2% sales revenues versus the year ago period. Volume and volatility often increase near earnings news.
CI now has an 89 Earnings Per Share Rating. Earnings for the Jun '22 quarter rose +19% on +5% sales revenues versus the year ago period, breaking a streak of 3 quarterly earnings increases above the +25% minimum guideline (C criteria), raising fundamental concerns. Annual earnings growth (A criteria) has been strong. The Medical - Managed Care group is currently ranked 15th on the 197 Industry Groups list and has a Group Relative Strength Rating of 92 (A+), a reassuring sign concerning the L criteria.
Cigna has rallied +17.2% since highlighted in yellow with new pivot point based on its 5/31/22 high plus 10 cents in the 7/07/22 mid-day report (read here). It stubbornly held its ground and made steady progress since last shown in this FSU section on 10/04/22 with an annotated graph under the headline, "No Resistance Remains Due to Overhead Supply".
The number of top-rated funds owning its shares rose from 2,628 in Dec '21 to 2,851 in Sep '22, a reassuring sign concerning the I criteria. Its current Up/Down Volume Ratio of 1.1 is an unbiased indication its shares have been under accumulation over the past 50 days.
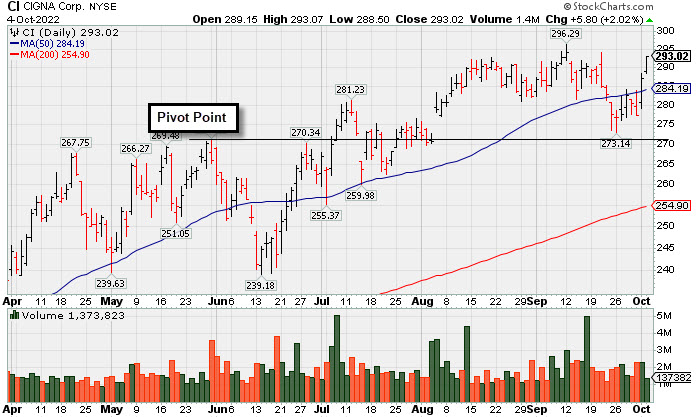
No Resistance Remains Due to Overhead Supply - Tuesday, October 4, 2022
Cigna Corp (CI +$5.80 or +2.02% to $293.02) posted a 2nd consecutive big gain as it rebounded to close only -1.1% off its all-time high. No overhead supply remains to hinder its progress. On pullbacks the 50-day moving average (DMA) line defines near-term support to watch above the recent low ($273.14 on 9/26/22).
CI has a 94 Earnings Per Share Rating. However, earnings for the Jun '22 quarter rose +19% on +5% sales revenues versus the year ago period, breaking a streak of 3 quarterly earnings increases above the +25% minimum guideline (C criteria), raising fundamental concerns. Annual earnings growth (A criteria) has been strong. Its next earnings report is still a month away. The Medical - Managed Care group is currently ranked 31st on the 197 Industry Groups list and has a Group Relative Strength Rating of 84 (A-), a reassuring sign concerning the L criteria.
Cigna was highlighted in yellow with new pivot point based on its 5/31/22 high plus 10 cents in the 7/07/22 mid-day report (read here). It showed resilience after undercutting the 50 DMA line since 9/16/22 when last shown in this FSU section with an annotated graph under the headline, "Found Support Above 50-Day Moving Average Line This Week". The number of top-rated funds owning its shares rose from 2,628 in Dec '21 to 2,848 in Jun '22, a reassuring sign concerning the I criteria. Its current Up/Down Volume Ratio of 1.3 is an unbiased indication its shares have been under accumulation over the past 50 days.
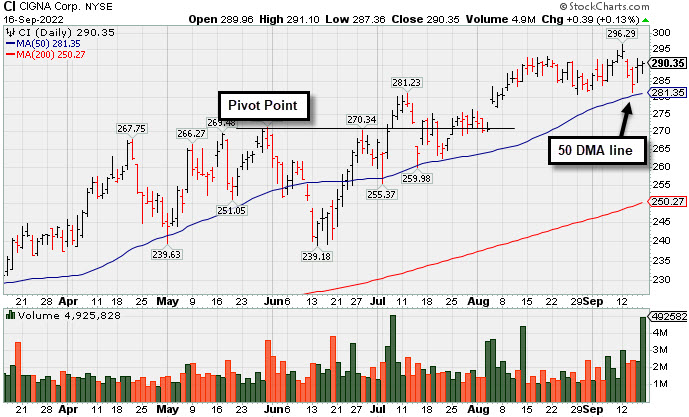
Found Support Above 50-Day Moving Average Line This Week - Friday, September 16, 2022
Cigna Corp (CI +$0.39 or +0.13% to $290.35) is consolidating above its 50 DMA line ($282.25) while perched near its all-time high hit this week. Earnings for the Jun '22 quarter rose +19% on +5% sales revenues versus the year ago period, breaking a streak of 3 quarterly earnings increases above the +25% minimum guideline (C criteria), raising fundamental concerns. Still, CI has a 94 Earnings Per Share Rating. Annual earnings growth (A criteria) has been strong.
Cigna was highlighted in yellow with new pivot point based on its 5/31/22 high plus 10 cents in the 7/07/22 mid-day report (read here). It was last shown in greater on 8/26/22 with an annotated graph under the headline, "Cigna Hovering Near High Despite Earnings Under +25% Minimum".
The number of top-rated funds owning its shares rose from 2,628 in Dec '21 to 2,866 in Jun '22, a reassuring sign concerning the I criteria. The Medical - Managed Care group is currently ranked 23rd on the 197 Industry Groups list and has a Group Relative Strength Rating of 88 (A+), a reassuring sign concerning the L criteria. Its current Up/Down Volume Ratio of 1.5 is an unbiased indication its shares have been under accumulation over the past 50 days.
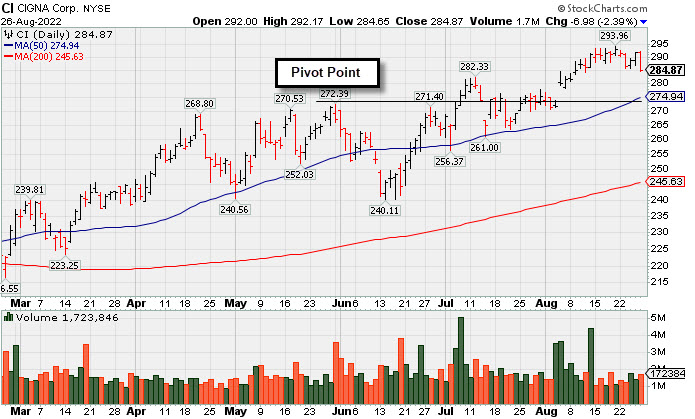
Cigna Hovering Near High Despite Earnings Under +25% Minimum - Friday, August 26, 2022
Cigna Corp (CI -$6.98 or -2.39% to $284.87) pulled back with below average volume. Volume totals have been cooling while hovering near its all-time high. Recently it reported earnings for the Jun '22 quarter rose +19% on +5% sales revenues versus the year ago period, breaking a streak of 3 quarterly earnings increases above the +25% minimum guideline (C criteria), raising concerns. Near-term support to watch is at its 50-day moving average (DMA) line ($275).
CI has a 94 Earnings Per Share Rating. Annual earnings growth (A criteria) has been strong. It was highlighted in yellow with new pivot point based on its 5/31/22 high plus 10 cents in the 7/07/22 mid-day report (read here). It was last shown in greater on 8/9/22 with an annotated graph under the headline, "Wedging Higher With Lighter Volume Behind Gain for New High".
The number of top-rated funds owning its shares rose from 2,628 in Dec '21 to 2,851 in Jun '22, a reassuring sign concerning the I criteria. The Medical - Managed Care group is currently ranked 16th on the 197 Industry Groups list and has a Group Relative Strength Rating of 92 (A), a reassuring sign concerning the L criteria. Its current Up/Down Volume Ratio of 1.8 is an unbiased indication its shares have been under accumulation over the past 50 days.
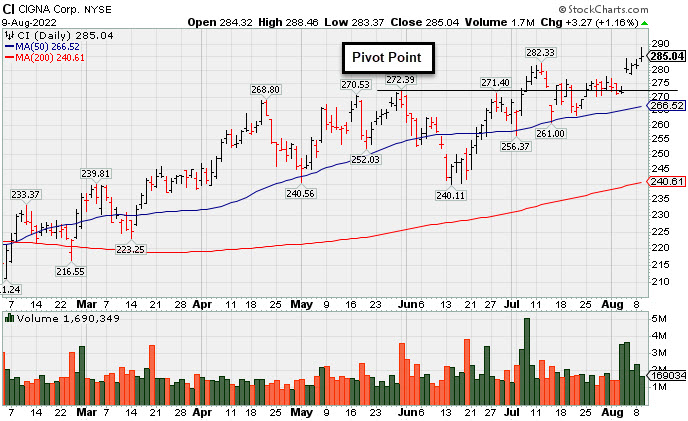
Wedging Higher With Lighter Volume Behind Gain for New High - Tuesday, August 9, 2022
Cigna Corp (CI +$3.27 or +1.16% to $285.04) wedged higher with below average volume posting a 5th consecutive gain today and hitting a new all-time high. It is still just below its "max buy" level. Recently it reported earnings news for the Jun '22 quarter +19% on +5% sales revenues versus the year ago period, breaking a streak of 3 quarterly earnings increases above the +25% minimum guideline (C criteria). Near-term support to watch on pullbacks is at its 50-day moving average (DMA) line ($266.66). More damaging losses would raise greater concerns.
CI has a 94 Earnings Per Share Rating. Annual earnings growth (A criteria) has been strong. It was highlighted in yellow with new pivot point based on its 5/31/22 high plus 10 cents in the 7/07/22 mid-day report (read here). It was last shown in greater on 7/19/22 with an annotated graph under the headline, "Pulled Back and Tested Support at 50-Day Moving Average".
The number of top-rated funds owning its shares rose from 2,628 in Dec '21 to 2,816 in Jun '22, a reassuring sign concerning the I criteria. The Medical - Managed Care group is currently ranked 17th on the 197 Industry Groups list and has a Group Relative Strength Rating of 93 (A), a reassuring sign concerning the L criteria.
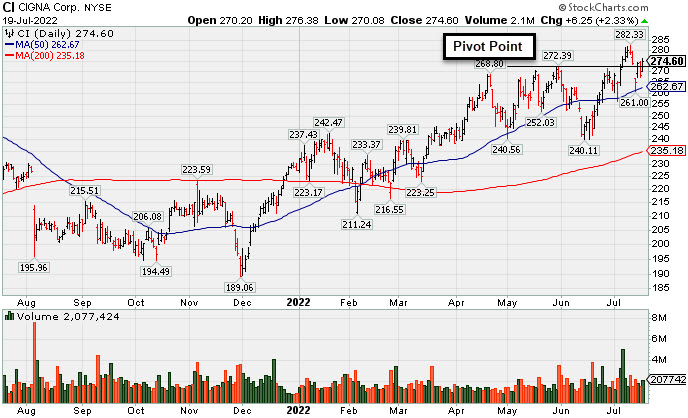
Pulled Back and Tested Support at 50-Day Moving Average - Tuesday, July 19, 2022
Cigna Corp (CI +$6.25 or +2.33% to $274.60) has shown strength after briefly undercutting prior highs in the $273 area and testing support at its 50-day moving average (DMA) line ($263.15) following volume-driven gains. More damaging losses would raise greater concerns.
CI was highlighted in yellow with new pivot point based on its 5/31/22 high plus 10 cents in the 7/07/22 mid-day report (read here). It was shown in greater detail that evening with an annotated graph under the headline, "Volume-Driven Breakout for Cigna Corp". It hit a new all-time high with a gain backed by +190% above average volume triggering a technical buy signal.
CI was highlighted in yellow with new pivot point based on its 5/31/22 high plus 10 cents in the 7/07/22 mid-day report (read here). It was shown in greater detail that evening with an annotated graph under the headline, "Volume-Driven Breakout for Cigna Corp". It hit a new all-time high with a gain backed by +190% above average volume triggering a technical buy signal.
The number of top-rated funds owning its shares rose from 2,628 in Dec '21 to 2,739 in Jun '22, a reassuring sign concerning the I criteria. The Medical - Managed Care group is currently ranked 11th on the 197 Industry Groups list and has a Group Relative Strength Rating of 96 (A+), a reassuring sign concerning the L criteria.
CI has a 94 Earnings Per Share Rating. It is due to report Jun '22 quarterly results on 8/04/22. It reported a strong +27% earnings increase on +7% sales revenues for the Mar '22 quarter versus the year ago period, its 3rd strong quarterly comparison above the +25% minimum guideline (C criteria). Annual earnings growth (A criteria) has been strong.
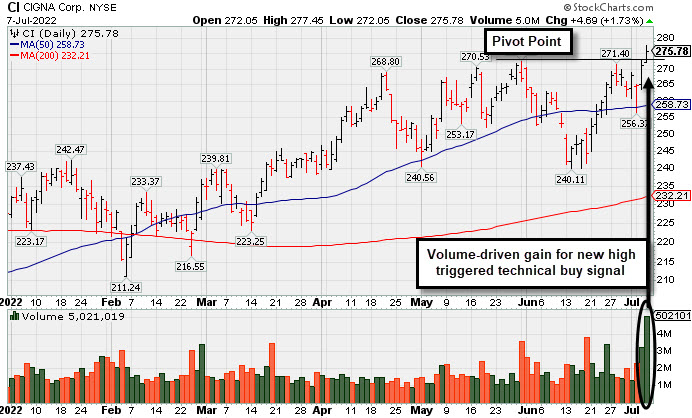
Volume-Driven Breakout for Cigna Corp - Thursday, July 7, 2022
Cigna Corp (CI +$4.69 or +1.73% to $275.78) was highlighted in yellow with new pivot point based on its 5/31/22 high plus 10 cents in the earlier mid-day report (read here). It hit a new all-time high with today's gain backed by +190% above average volume triggering a technical buy signal while adding to a big volume-driven gain on the prior session. The recent rebound above its 50-day moving average (DMA) line ($259) helped its outlook to improve since dropped from the Featured Stocks list on 6/13/22.
The number of top-rated funds owning its shares rose from 2,628 in Dec '21 to 2,724 in Jun '22, a reassuring sign concerning the I criteria. The Medical - Managed Care group is currently ranked 11th on the 197 Industry Groups list and has a Group Relative Strength Rating of 94 (A+), a reassuring sign concerning the L criteria. The ratings and numbers noted above have all improved since CI was first highlighted in yellow in the 5/06/22 mid-day report (read here) with a pivot point cited based on its 4/21/22 high, and since last shown in detail on 5/25/22 with an annotated graph under the headline, "Consolidating Above 50-Day Moving Average Near All-Time High"
CI has a 95 Earnings Per Share Rating. It reported a strong +27% earnings increase on +7% sales revenues for the Mar '22 quarter versus the year ago period, its 3rd strong quarterly comparison above the +25% minimum guideline (C criteria). Annual earnings growth (A criteria) has been strong.
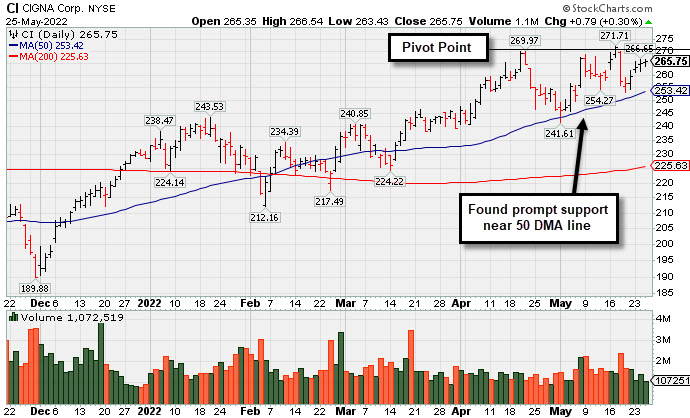
Consolidating Above 50-Day Moving Average Near All-Time High - Wednesday, May 25, 2022
Cigna Corp (CI +$0.79 or +0.30% to $265.75) posted a 4th consecutive small gain today with below average volume. It has been consolidating above its 50-day moving average (DMA) line ($253.41) after challenging its all-time high last week. Subsequent gains above the pivot point backed by at least +40% above average volume may trigger a technical buy signal. Fundamentals remain strong. New buying efforts may only be considered after a solid follow-through day confirms a new market uptrend (M criteria) under the fact-based investment system. Follow this closely in the daily market commentaries
CI was highlighted in yellow in the 5/06/22 mid-day report (read here) with a pivot point cited based on its 4/21/22 high. It was shown in greater detail that evening with an annotated graph under the headline, "Cigna Rises Near All-Time High."
CI has a 95 Earnings Per Share Rating. It reported a strong +27% earnings increase on +7% sales revenues for the Mar '22 quarter versus the year ago period, its 3rd strong quarterly comparison above the +25% minimum guideline (C criteria). Annual earnings growth (A criteria) has been strong.
The number of top-rated funds owning its shares rose from 2,628 in Dec '21 to 2,681 in Mar '22, a reassuring sign concerning the I criteria. The Medical - Managed Care group is currently ranked 27th on the 197 Industry Groups list and has a Group Relative Strength Rating of 86 (A), a reassuring sign concerning the L criteria.
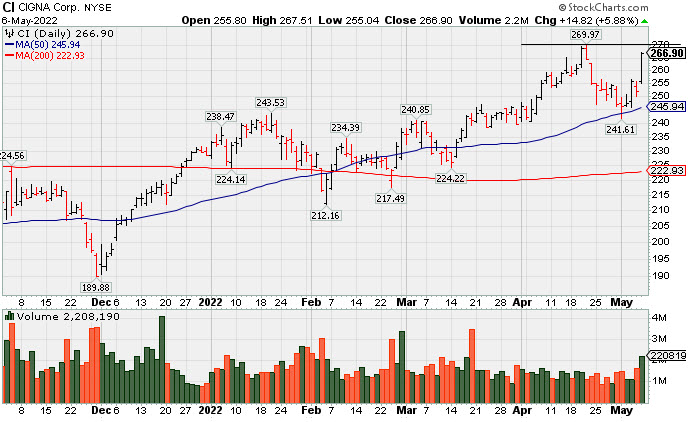
Cigna Rises Near All-Time High - Friday, May 6, 2022
Cigna Corp (CI +$14.82 or +5.88% to $266.90) finished strong after highlighted in yellow in the mid-day report with a pivot point cited based on its 4/21/22 high. It ended perched within close striking distance of its 52-week and all-time highs with today's big gain. Subsequent gains above the pivot point backed by at least +40% above average volume may trigger a technical buy signal.
CI has a 95 Earnings Per Share Rating. It reported a strong +27% earnings increase on +7% sales revenues for the Mar '22 quarter versus the year ago period, its 3rd strong quarterly comparison above the +25% minimum guideline (C criteria). Annual earnings growth (A criteria) has been strong.
CI has a 95 Earnings Per Share Rating. It reported a strong +27% earnings increase on +7% sales revenues for the Mar '22 quarter versus the year ago period, its 3rd strong quarterly comparison above the +25% minimum guideline (C criteria). Annual earnings growth (A criteria) has been strong.
The number of top-rated funds owning its shares rose from 2,628 in Dec '21 to 2,650 in Mar '22, a reassuring sign concerning the I criteria. The Medical - Managed Care group is currently ranked 36th on the 197 Industry Groups list and has a Group Relative Strength Rating of A (L criteria).