Fourth Straight Loss in Slump Violating 50-Day Moving Average Line - Monday, December 19, 2022
C B I Z Inc (CBZ -$1.10 or -2.29% to $46.97) pulled back further from its 52-week high today with a 4th consecutive loss. It has violated its 50-day moving average (DMA) line ($47.83) raising concerns and triggering a technical sell signal. It recently formed an orderly new 6-week flat base but no new pivot point was cited because it had made little headway from the prior base and remained below the "max buy" level. Only a prompt rebound above its 50 DMA line would help its outlook improve.
The company's Earnings Per Share Rating fell from 95 to 94 after it reported Sep '22 quarterly earnings +24% on +28% sales revenues versus the year ago period. CBZ was highlighted in yellow in the 10/26/22 mid-day report (read here) and last shown in greater detail on 11/18/22 with an annotated graph under the headline, "Gapped Up and Rebounded Above Pivot Point". The prior 2 quarterly comparisons were above the +25% minimum earnings guideline (C criteria). Annual earnings (A criteria) history has been strong.
The number of top-rated funds owning its shares rose from 361 in Dec '21 to 381 in Sep '22. Its current Up/Down Volume Ratio of 1.1 is an unbiased indication its shares have been under slight distributional pressure over the past 50 days. There are only 50.8 million shares outstanding (S criteria) which can contribute to greater volatility in the event of institutional buying or selling. It has an A Timeliness Rating and a B Sponsorship Rating.
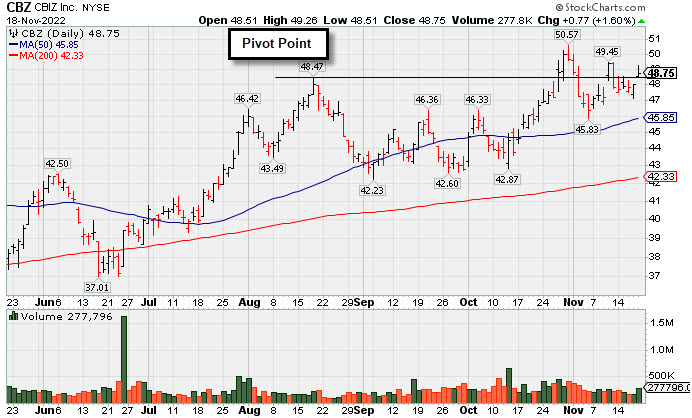
Gapped Up and Rebounded Above Pivot Point - Friday, November 18, 2022
C B I Z Inc (CBZ +$0.76 or +1.58% to $48.74) gapped up today for a small gain with light volume yet rebounded above its pivot point. Its 50-day moving average (DMA) line ($45.85) and recent low define important near-term support. Recently reported Sep '22 quarterly earnings +24% on +28% sales revenues versus the year ago period.
CBZ was highlighted in yellow in the 1`0/26/22 mid-day report and last shown in greater detail that evening with an annotated graph under the headline, "Earnings Report Due for Commercial Services and Consulting Firm." The company has a 95 Earnings Per Share Rating. It reported earnings +26% on +30% sales revenues for the Jun '22 quarter versus the year ago period, its 2nd strong quarter above the +25% minimum earnings guideline (C criteria). Annual earnings (A criteria) history has been strong.
The number of top-rated funds owning its shares rose from 361 in Dec '21 to 376 in Sep '22. Its current Up/Down Volume Ratio of 0.8 is an unbiased indication its shares have been under slight distributional pressure over the past 50 days. There are only 50.8 million shares outstanding (S criteria) which can contribute to greater volatility in the event of institutional buying or selling. It has an A Timeliness Rating and a B Sponsorship Rating.
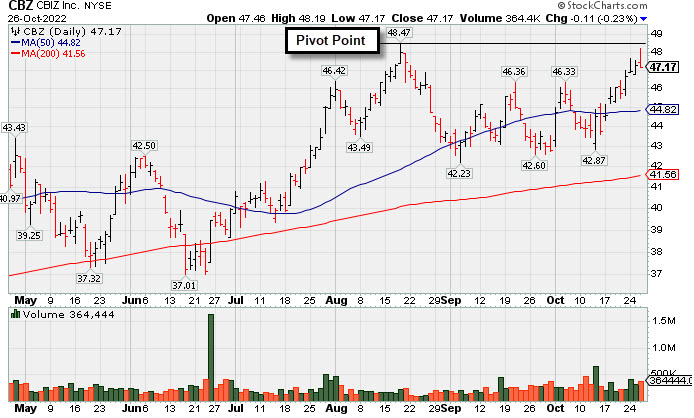
Earnings Report Due for Commercial Services and Consulting Firm - Wednesday, October 26, 2022
C B I Z Inc (CBZ -$0.11 or -0.23% to $47.17) made a "negative reversal" today after challenging its 52-week high and it closed near the session low after highlighted in yellow in the earlier mid-day report (read here) with pivot point cited based on it 8/18/22 high plus 10 cents. It is perched within close striking distance of its 52-week high after rebounding above its 50-day moving average (DMA) line ($44.82) with recent volume-driven gains. Members were cautioned - "Due to report Sep '22 quarterly results. Volume and volatility often increase near earnings news."
The Comml Svcs-Consulting firm has a 95 Earnings Per Share Rating. It reported earnings +26% on +30% sales revenues for the Jun '22 quarter versus the year ago period, its 2nd strong quarter above the +25% minimum earnings guideline (C criteria). Annual earnings (A criteria) history has been strong.
The number of top-rated funds owning its shares rose from 361 in Dec '21 to 371 in Sep '22. Its current Up/Down Volume Ratio of 0.9 is an unbiased indication its shares have been under slight distributional pressure over the past 50 days. There are only 51.3 million shares outstanding (S criteria) which can contribute to greater volatility in the event of institutional buying or selling. It has an A Timeliness Rating and a C Sponsorship Rating.


