Perched Near High After Recent Breakout - Tuesday, February 7, 2023
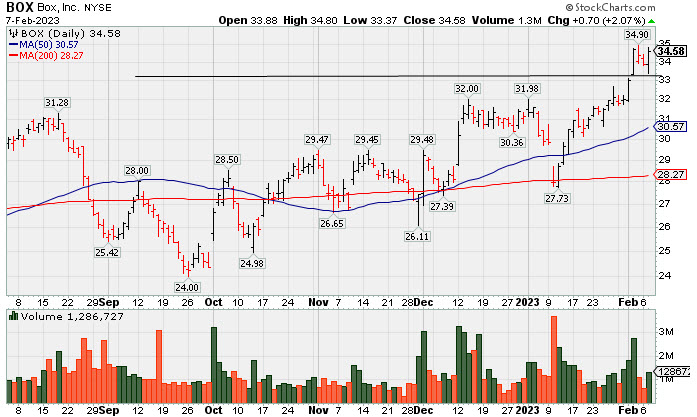
Box Inc Cl A (BOX +$0.70 or +2.07% to $34.58) remains perched near its high after volume-driven gains. On 2/02/23 it broke out above a new pivot point cited based on its 4/20/22 high plus 10 cents. Prior highs in the $31 area define initial support to watch on pullbacks.
BOX was highlighted in yellow with pivot point cited based on its 11/01/22 high plus 10 cents in the 12/12/22 mid-day report (read here). It was last shown in greater detail on 1/24/23 with an annotated graph under the headline, "Perched Above "Max Buy" Level Near Recent Highs".
BOX reported Oct '22 quarterly earnings +41% on +12% sales revenues over the year ago period, above the +25% minimum earnings guideline (C criteria) for the 3rd consecutive quarterly comparison. Quarterly and annual earnings increases have been strong and steady. It has a 97 Earnings Per Share Rating.
There are 142.9 million shares outstanding. The number of top-rated funds owning its shares rose from 468 in Dec '21 to 593 in Dec '22, a reassuring sign concerning the I criteria. Its current Up/Down Volume Ratio of 1.6 is an unbiased indication its shares have been under accumulation over the past 50 days.
Perched Above "Max Buy" Level Near Recent Highs - Tuesday, January 24, 2023
Box Inc Cl A (BOX -$0.13 or -0.41% to $31.40) pulled back today for a small loss with light volume. Its color code was changed to green while trading above its "max buy" price. It has been challenging recent highs in the $31-32 area. Keep in mind it still faces some additional resistance due to overhead supply up to the $33 level. Its 50-day moving average (DMA) line ($29.68) defines important near-term support to watch on pullbacks.
BOX was highlighted in yellow with pivot point cited based on its 11/01/22 high plus 10 cents in the 12/12/22 mid-day report (read here). It was last shown in greater detail on 1/06/23 with an annotated graph under the headline, "Pulled Back After Perched Near All-Time High".
BOX reported Sep '22 quarterly earnings +41% on +12% sales revenues over the year ago period, above the +25% minimum earnings guideline (C criteria) for the 3rd consecutive quarterly comparison. Quarterly and annual earnings increases have been strong and steady. It has a 97 Earnings Per Share Rating.
There are 142.9 million shares outstanding. The number of top-rated funds owning its shares rose from 468 in Dec '21 to 576 in Dec '22, a reassuring sign concerning the I criteria. Its current Up/Down Volume Ratio of 1.5 is an unbiased indication its shares have been under accumulation over the past 50 days.
Pulled Back After Perched Near All-Time High - Friday, January 6, 2023
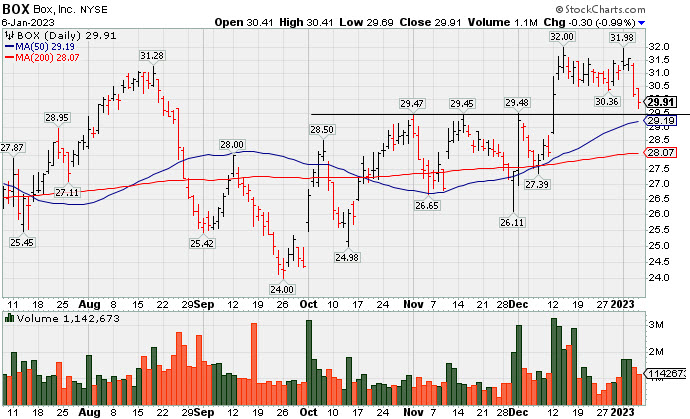
Box Inc Cl A (BOX -$0.30 or -0.99% to $29.91) pulled back for a 2nd consecutive session. It hovered in a tight range and made little headway since highlighted in yellow with pivot point cited based on its 11/01/22 high plus 10 cents in the 12/12/22 mid-day report (read here). BOX was shown in greater detail that evening with an annotated graph under the headline, "Volume Heavy Behind Breakout for Box Inc". Members were reminded - <i>"Keep in mind it still faces some additional resistance due to overhead supply up to the $33 level."</i> In the interim, broader weakness in the market (M criteria) has also raised concerns.
BOX reported Sep '22 quarterly earnings +41% on +12% sales revenues over the year ago period, above the +25% minimum earnings guideline (C criteria) for the 3rd consecutive quarterly comparison. Quarterly and annual earnings increases have been strong and steady. It has a 97 Earnings Per Share Rating.
There are 142.9 million shares outstanding. The number of top-rated funds owning its shares rose from 468 in Dec '21 to 570 in Dec '22, a reassuring sign concerning the I criteria. Its current Up/Down Volume Ratio of 1.5 is an unbiased indication its shares have been under accumulation over the past 50 days.
Volume Heavy Behind Breakout for Box Inc - Monday, December 12, 2022
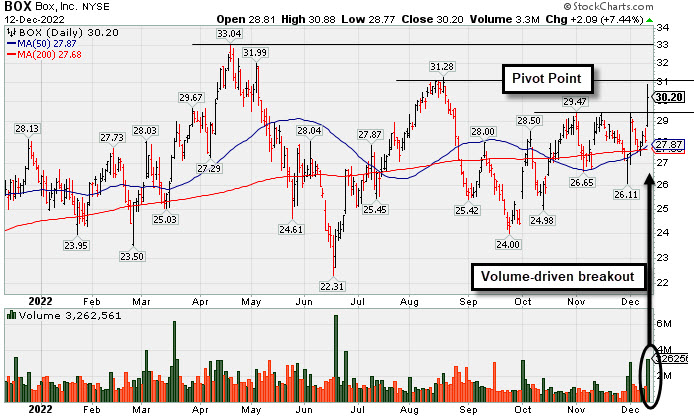
Box Inc Cl A (BOX +$2.09 or +7.44% to $30.20) was highlighted in yellow with pivot point cited based on its 11/01/22 high plus 10 cents in the earlier mid-day report (read here). It formed an orderly base and recently found support near its 50-day and 200-day moving average (DMA) lines. Today's big gain backed by +211% above average volume triggered a technical buy signal. Keep in mind it still faces some additional resistance due to overhead supply up to the $33 level.
BOX reported Sep '22 quarterly earnings +41% on +12% sales revenues over the year ago period, above the +25% minimum earnings guideline (C criteria) for the 3rd consecutive quarterly comparison. Quarterly and annual earnings increases have been strong and steady. It has a 97 Earnings Per Share Rating.
There are 142.3 million shares outstanding. The number of top-rated funds owning its shares rose from 468 in Dec '21 to 541 in Sep '22, a reassuring sign concerning the I criteria. Its current Up/Down Volume Ratio of 1.5 is an unbiased indication its shares have been under accumulation over the past 50 days.


