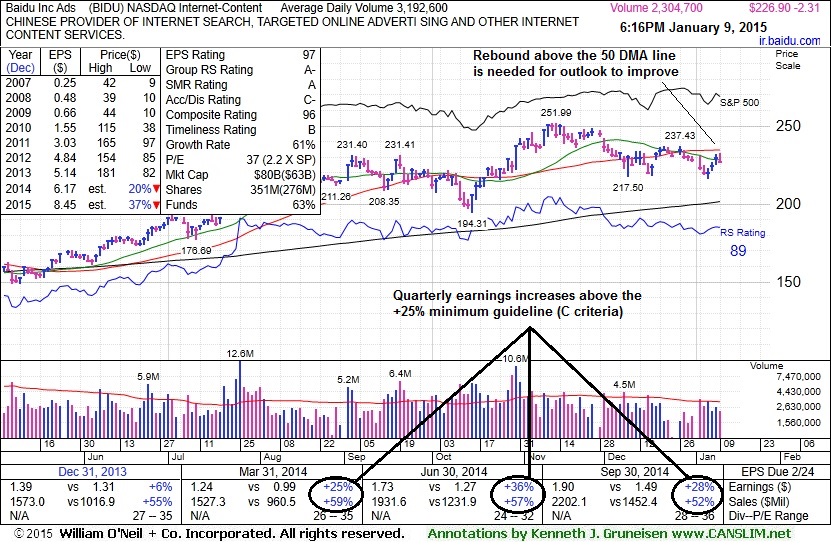
Baidu Inc. (BIDU -$2.31 or -1.01% to $226.90) rebounded this week near its 50-day moving average (DMA) line which may act as resistance. Gains above the 50 DMA line are needed for its outlook to improve. Recent lows in the $216-217 area define important near-term support where subsequent losses would raise more serious concerns. Its last appearance in this FSU section was on 12/19/14 with annotated graphs under the headline, "Rebound Above 50-Day Moving Average Helped Technical Stance", but the gains came with light volume after losses on higher volume. Soon thereafter it slumped back below that important short-term average.
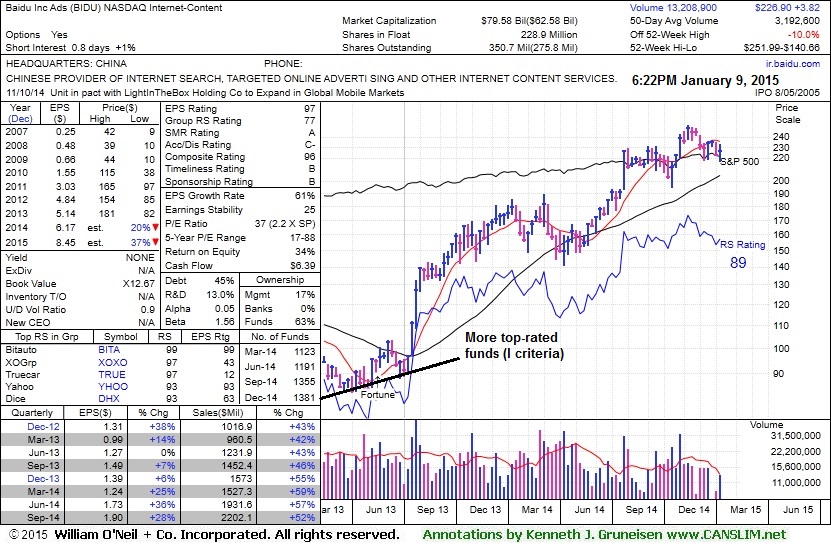
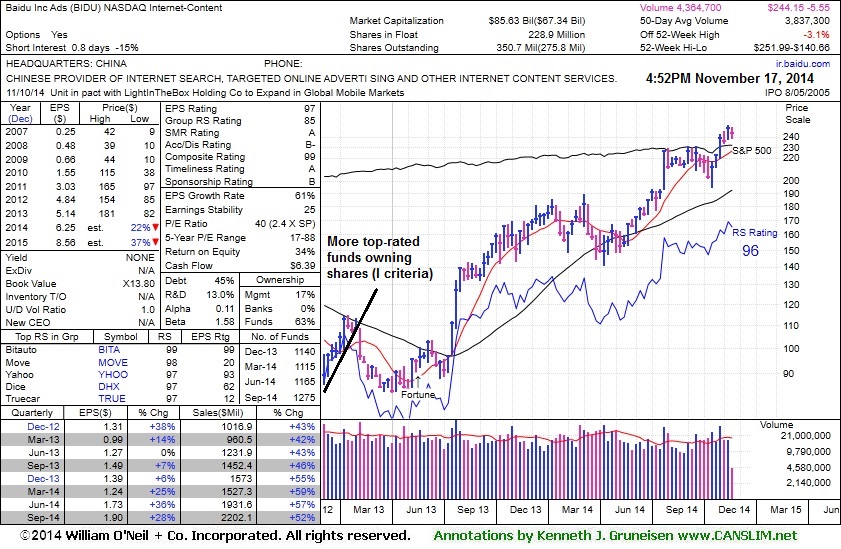
BIDU reported earnings +28% on +52% sales revenues for the Sep '14 quarter, marking its 3rd consecutive quarterly comparison with earnings above the +25% minimum guideline (C criteria). The high-ranked Internet - Content firm has a great annual earnings (A criteria) track record. Return On Equity reported at 34% helps, as that is well above the 17% minimum guideline. The number of top-rated funds owning its shares rose from 1,114 in Mar '14 to 1,381 in Dec '14, so investors have a reassuring sign concerning the I criteria.
Baidu Inc. (BIDU +$2.35 or +1.01% to $234.23) recently rebounded above its 50-day moving average (DMA) line and prior highs helping its technical stance, but gains came with light volume after losses on higher volume. Subsequent damaging losses below the recent lows would trigger more worrisome technical sell signals.
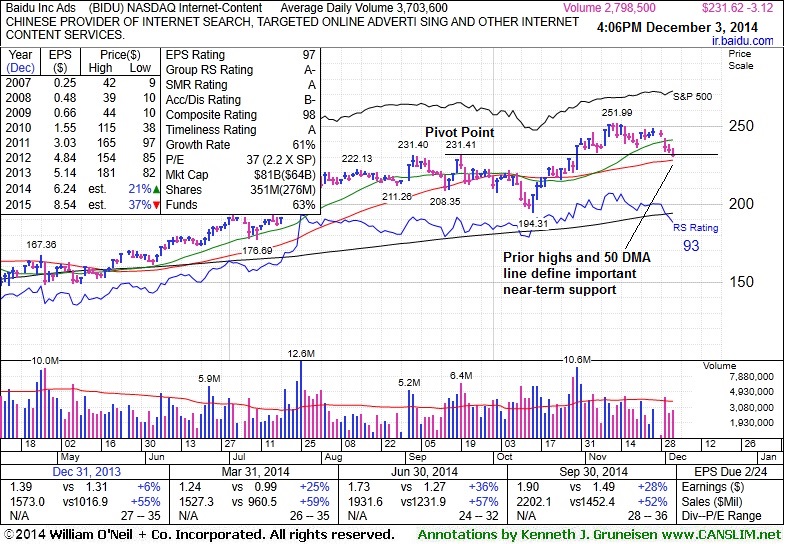
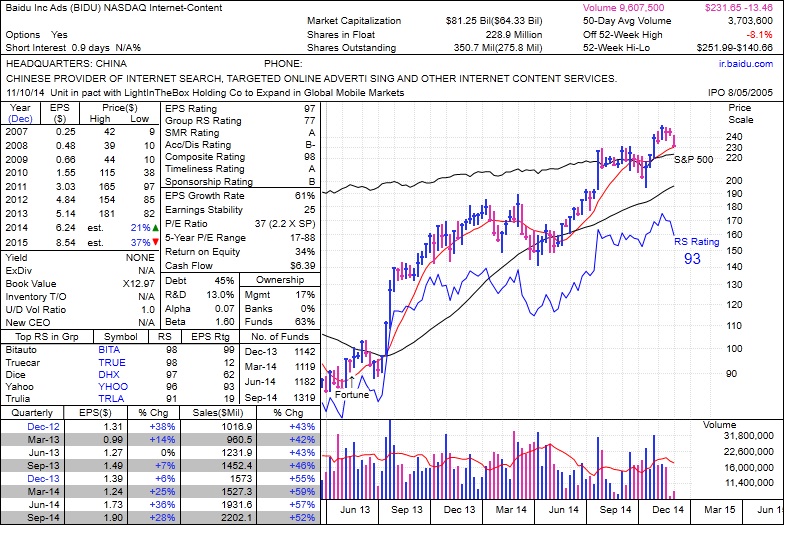
Its last appearance in this FSU section was on 12/03/14 with annotated graphs under the headline, "Consolidating Near Prior Highs and Above 50-Day Average". BIDU reported earnings +28% on +52% sales revenues for the Sep '14 quarter, marking its 3rd consecutive quarterly comparison with earnings above the +25% minimum guideline (C criteria). The high-ranked Internet - Content firm has a great annual earnings (A criteria) track record. Return On Equity reported at 34% helps, as that is well above the 17% minimum guideline. The number of top-rated funds owning its shares rose from 1,114 in Mar '14 to 1,342 in Sep '14, so investors have a reassuring sign concerning the I criteria.


Baidu Inc. (BIDU -$3.61 or -1.54% to $231.13) is consolidating just above prior highs near $230 which closely coincide with its 50-day moving average (DMA) line defining important near-term support which. Its last appearance in this FSU section was on 11/17/14 with annotated graphs under the headline, "Consolidating Back Below "Max Buy" Level".
BIDU reported earnings +28% on +52% sales revenues for the Sep '14 quarter, marking its 3rd consecutive quarterly comparison with earnings above the +25% minimum guideline (C criteria). The high-ranked Internet - Content firm has a great annual earnings (A criteria) track record. It was dropped from the Featured Stocks list on 8/06/11, and subsequently went through a long and deep consolidation below its 200 DMA line before rebounding. Return On Equity reported at 34% helps, as that is well above the 17% minimum guideline. The number of top-rated funds owning its shares rose from 1,114 in Mar '14 to 1,319 in Sep '14, so investors have a reassuring sign concerning the I criteria.
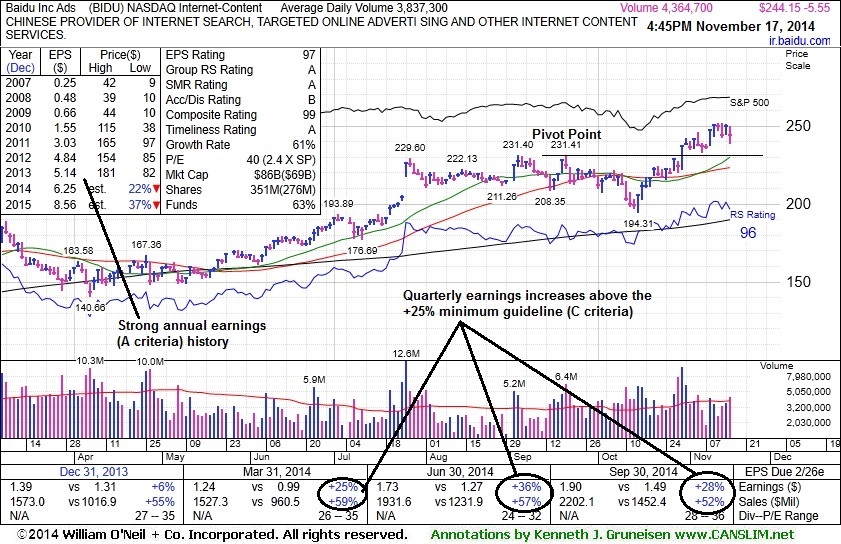
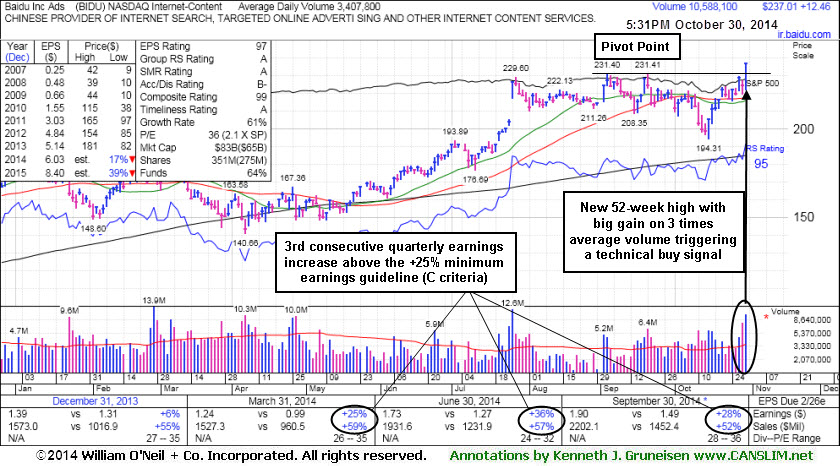
Baidu Inc. (BIDU -$5.55 or -2.22% to $244.15) is consolidating below its "max buy" level and its color code was changed to yellow. Prior highs near $230 define near-term support to watch on pullbacks. Its last appearance in this FSU section was on 10/30/14 with annotated graphs under the headline, "Technical Breakout on Triple Average Volume Following Strong Earnings", after highlighted in yellow with pivot point cited based on its 9/19/14 high plus 10 cents in the earlier mid-day report (read here). It rallied to a new 52-week high with 3 times average volume, and the strong finish clinched a convincing technical buy signal. No resistance remains due to overhead supply.
BIDU reported earnings +28% on +52% sales revenues for the Sep '14 quarter, marking its 3rd consecutive quarterly comparison with earnings above the +25% minimum guideline (C criteria). Not long ago it rebounded with volume-driven gains after a recent dip below its 50-day moving average (DMA) line toward prior highs and its 200 DMA line.
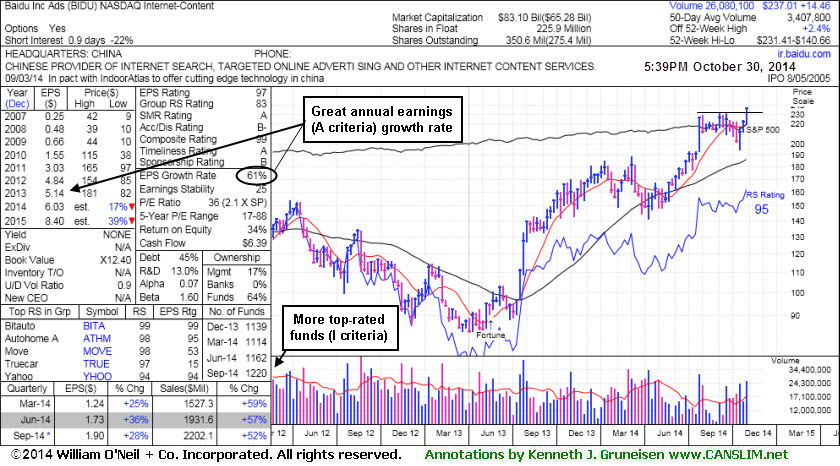
The high-ranked Internet - Content firm has a great annual earnings (A criteria) track record. It was dropped from the Featured Stocks list on 8/06/11, and subsequently went through a long and deep consolidation below its 200 DMA line before rebounding. Return On Equity reported at 34% helps, as that is well above the 17% minimum guideline. The number of top-rated funds owning its shares rose from 1,114 in Mar '14 to 1,275 in Sep '14, so investors have a reassuring sign concerning the I criteria.
It rallied to a new 52-week high with 3 times average volume, and the strong finish clinched a convincing technical buy signal. No resistance remains due to overhead supply. Not long ago it rebounded with volume-driven gains after a recent dip below its 50-day moving average (DMA) line toward prior highs and its 200 DMA line.
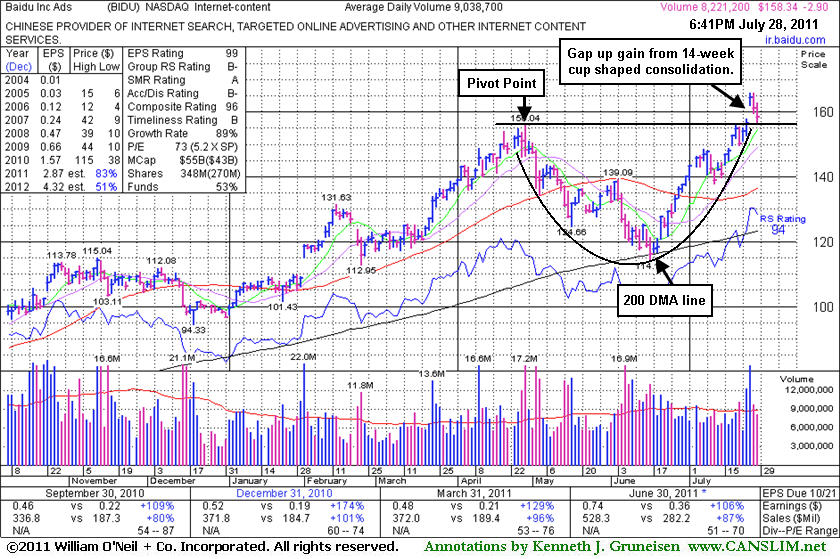
The high-ranked Internet - Content firm has a great annual earnings (A criteria) track record. It was dropped from the Featured Stocks list on 8/06/11, and subsequently went through a long and deep consolidation below its 200 DMA line before rebounding. Its last appearance in this FSU section was on 7/28/11 with annotated graphs under the headline, "Pulling Back After Gapping Up From 14-Week Cup Shaped Base". It made limited headway after featured in the 7/26/11 mid-day report (read here), then on 8/05/11 it was noted when dropped from the Featured Stocks list - and members were reminded - "The greatest concern may be the weak action in the broader market (M criteria) which trumps all other criteria, since 3 out of 4 stocks generally follow the direction of the major averages."
Return On Equity reported at 34% helps, as that is well above the 17% minimum guideline. The number of top-rated funds owning its shares rose from 1,114 in Mar '14 to to 1,220 in Sep '14, so investors have a reassuring sign concerning the I criteria.
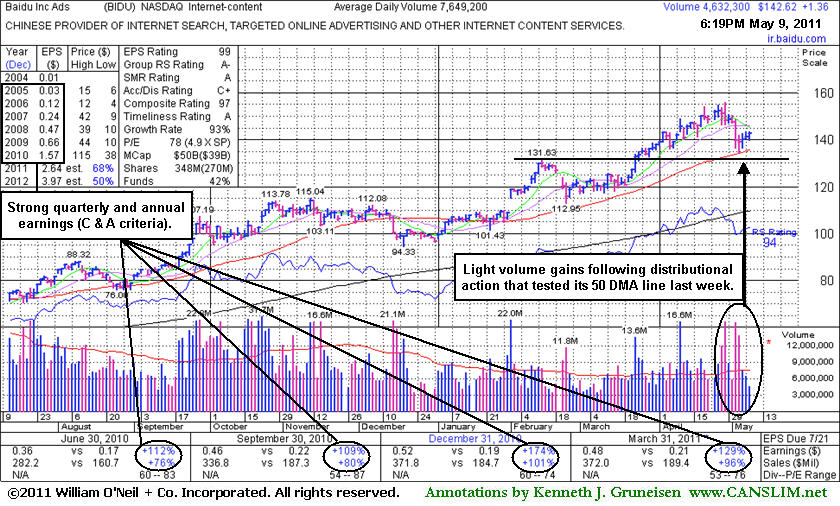
After it was last shown in this FSU section on May 9, 2011 under the headline, "Quiet Gains Following Damaging Distributional Losses", it was dropped from the Featured Stocks list on 5/13/11, then subsequently fell from $131 to $114 and tested support at its long-term 200 DMA line before rebounding impressively. It has maintained a track record of strong quarterly sales revenues and earnings increases and annual earnings (C and A criteria) history. Fundamentally, it is reassuring when its sales revenues and earnings increases have been impressive in the 4 most recent quarterly comparisons, solidly above the +25% guideline. Its latest quarter ended June 30, 2011 showed earnings +106% on +87% sales revenues versus the year ago period. Return On Equity reported at 55% also helps, as that is well above the 17% minimum guideline. The number of top-rated funds owning its shares rose from 835 in Mar '10 to to 1,116 in Jun '11, so investors have a reassuring sign concerning the I criteria.
This company has maintained very strong quarterly and annual earnings (C and A criteria) history. Fundamentally, it is reassuring when its sales revenues and earnings increases have been impressive in the 4 most recent quarterly comparisons, solidly above the +25% guideline, and its latest quarter ended March 31, 2011 showed earnings +129% on +96% sales revenues versus the year ago period. Return On Equity reported at 55% also helps, as that is well above the 17% minimum guideline. The number of top-rated funds owning its shares rose from 835 in Mar '10 to to 1,062 in Mar '11, so investors have a reassuring sign concerning the I criteria.
There are good reasons to remain optimistic when a company has maintained very strong quarterly and annual earnings (C and A criteria) history. Fundamentally, it is reassuring when its sales revenues and earnings increases have been impressive in the 4 most recent quarterly comparisons, solidly above the +25% guideline, and its latest quarter ended December 31, 2010 continued a streak of sequential comparisons showing impressive acceleration in its sales revenues growth. Return On Equity reported at 55% also helps, as that is well above the 17% minimum guideline. And when the number of top-rated funds owning its shares rose from 835 in Mar '10 to to 1,018 in Dec '10, investors have a reassuring sign concerning the I criteria.
Baidu Inc. (BIDU +$1.85 or +0.36% to $139.10) quietly rose back above its "max buy" level (+5% above its pivot point) with its gain today and its color code was changed to green again. There is no overhead supply to act as resistance, so it could then easily rise unhindered for more climactic gains. F
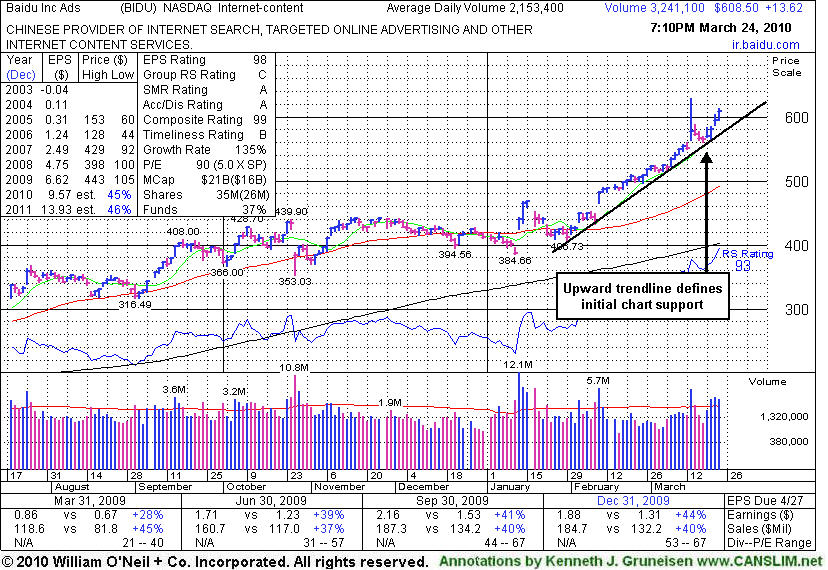
ollowing its last appearance in this FSU section on 3/09/11 with an annotated graph under the headline, "Market Behavior Likely To Sway Leader's Direction", a new pivot point was cited on 3/17/11, then its gain with 2 times average volume on 3/23/11 triggered a technical buy signal after its latest set-up. After it was shown in the February 2011 issue of CANSLIM.net News under the headline, "Breakaway Gap After Impressive Acceleration In Latest Quarter", this high-ranked China-based firm in the Internet - Content industry endured distributional pressure, yet it found support above its earlier chart highs and stayed well above its 50-day moving average (DMA) line. 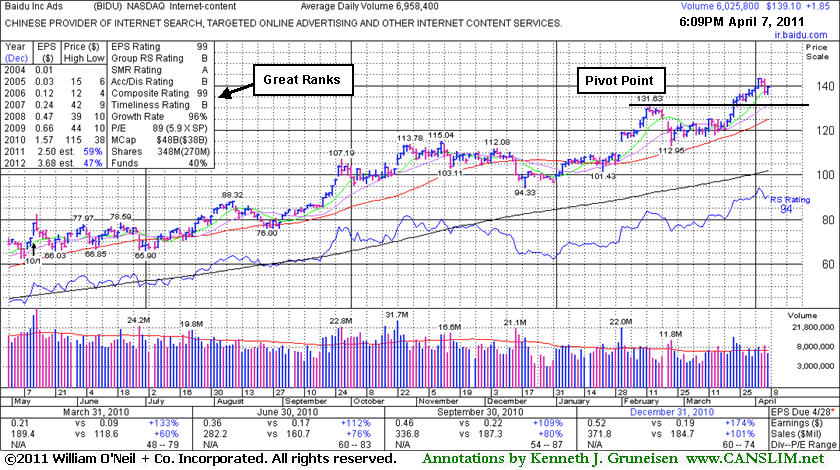
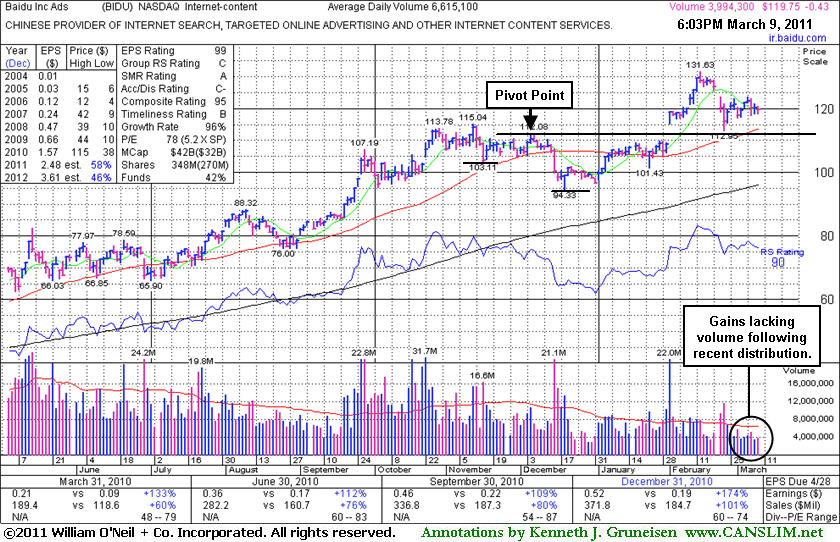
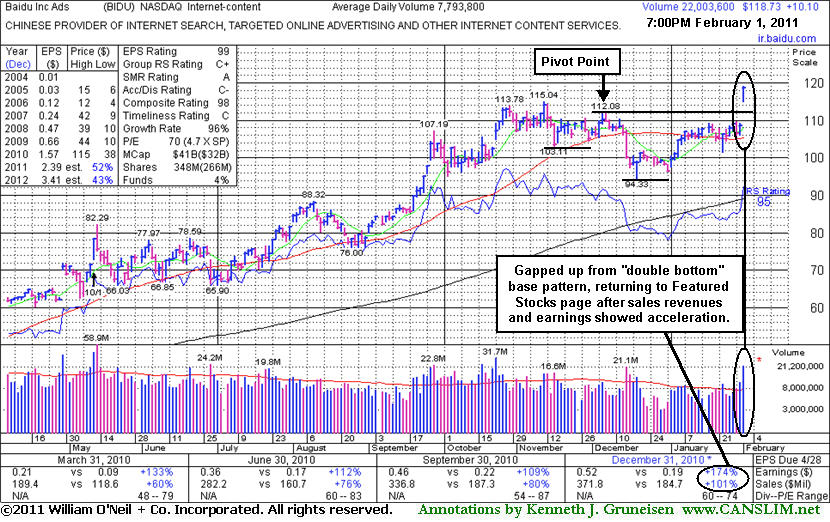
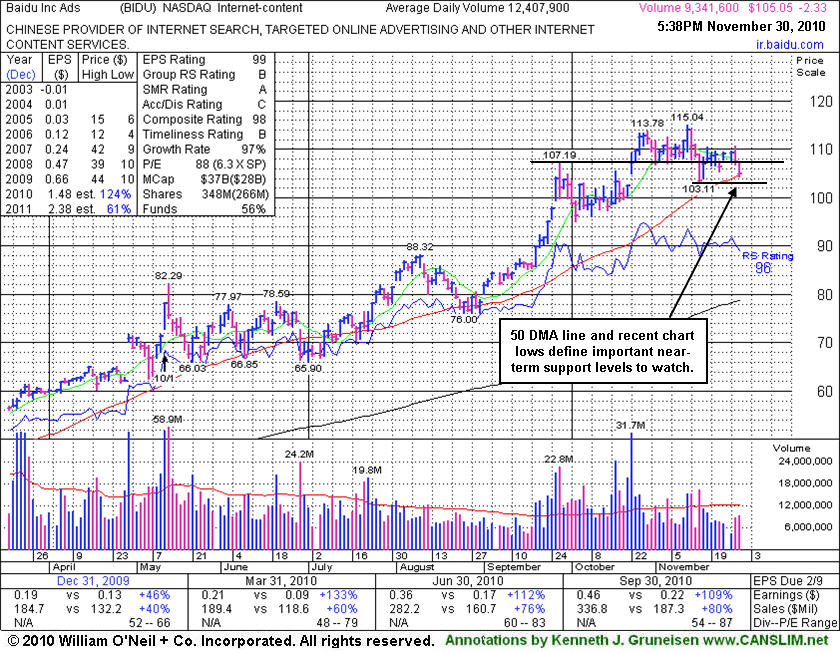
Baidu Inc. (BIDU -$0.43 or -0.36% to $119.75) has been consolidating above its 50-day moving average (DMA) line and recent chart lows defining important chart support to watch. In recent weeks, following distributional losses, its gains have been backed by below average volume. After it was shown in the February 2011 issue of CANSLIM.net News under the headline, "Breakaway Gap After Impressive Acceleration In Latest Quarter", this high-ranked China-based firm in the Internet - Content industry rallied even further into all-time high ground before stalling. It had been explained - "That gap up gain may be considered a 'breakaway gap' and its strong finish at the session high allowed it to hit and close at a new all-time high. A breakaway gap is the one noted exception where the usual limit can be stretched to allow for disciplined investors to buy as much as +10% above the pivot point ($112.08 X 1.1 = $123.29), however risk obviously increases the further one buys from a proper pivot point. There is no overhead supply to act as resistance, so it could then easily rise unhindered for more climactic gains."
BIDU has sputtered while the major averages endured distributional pressure. Since 3 out of 4 stocks tend to follow in the direction of the major averages (M criteria), the broader market's behavior in the near-term will largely dictate what the future will hold. Reasons to remain optimistic include the fact that it has maintained very strong quarterly and annual earnings (C and A criteria) history. Fundamentally, its sales revenues and earnings increases have been impressive in the 4 most recent quarterly comparisons, solidly above the +25% guideline, and its latest quarter ended December 31, 2010 continued a streak of sequential comparisons showing impressive acceleration in its sales revenues growth. Return On Equity is reported at 55%, well above the 17% minimum guideline. The number of top-rated funds owning its shares rose from 835 in Mar '10 to to 1,016 in Dec '10, a reassuring sign concerning the I criteria.
| Baidu Inc. |
CLICK HERE to see the Profile Page for this stock with current details and historic information | |
|
Ticker Symbol: BIDU (NASDAQ) |
Industry Group: Internet - Content |
Shares Outstanding: 348,000,000 |
|
Price: $118.73 2/01/2011 |
Day's Volume: 22,003,600 2/01/2011 |
Shares in Float: 212,900,000 |
|
52 Week High: $115.04 11/11/2010 |
50-Day Average Volume: 7,793,800 |
Up/Down Volume Ratio: 1.2 |
|
Pivot Point: $112.08 12/07/2010 high |
Pivot Point +5% = Max Buy Price: $117.68 |
Web Address: http://ir.baidu.com/ |
CANSLIM.net Profile: Baidu Inc. is a high-ranked China-based firm in the Internet - Content industry. It has maintained a very strong and steady annual earnings (A criteria) history. Fundamentally, its sales revenues and earnings increases have been impressive in the 4 most recent quarterly comparisons, solidly above the +25% guideline (C criteria), and its latest quarter ended December 31, 2010 continued a streak of sequential comparisons showing impressive acceleration in its sales revenues growth. Return On Equity is reported at 55%, well above the 17% minimum guideline. The number of top-rated funds owning its shares rose from 837 in Mar '10 to to 975 in Dec '10, a reassuring sign concerning the I criteria.
What to Look For and What to Look Out For: Its gain confirmed a proper technical buy signal but it quickly got extended more than +5% above its pivot point. That gives investors a good reason to watch for subsequent light volume pullbacks as an opportunity to accumulate shares without chasing it too far above prior highs. A cooperative backdrop in the major averages (M criteria) in the near-term may continue to work in its favor, but any change in the market environment should be expected to impact 3 out of 4 stocks. Disciplined investors always limit losses if ever any stock falls more than -7% from their purchase price.
Technical Analysis: BIDU's gap up gain on 2/01/11 prompted its appearance in yellow in the mid-day report (read here). That gap up gain may be considered a "breakaway gap" and its strong finish at the session high allowed it to hit and close at a new all-time high. A breakaway gap is the one noted exception where the usual limit can be stretched to allow for disciplined investors to buy as much as +10% above the pivot point ($112.08 X 1.1 = $123.29), however risk obviously increases the further one buys from a proper pivot point. There is no overhead supply to act as resistance, so it could then easily rise unhindered for more climactic gains. However, its supply of shares was drastically increased by a 10:1 stock split on 5/12/10, and usually the market's biggest winners had only 30 million shares (S criteria) outstanding or less. It had last appeared in the Featured Stock Update on 11/30/10 under the headline "Late Stage Leader Now Testing 50-Day Average Support" but when damage continued to mount it was noted and dropped from the Featured Stocks list on 12/27/10. In recent weeks it had rebounded above its 50-day moving average line, helping its outlook improve again.
Keep in mind that BIDU has traded up more than 10-fold, and it has not been a smooth ride since it first featured on Monday, October 30, 2006 in the CANSLIM.net Mid Day Breakouts Report (read here). After making great progress it went through a multi-month consolidation under its 50 and 20 DMA lines, then later returned as a noteworthy leader featured in CANSLIM.net reports. An annotated graph showed a vivid picture at the beginning of the stock's period of greatest weakness back on January 11, 2008 under the headline, "Weakness Hurting Chances For Featured Favorite" (read here). Take a look back at that now! Remember that a dropped stock can be featured again in a future CANSLIM.net report if it repairs its technical damage and forms a new pivot point.
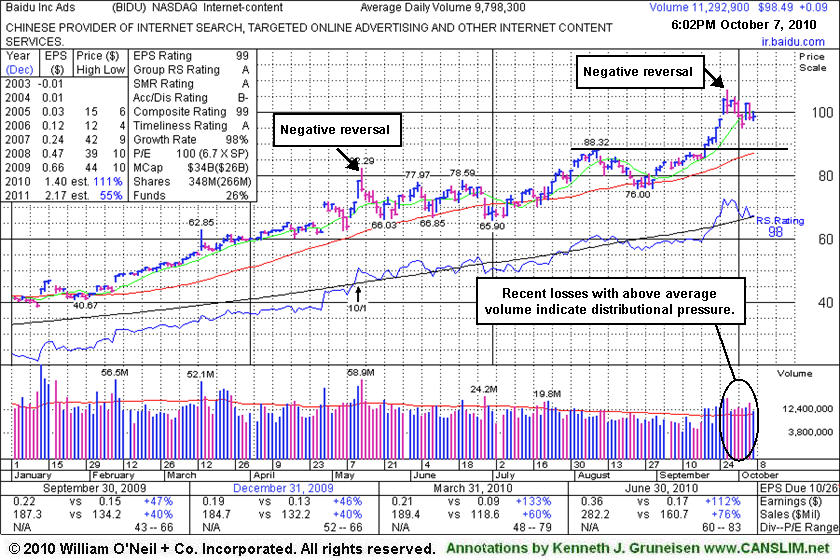
Baidu.com, Inc. (BIDU +$0.09 or +0.09% to $98.49) is consolidating well above prior highs that define technical support along with its 50-day moving average (DMA) line. While it could go on to produce more climactic gains, its negative reversal for a loss with heavy volume on 9/28/10 and the recent streak of losses with above average volume may be signs it is due for a longer and deeper consolidation. It consolidated for two and a half months following its negative reversal on 5/13/10 after a 10:1 split of its shares.
BIDU has a stellar sales and earnings history that satisfies the C & A criteria, and the recently reported quarter ended June 30, 2010 showed sales revenues still accelerating impressively. The number of top-rated funds owning shares rose from 164 in Sep '09, and 211 in Jun '10, a positive trend with respect to institutional ownership (I criteria).
Keep in mind that BIDU has traded up more than 10-fold, and it has not been a smooth ride since it first featured on Monday, October 30, 2006 in the CANSLIM.net Mid Day Breakouts Report (read here). After making great progress it went through a multi-month consolidation under its 50 and 20 DMA lines, then later returned as a noteworthy leader featured in CANSLIM.net reports. An annotated graph showed a vivid picture at the beginning of the stock's period of greatest weakness back on January 11, 2008 under the headline, "Weakness Hurting Chances For Featured Favorite" (read here). Take a look back at that now! Remember that a dropped stock can be featured again in a future CANSLIM.net report if it repairs its technical damage and forms a new pivot point.
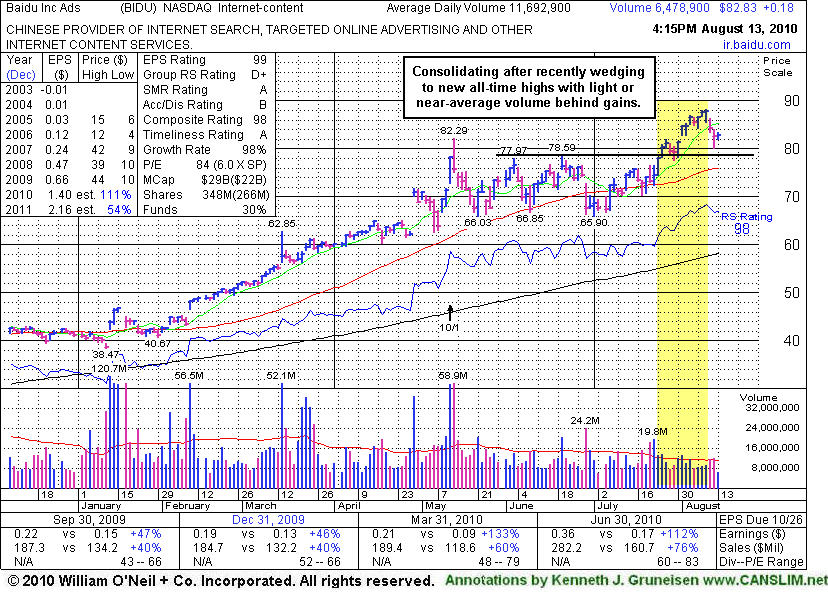
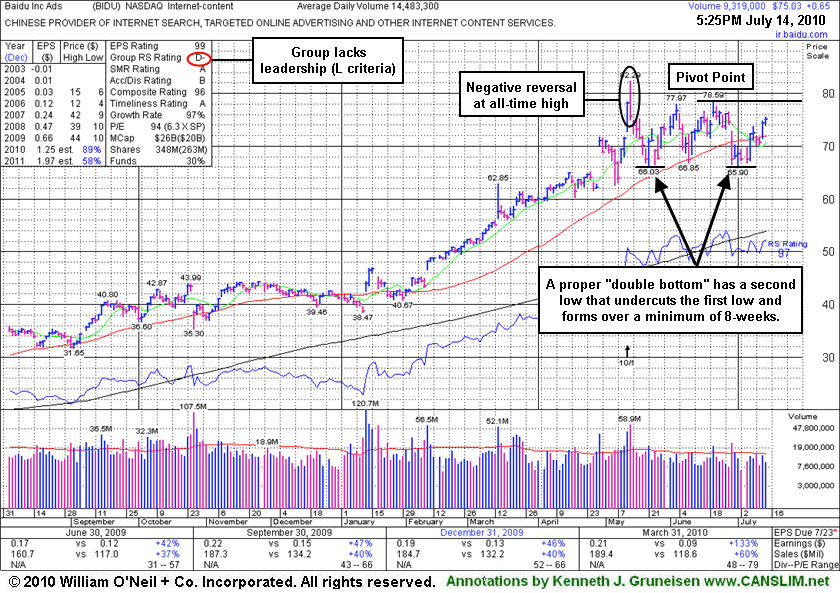
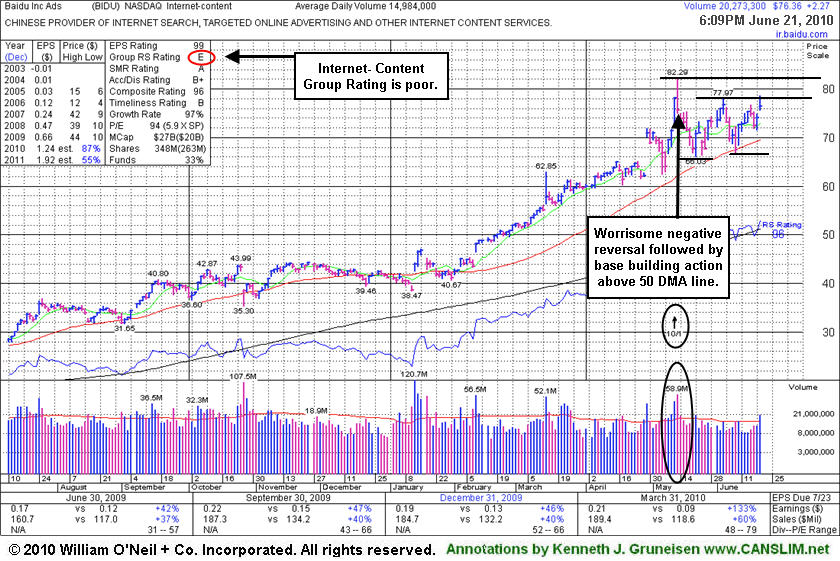
Baidu.com, Inc. (BIDU +$0.18 or +0.22% to $82.83) is consolidating above prior highs that define technical support along with its 50-day moving average (DMA) line. Since its last FSU section appearance on 7/14/10 under the headline "Longer Base Pattern Has Bullish Potential" its gains above resistance in the $78 area were an encouraging sign but they lacked great volume conviction. Now its prior highs define important chart support.
BIDU has a stellar sales and earnings history that satisfies the C & A criteria, and the recently reported quarter ended June 30, 2010 showed sales revenues still accelerating impressively. The number of top-rated funds owning shares is being reported at 202 in Mar '10, and 207 in Jun '10, a slightly positive trend with respect to institutional ownership (I criteria). However, the lack of leadership (L criteria) in the group is of some concern, with the Internet - Content group RS rating a 26 now, very low on the 1-99 scale.
Keep in mind that BIDU has traded up more than 8-fold, and it has not been a smooth ride since it first featured on Monday, October 30, 2006 in the CANSLIM.net Mid Day Breakouts Report (read here). After making great progress it went through a multi-month consolidation under its 50 and 20 DMA lines, then later returned as a noteworthy leader featured in CANSLIM.net reports. An annotated graph showed a vivid picture at the beginning of the stock's period of greatest weakness back on January 11, 2008 under the headline, "Weakness Hurting Chances For Featured Favorite" (read here). Take a look back at that now! Remember that a dropped stock can be featured again in a future CANSLIM.net report if it repairs its technical damage and forms a new pivot point.
The current market (M criteria) conditions have improved since the July 7th follow-through-day confirmed a new rally. That is a green light for investors, but not a reason to select stocks with flaws in their bases. Investors usually have the best odds when they remain disciplined and trade based upon the long-standing guidelines of the fact-based investment system. A proper breakout requires a sound base pattern followed by gains above the stock's pivot point backed by at least +50% above average volume.
High-ranked Internet - Content firm Baidu.com, Inc. (BIDU +$0.65 or +0.87% to $75.03) edged higher today with a tiny gain on below average volume. Its color code is changed to yellow with new pivot point based on its 6/21/10 high ($78.59) as it is working on a 10-week double bottom type pattern. Gains for a new high close above recent resistance in the $78 area would be an encouraging sign, meanwhile recent lows in the $66 area define important chart support.
When it last appeared in this FSU section on 6/21/10 under the headline "Usually Not Ideal Choices When Base Pattern Has Flaws" with an annotated graph it had finished the session below its 6/03/10 high (and closing price) while we explained - "In the paper it was recently labeled an 'irregular double bottom' pattern with a pivot point based upon that day's high plus ten cents. Others might chose to call it a choppy 6-week base with a higher pivot point based upon its all-time high, or they might simply wait for a better base pattern to eventually form." Since that time a damaging gap down on 6/29/10 sent it under its 50-day moving average (DMA) line, yet it has subsequently rebounded back above that important short-term average with gains on light or near average volume. It has formed a better base of sufficient length and briefly undercut an earlier low, giving its base the right characteristics for an ideal set-up. Time will tell if a burst of buying demand might meet the guidelines to trigger a solid buy signal, meanwhile more patience is required.
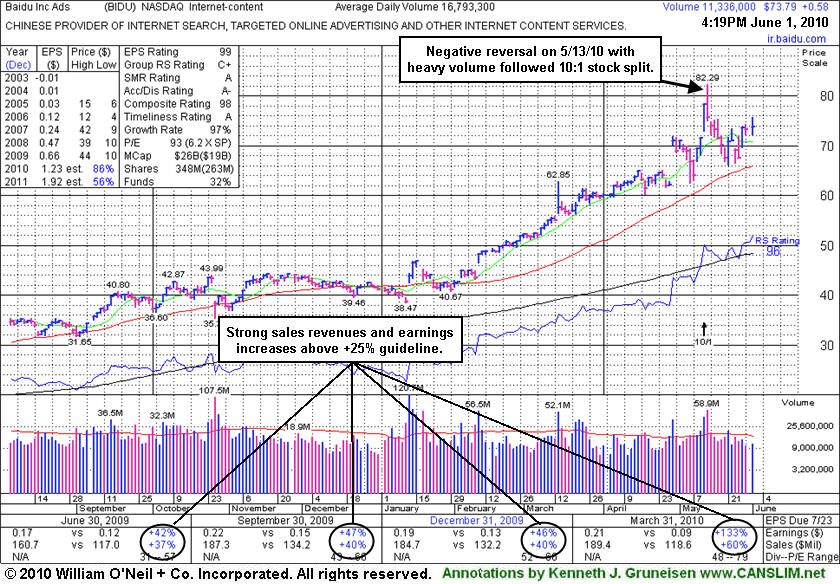
BIDU has a stellar sales and earnings history that satisfies the C & A criteria, in fact, the quarter ended March 31, 2010 showed sales revenues and earnings growth accelerating impressively. The number of top-rated funds owning shares is being reported at 203 in Dec '09, and 201 in Jun '10, not a strong trend with respect to institutional ownership (I criteria). Another concern that makes it a less favorable candidate under the system guidelines is the lack of leadership (L criteria) in the group, with the Internet - Content group RS rating a 9 now, very low on the 1-99 scale.
Volume totals cooled behind recent distribution days since its worrisome negative reversal from its all-time high on 5/13/10. Its share price was impacted by a 10:1 stock split as of 5/12/10, and the split reduced the share price while it greatly increased the supply of shares (S criteria) outstanding. The best market winners typically has smaller supplies closer to its pre-split levels.
Keep in mind that BIDU has traded up more than 8-fold, and it has not been a smooth ride since it first featured on Monday, October 30, 2006 in the CANSLIM.net Mid Day Breakouts Report (read here). After making great progress it went through a multi-month consolidation under its 50 and 20 DMA lines, then later returned as a noteworthy leader featured in CANSLIM.net reports. An annotated graph showed a vivid picture at the beginning of the stock's period of greatest weakness back on January 11, 2008 under the headline, "Weakness Hurting Chances For Featured Favorite" (read here). Take a look back at that now! Remember that a dropped stock can be featured again in a future CANSLIM.net report if it repairs its technical damage and forms a new pivot point.
The current market (M criteria) conditions have improved since a follow-through-day recently confirmed a new rally. That is not a reason to select stocks with flaws in their bases, and it is not a guarantee that perfect-looking leaders will go on to rally substantially either. Investors usually have the best odds when they remain disciplined and trade based upon the long-standing guidelines of the fact-based investment system.
High-ranked Internet - Content firm Baidu.com, Inc. (
BIDU +$2.27 or +3.05% to $76.36) gapped up today and posted a gain with above average volume, but it closed in the lower third of its intra-day range, finishing the session below its 6/03/10 high (and closing price). In the paper it was recently labeled an "irregular double bottom" pattern with a pivot point based upon that day's high plus ten cents. Others might chose to call it a choppy 6-week base with a higher pivot point based upon its all-time high, or they might simply wait for a better base pattern to eventually form.BIDU has a stellar sales and earnings history that satisfies the C & A criteria, in fact, the quarter ended March 31, 2010 showed sales revenues and earnings growth accelerating impressively. However, it saw a slight decline in the number of top-rated funds owning shares from being reported at 204 in Dec '09 to 201 in Mar '10. Another concern that makes it a less favorable candidate under the system guidelines is the lack of leadership (L criteria) in the group, with the Internet - Content group currently ranked very low. Yet, a reassuring characteristic to its consolidation is that it has found support at its 50-day moving average (DMA) line. Volume totals have also cooled behind recent distribution days since its worrisome negative reversal from its all-time high on 5/13/10. Its share price was impacted by a 10:1 stock split as of 5/12/10, and the split reduced the share price while it greatly increased the supply of shares (S criteria) outstanding. The best market winners typically has smaller supplies closer to its pre-split levels.
Keep in mind that BIDU has traded up more than 8-fold, and it has not been a smooth ride since it first featured on Monday, October 30, 2006 in the CANSLIM.net Mid Day Breakouts Report (read here). After making great progress it went through a multi-month consolidation under its 50 and 20 DMA lines, then later returned as a noteworthy leader featured in CANSLIM.net reports. An annotated graph showed a vivid picture at the beginning of the stock's period of greatest weakness back on January 11, 2008 under the headline, "Weakness Hurting Chances For Featured Favorite" (read here). Take a look back at that now! Remember that a dropped stock can be featured again in a future CANSLIM.net report if it repairs its technical damage and forms a new pivot point.
Baidu.com, Inc. (BIDU +$0.35 or +0.48% to $73.56) posted a small gain on light volume today, and volume was also below average behind its 5/27/10 gap up gain. It is extended from any sound base, consolidating above its 50-day moving average (DMA) line and recent chart lows in the $66 area that define near-term support to watch. More time is needed to see if a proper new base may form and offer investors another ideal entry point.
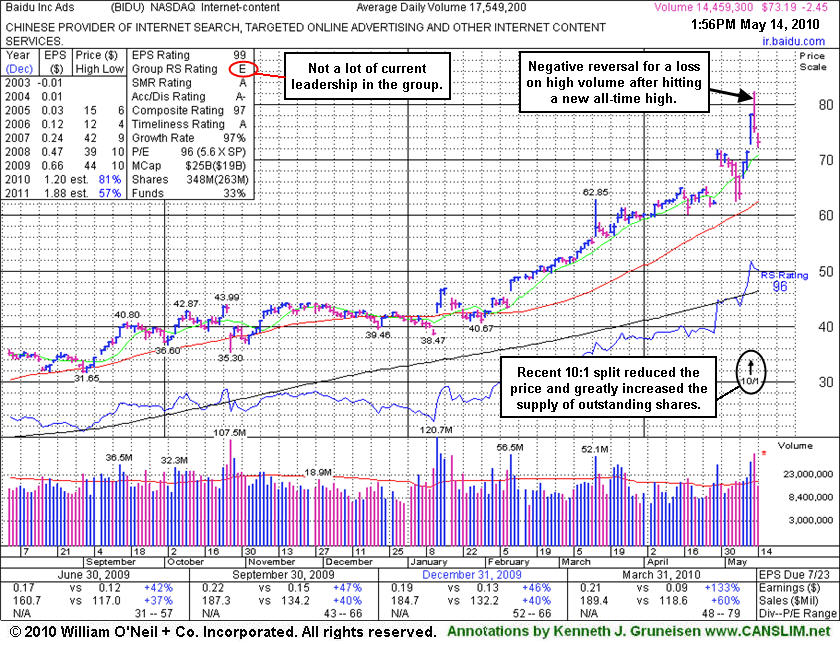
A worrisome negative reversal from its all-time high on 5/13/10 followed a 10:1 stock split. The recent split reduced the share price and greatly increased the supply of shares outstanding. The high-ranked Internet- Content firm saw a slight decline in the number of top-rated funds owning shares from 204 in Dec '09 to 196 in Mar '10. It still has a stellar sales and earnings history that satisfies the C & A criteria, in fact, the quarter ended March 31, 2010 showed sales revenues and earnings growth accelerating impressively. The current market (M criteria) conditions have been calling for investors to lock in gains and raise cash. Until a follow-through-day from one of the major indices confirms a new rally great caution is advised, as the current market correction could last longer and cause more technical damage.
BIDU has traded up more than 8-fold, but it has not been a smooth ride since it first featured on Monday, October 30, 2006 in the CANSLIM.net Mid Day Breakouts Report (read here). After making great progress it went through a multi-month consolidation under its 50 and 20 DMA lines, then later returned as a noteworthy leader featured in CANSLIM.net reports. An annotated graph showed a vivid picture at the beginning of the stock's period of greatest weakness back on January 11, 2008 under the headline, "Weakness Hurting Chances For Featured Favorite" (read here). Take a look back at that now! Remember that a dropped stock can be featured again in a future CANSLIM.net report if it repairs its technical damage and forms a new pivot point.
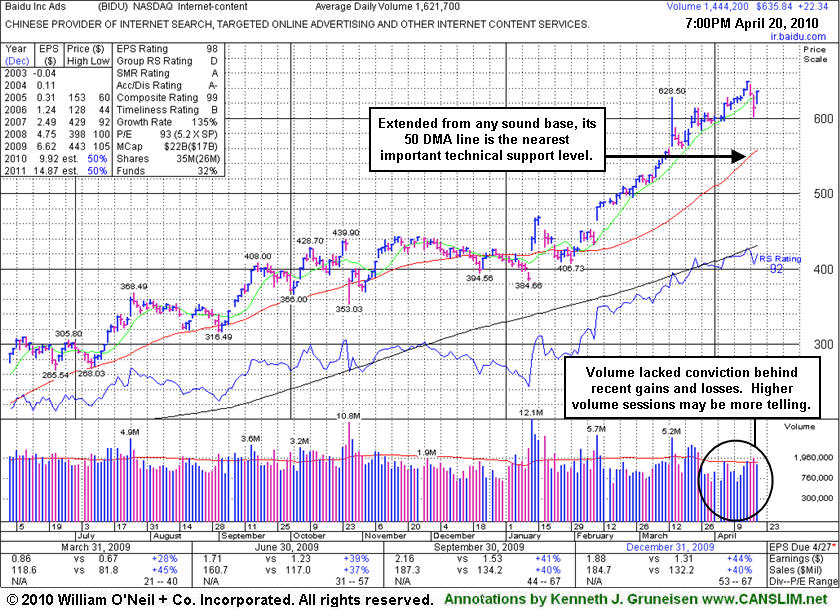
Baidu.com, Inc. (BIDU -$1.66 or -2.19% to $73.98) gapped down today after a worrisome negative reversal from its all-time high on the prior session. It is extended from any sound base following a big gap up gain on 5/12/10 as a 10:1 stock split occurred. Last week's loss broke a 13-week winning streak. Its last FSU section appearance on 4/20/10 under the headline "Higher Volume Totals Would Be More Telling" recognized that it was - "Repeatedly noted as extended from any sound base after 10 consecutive weekly gains, however it could produce more climactic gains, especially due to the small supply (S criteria) of shares outstanding.
The recent split reduced the share price and greatly increased the supply of shares outstanding. The high-ranked Internet- Content firm saw a slight decline in the number of top-rated funds owning shares from 204 in Dec '09 to 198 in Mar '10. It still has a stellar sales and earnings history that satisfies the C & A criteria, in fact, the quarter ended March 31, 2010 showed sales revenues and earnings growth accelerating impressively. The current market (M criteria) conditions have been calling for investors to lock in gains and raise cash. Until a follow-through-day from one of the major indices confirms a new rally great caution is advised, as the current market correction could last longer and cause more technical damage.
BIDU has traded up more than 8-fold, but it has not been a smooth ride since it first featured on Monday, October 30, 2006 in the CANSLIM.net Mid Day Breakouts Report (read here). After making great progress it went through a multi-month consolidation under its 50 and 20 DMA lines, then later returned as a noteworthy leader featured in CANSLIM.net reports. An annotated graph showed a vivid picture at the beginning of the stock's period of greatest weakness back on January 11, 2008 under the headline, "Weakness Hurting Chances For Featured Favorite" (read here). Take a look back at that now! Remember that a dropped stock can be featured again in a future CANSLIM.net report if it repairs its technical damage and forms a new pivot point.
Baidu.com, Inc. (BIDU +$22.34 or +3.64% to $635.84) posted a gain today, fully repairing the prior session's considerable loss. It has been repeatedly noted as extended from any sound base after 10 consecutive weekly gains, however it could produce more climactic gains, especially due to the small supply (S criteria) of shares outstanding. No overhead supply exists to hinder its progress, but it is too extended from any sound base to be bought within the guidelines now. It has risen remarkably from $357 when appearing in this FSU section on 9/08/09 under the headline Baidu Near Multi-Year Highs, But Decelerating Growth Is A Concern.
The high-ranked Internet- Content firm saw a slight decline in the number of top-rated funds owning shares from 204 in Dec '09 to 196 in Mar '10. It still has a stellar sales and earnings history that satisfies the C & A criteria. However it has not formed any recent sound base and is extended from an earlier "double bottom" base pattern that was identified based upon its December low and January's lower low. Technically it triggered a technical buy signal and was featured in yellow on 1/13/10 as it cleared the 12/29/09 high mentioned in the 1/12/10 note. (See the "view all notes" links to review prior analysis on any stock.)
Compelling proof that institutional investors are accumulating the high-ranked Internet- Content firm's shares is that the number of top-rated funds owning BIDU's shares rose from 103 in Dec '08 to 207 in Dec '09. That is solid evidence its shares were being accumulated by the institutional (I criteria) crowd. It has a stellar sales and earnings history that satisfies the C & A criteria. However it has not formed any recent sound base and is extended from an earlier "double bottom" base pattern that was identified based upon its December low and January's lower low. Technically it triggered a technical buy signal and was featured in yellow on 1/13/10 as it cleared the 12/29/09 high mentioned in the 1/12/10 note. (See the "view all notes" links to review prior analysis on any stock.)
Compelling proof that institutional investors are accumulating the high-ranked Internet- Content firm's shares is that the number of top-rated funds owning BIDU's shares rose from 103 in Dec '08 to 206 in Dec '09. That is solid evidence its shares were being accumulated by the institutional (I criteria) crowd. It has a stellar sales and earnings history that satisfies the C & A criteria. However it has not formed any recent sound base and is extended from an earlier "double bottom" base pattern that was identified based upon its December low and January's lower low. Technically it triggered a technical buy signal and was featured in yellow on 1/13/10 as it cleared the 12/29/09 high mentioned in the 1/12/10 note. (See the "view all notes" links to review prior analysis on any stock.)
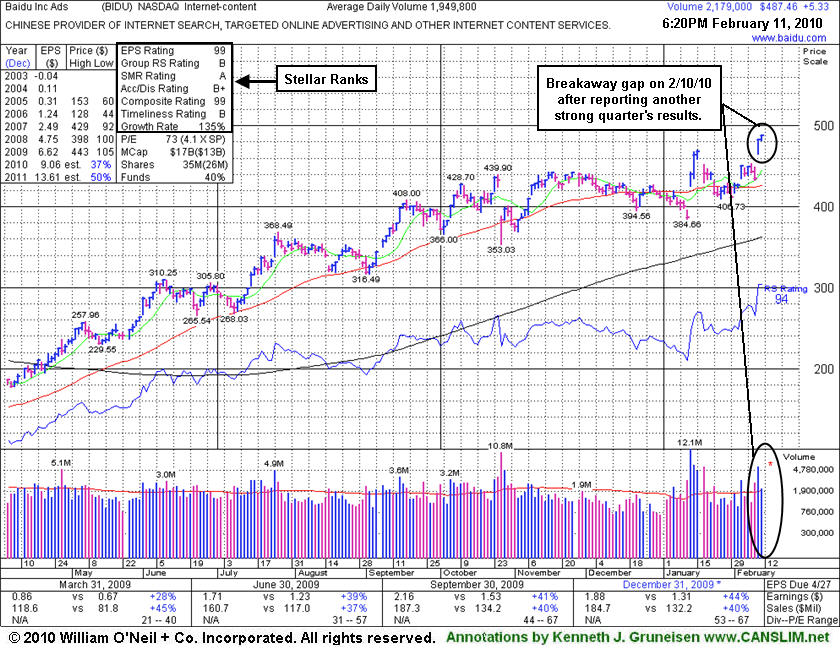
Baidu.com, Inc. (BIDU +$5.33 or +1.11% to $487.46) posted a gain today on average volume, rallying into new high ground. After reporting earnings and raising guidance it gapped up on 2/10/10 for a considerable gain and new all-time high, closing strong with volume more than 3 times average. Market conditions (M criteria of the investment system) argue against new buying efforts until a follow-through-day confirms the latest rally attempt, otherwise odds are not favorable for investors. No overhead supply exists to hinder its progress. Disciplined investors always follow all key criteria of the investment system to stack the odds of success in your favor. In a bullish market environment, many ideal buy candidates come along. Right now, disciplined investors are waiting for a new confirmed rally before initiating any new buying efforts. Meanwhile, the M criteria presents a problem, since 3 out of 4 stocks typically follow the direction of the major averages.
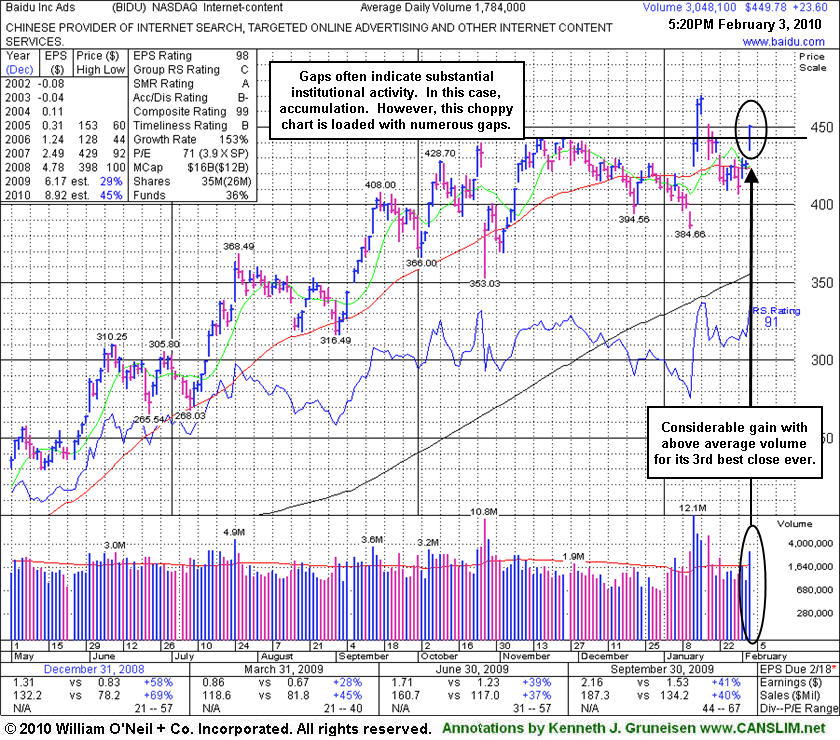
Within its last appearance in this FSU section on 2/03/10 under the headline "3rd Best Close Ever For Baidu.com" it was observed, "Gaps often indicate substantial institutional activity. Today's considerable gap up and close near the session high was a sign of great institutional accumulation. However, this company's chart is loaded with numerous gaps in in either direction in recent months." There was also a reminder included that the company was due to report earnings after the close on February 9th. Its 2/10/10 breakaway gap into new all-time high territory provided more compelling proof that institutional investors are accumulating the high-ranked Internet- Content firm's shares. It is very reassuring that the number of top-rated funds owning BIDU's shares rose from 103 in Dec '08 to 204 in Dec '09, solid evidence its shares were being accumulated by the institutional (I criteria) crowd.
It has a stellar sales and earnings history that satisfies the C & A criteria. However it has not formed any recent sound base and is extended from an earlier "double bottom" base pattern that was identified based upon its December low and January's lower low. Technically it triggered a technical buy signal and was featured in yellow on 1/13/10 as it cleared the 12/29/09 high mentioned in the 1/12/10 note. (See the "view all notes" links to review prior analysis on any stock.)
Baidu.com, Inc. (BIDU +$23.60 or +5.54% to $449.78) rose to its 3rd highest close ever today as a considerable gain backed by nearly 2 times average volume lifted it further above its 50-day moving average (DMA) line. Its slump below that important short-term average had raised concerns since getting extended from more than +5% above its pivot point from the latest "double bottom" base pattern. It had triggered a technical buy signal and was featured in yellow on 1/13/10 as it cleared the 12/29/09 high mentioned in the prior evening's note (view all notes).
Gaps often indicate substantial institutional activity. Today's considerable gap up and close near the session high was a sign of great institutional accumulation. However, this company's chart is loaded with numerous gaps in in either direction in recent months.
The company is due to report earnings after the close on February 9th. It has a stellar sales and earnings history that satisfies the C & A criteria. It is reassuring that the number of top-rated funds owning BIDU's shares rose from 103 in Dec '08 to 193 in Dec '09, solid evidence its shares were being accumulated by the institutional (I criteria) crowd.
Always follow all key criteria of the investment system to stack the odds of success in your favor. In a bullish market environment, many ideal buy candidates come along. Right now, disciplined investors are waiting for a new confirmed rally before initiating any new buying efforts. Meanwhile, the M criteria presents a problem, since 3 out of 4 stocks typically follow the direction of the major averages.
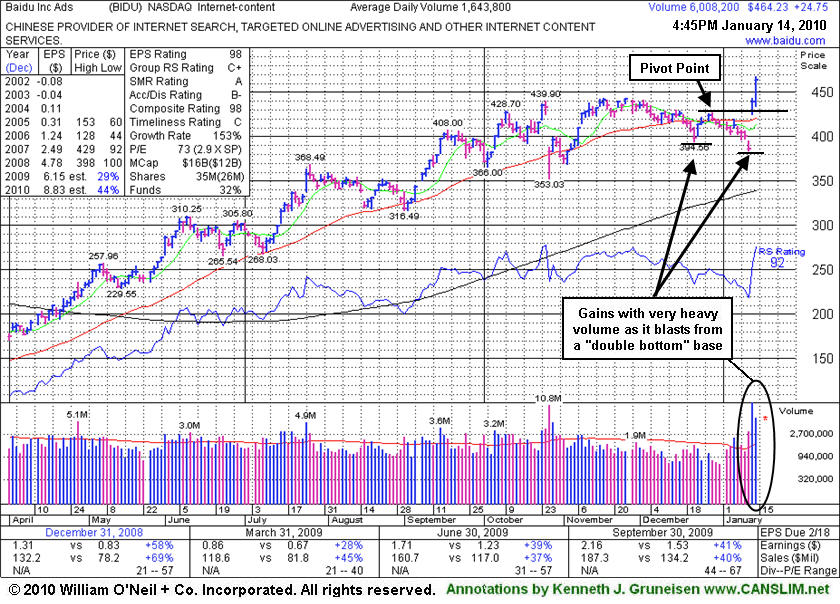
Baidu.com, Inc. (BIDU +$24.75 or +5.63% to $464.23) rose to a fresh all-time high today as a considerable gain backed by nearly 4 times average volume lifted it above its "max buy" level. Its color code was changed to green as it quickly got extended from more than +5% above its pivot point from the latest "double bottom" base pattern. It triggered a technical buy signal and was featured in yellow on 1/13/10 as it cleared the 12/29/09 high mentioned in the prior evening's note (view all notes). The stock had recently encountered resistance at its 50-day moving average (DMA) line and recently undercut its prior chart low, another ominous sign. It was repeatedly stated in prior analysis that, "Gains back above its 50 DMA line are needed for its outlook to improve." It was a sign of great institutional accumulation when it blasted higher. Regardless of the latest headlines, the company has a stellar sales and earnings history that satisfies the C & A criteria. It is reassuring that the number of top-rated funds owning BIDU's shares rose from 103 in Dec '08 to 177 in Sep '09, solid evidence its shares were being accumulated by the institutional (I criteria) crowd.
Always stay disciplined and avoid chasing stocks that are too extended from an ideal buy point to stack the odds of success in your favor. In a bullish market environment, many ideal buy candidates come along.
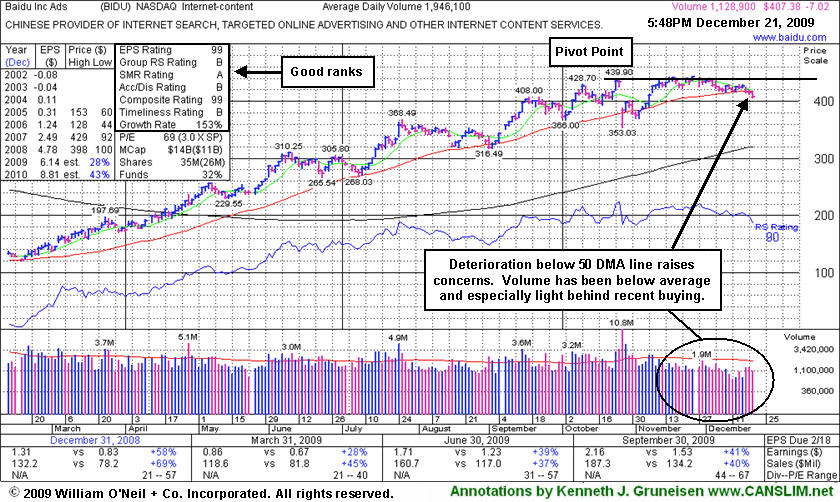
Baidu.com, Inc. (BIDU -$7.87 or -1.91% to $404.63) fell today on lighter than average volume. The prior session's gain was marked by higher volume than any up session since 11/09/09, but it ended near the session low after encountering resistance at its 50-day moving average (DMA) line. Gains back above its 50 DMA line are needed for its outlook to improve. Since quietly rallying to new highs in November it has stalled. The longer it struggles below its 50 DMA line, the worse its outlook becomes. This Chinese provider of Internet search and content services could continue basing for a longer period. Patience is important, because without convincing gains leading to a fresh breakout there is little assurance it is capable of sustaining a meaningful rally higher.
Technically, it has built a sloppy base over the past 11 weeks, and gains above its previously cited pivot point with at least +50% above average volume could trigger a new buy signal. BIDU proved resilient near its 50 DMA line after its 10/27/09 gap down, which was a sign of great institutional support. It is reassuring that the number of top-rated funds owning BIDU's shares rose from 103 in Dec '08 to 171 in Sep '09, solid evidence its shares were being accumulated by the institutional (I criteria) crowd.
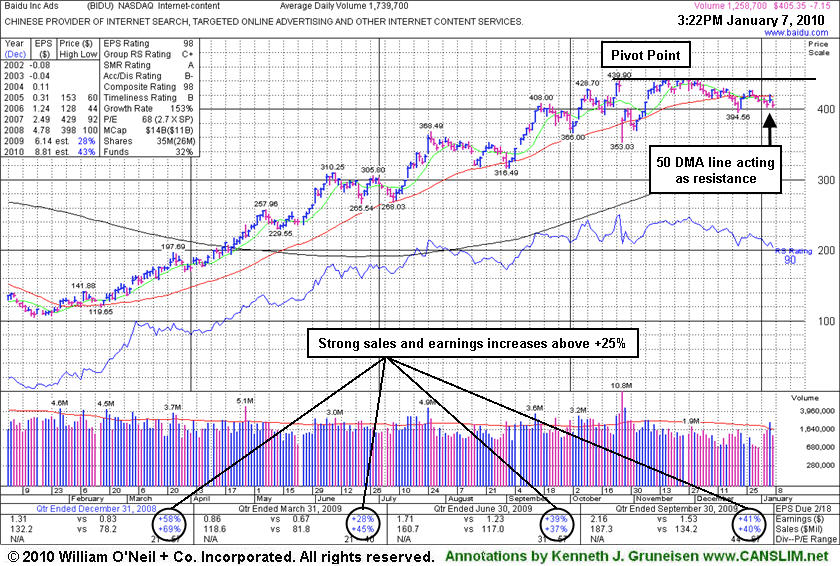
Baidu.com, Inc. (BIDU -$7.02 or -1.72% to $407.38) suffered a 3rd consecutive loss today on light volume, leading to further deterioration below its 50-day moving average (DMA) line. The weakness, and its lack of upward progress, is raising concerns and hurting its outlook. Its color code was changed to green as it slumped from near its pivot point. It would need to rally above its latest pivot point to trigger a new buy signal. Technically, it has built a sloppy base over 8 weeks. Since quietly rallying to new highs in November it has stalled.
This Chinese provider of Internet search and content services could continue base-building for a longer period. Patience is important because without convincing gains leading to a fresh breakout there is little assurance it is capable of sustaining a meaningful rally higher. Even a powerful breakout might be risky to trade after its 4-fold ascent this year, its recent action could be "late-stage" and more failure prone.
BIDU proved resilient near its 50 DMA line after its 10/27/09 gap down, and it was a sign of great institutional support, making a stand near its important short-term average line. Technically it traded a little bit above the prior chart high of $439.90 following the considerable gap down on earnings news, as it clawed its way to new all-time highs on lighter than average volume, leaving questions as to how much appetite the large investors had for accumulating a greater ownership interest. It is reassuring, however, that the number of top-rated funds owning BIDU's shares rose from 103 in Dec '08 to 169 in Sep '09, solid evidence its shares were being accumulated by the institutional (I criteria) crowd.
BIDU traded up as much as +23% from its price when featured in yellow in the 9/08/09 Mid-Day BreakOuts Report (read here). In this FSU section on 9/21/09 we summarized more extensive prior coverage this currently Featured Stock has received (read here).
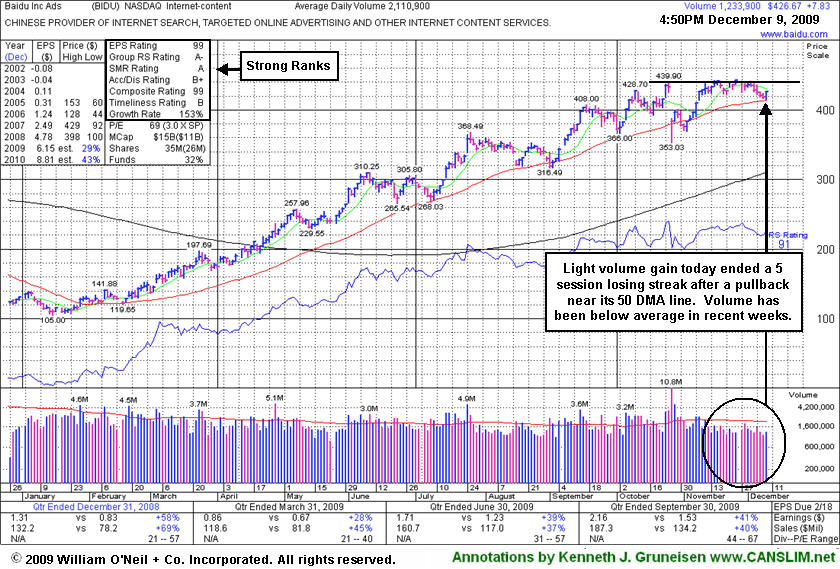
Baidu.com, Inc. (BIDU +$7.62 or +1.82% to $426.46) overcame early weakness today, posting a gain and closing at the session high while breaking a 5 session losing streak. The number of top-rated funds owning BIDU's shares rose from 103 in Dec '08 to 169 in Sep '09, clear evidence its shares were being accumulated by the institutional (I criteria) crowd. Technically, it has built a sloppy base over nearly 7 weeks while consolidating in a tight trading range near all-time highs as its 50-day moving average (DMA) line has caught up. Since quietly rallying to new highs in November, this Chinese provider of Internet search and content services has stalled. Its color code is changed to yellow again with new pivot point cited based upon its 10/26/09 high plus 10 cents. Gains above its pivot point, or to new high ground, with at least +50% above average volume would be considered a new bullish technical buy signal. Meanwhile, any deterioration below its 50 DMA line would raise concerns and hurt its outlook, while it could continue base-building for a longer period. Patience is important because without convincing gains leading to a fresh breakout there is little assurance it can sustain a meaningful rally higher. Even a powerful breakout might be risky to trade after its 4-fold ascent this year, its recent action could be "late-stage" and more failure prone.
BIDU proved resilient near its 50 DMA line after its 10/27/09 gap down, and it was a sign of great institutional support, making a stand near its important short-term average line. Technically it traded a little bit above the prior chart high of $439.90 following the considerable gap down on earnings news, as it clawed its way to new all-time highs on lighter than average volume, leaving questions as to how much appetite the large investors had for accumulating a greater ownership interest in the high-ranked. The last appearance in this FSU section on 11/25/09 included an annotated graph illustrating its "wedging" action under the headline "Wedging To New Highs With Light Volume Behind Gains."
BIDU traded up as much as +23% from its price when featured in yellow in the 9/08/09 Mid-Day BreakOuts Report (read here). In this FSU section on 9/21/09 we summarized more extensive prior coverage this currently Featured Stock has received (read here).
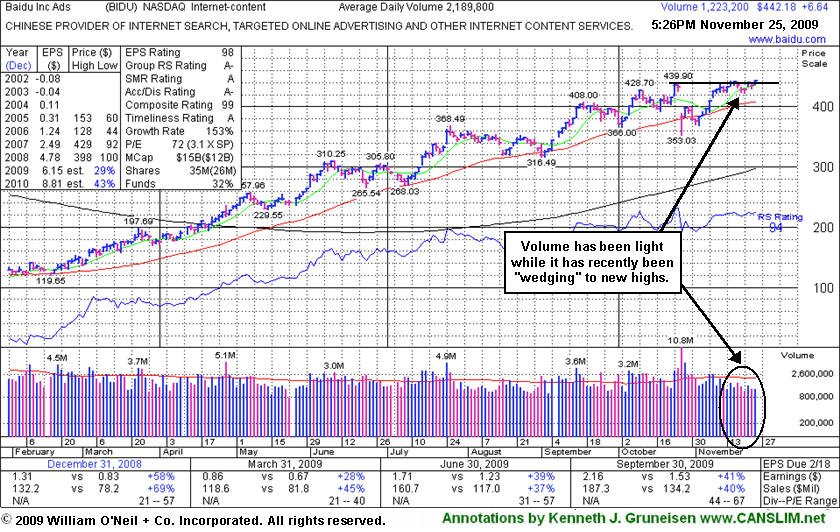
Baidu.com, Inc. (BIDU +$6.64 or +1.52% to $442.18) posted a gain on light volume today for a new all-time high close. It proved resilient near its 50-day moving average (DMA) line after its 10/27/09 gap down. That was a sign of great institutional support, making a stand near its important short-term average line. However, as it clawed its way to new all-time high closes on light volume recently, the light volume leaves questions as to how much appetite the large investors have for accumulating a greater interest.
BIDU was featured in yellow in the 9/08/09 Mid-Day BreakOuts Report (read here). The number of top-rated funds owning BIDU's shares rose from 112 in Sept '08 to 169 in Sep '09, clear evidence its shares were being accumulated by the institutional (I criteria) crowd. An earlier FSU section appearance described some of the more extensive prior coverage this Chinese Internet search provider has received (read here).
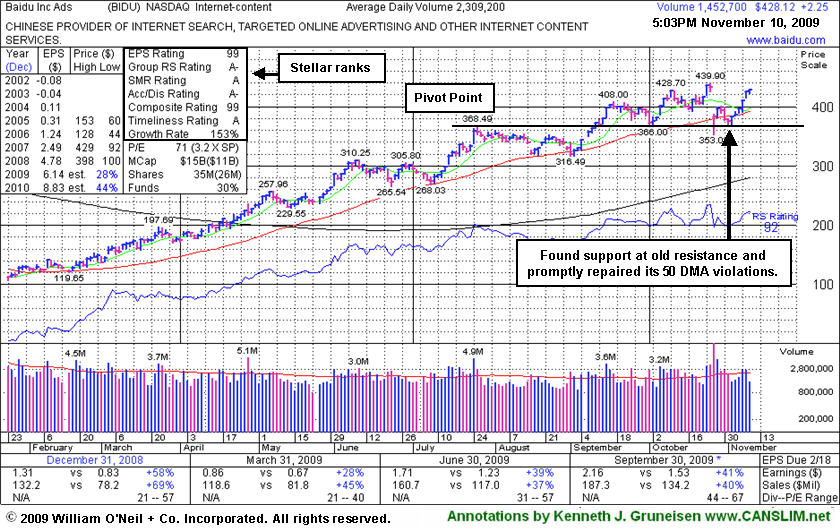
Baidu.com, Inc. (BIDU +$2.25 or +0.53% to $428.12) today posted its 6th consecutive gain on light or near average volume. It proved resilient near its 50 DMA line after its 10/27/09 gap down. It made an admirable stand above prior chart highs (that were the basis for its previously cited pivot point) since its last appearance in this FSU section on 10/28/09 under the headline "Chinese Internet Content Firm Gapped Down To Classic Chart Support Level". In that report it was observed that, "Whenever a stock which has made a many-fold run up in price flashes its largest point loss on the highest volume down day in more than 10 months, such clearly negative action may be considered a technical sell signal."
Broader market (M criteria) weakness and distributional pressure on the major market averages at the time heightened concerns investors might have while holding any stocks. Since then, however, the market dug its heels in and produced a solid follow through day. The stock also proved its resilience, but as recently noted, "Choppy action has not allowed it to form a sound base in recent weeks." Patience may allow for a proper base to form, however there is not an ideal entry point under the guidelines now.
BIDU traded up as much as +23% from its price when featured in yellow in the 9/08/09 Mid-Day BreakOuts Report (read here). The number of top-rated funds owning BIDU's shares rose from 112 in Sept '08 to 160 in Jun '09, clear evidence its shares were being accumulated. An earlier FSU appearance described some of the more extensive prior coverage this Chinese Internet search provider has received (read here).
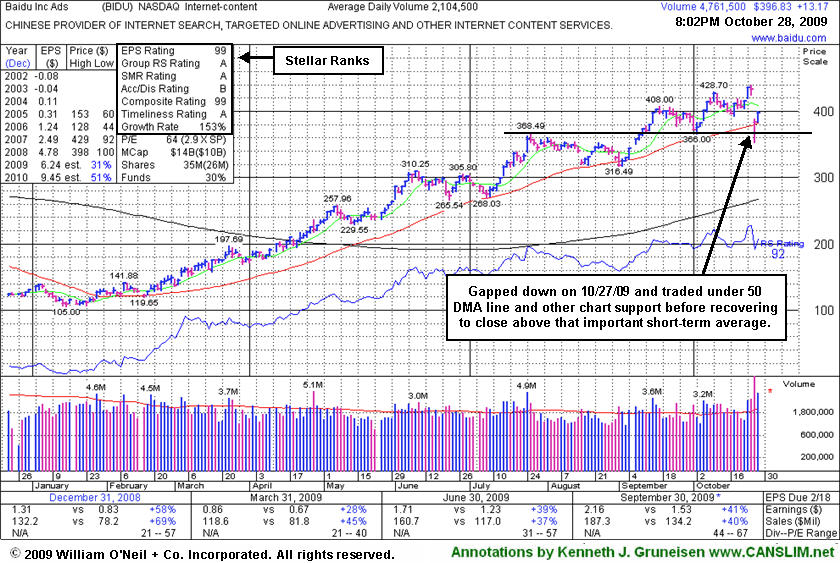
Baidu.com, Inc. (BIDU +$13.17 or +3.21% to $396.83) bucked the market's widespread weakness today, posting a gain while rallying up from its 50-day moving average (DMA) line where it has found impressive and prompt support. Volume spiked to 5 times normal on 10/27/09 as it gapped down for a considerable loss following its latest earnings report, yet it rallied back from extreme lows below its 50 DMA line and other chart support to close just above its important short term average near the session high. However, whenever a stock which has made a many-fold run up in price flashes its largest point loss on the highest volume down day in more than 10 months, such clearly negative action may be considered a technical sell signal.
As recently noted, "Choppy action has not allowed it to form a sound base in recent weeks." BIDU traded up as much as +23% from its price when featured in yellow in the 9/08/09 Mid-Day BreakOuts Report (read here). Broader market (M criteria) weakness and distributional pressure now weighing on many leading issues is an increasing concern, since 3 out of 4 stocks tend to follow the general direction of the broader market averages. Such is the case, even while the number of top-rated funds owning BIDU's shares rose from 112 in Sept '08 to 159 in Jun '09, clear evidence its shares were being accumulated. An earlier FSU appearance described some of the more extensive prior coverage this Chinese Internet search provider has received (read here).
Baidu.com, Inc. (BIDU +$12.80 or +3.09% to $413.80) blasted to a new 2009 today with a second consecutive gain on above average volume, action indicative of more institutional buying demand (the I criteria). Its latest consolidation was too short to be considered a new sound base pattern, however. The number of top-rated funds owning its shares rose from 112 in Sept '08 to 156 in Jun '09, clear evidence its shares were being accumulated. When last reviewed in this FSU section on 9/21/09 under the headline "Baidu's Bullish Gains Viewed On Weekly Graph" it was noted for having gotten too extended from its latest sound base, and for being, "difficult to impossible for disciplined investors to buy properly within the investment system's guidelines." General market weakness and some moderate distributional pressure afterward led to a pullback that tested support at prior chart highs, however, offering investors a more ideal opportunity to accumulate shares in the high-ranked Internet - Content firm without chasing it more than +5% above its pivot point.
Its pullback raised some concerns which were noted, while its color code was changed to yellow on 10/01/09 and remained so in its 10/02/09 and 10/05/09 report appearances. The color code is not a recommendation, and it does not work like a traffic light! It is an indication that a Featured Stock is considered by CANSLIM.net's investment system experts to be among the "better buy candidates" if yellow, or "no longer buyable under the guidelines" if green. When you use the "view all notes" links to review prior analysis on any given stock, the Y or G designations at the front of the notes allow members to quickly determine what shape that Featured Stock was in at the time the note was entered. Once a stock is noted and dropped from the Featured Stocks list it is no longer color coded, unless it meets the criteria and is featured again later. In its previous FSU appearance we described extensive prior coverage BIDU has received (read here).
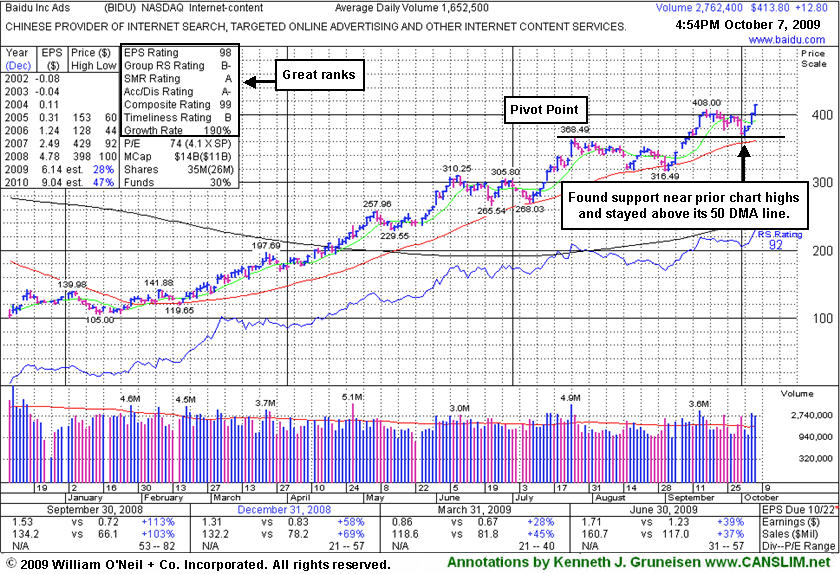
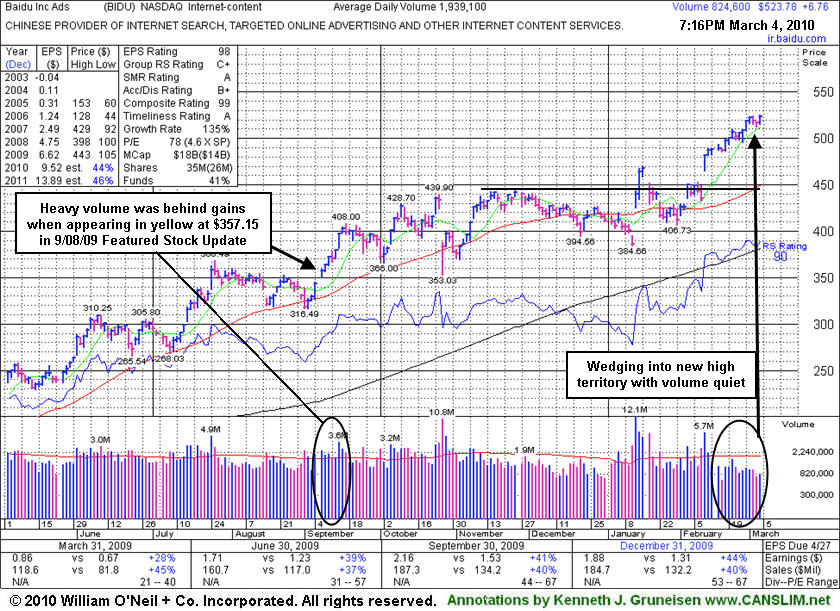
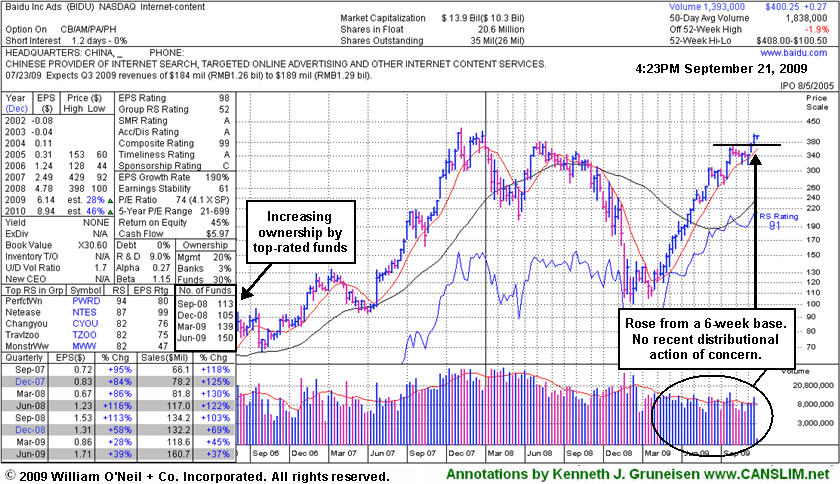
Baidu.com, Inc. (BIDU +$0.27 or +0.07% to $400.25) is quietly perched near the $400 level after 3 consecutive weekly gains. Its annotated weekly graph below shows no recent distributional action of concern and highlights increasing ownership by top-rated funds (the I criteria). BIDU was setting up on the right side of a near 6-week flat base while rising toward its 52 week high after its latest test of support at its 50-day moving average (DMA) line when it gapped up on 9/08/09 it was featured in yellow in the mid-day report with new pivot point and max buy levels cited (read here). By the time a fresh technical buy signal was triggered by its 9/15/09 gain with heavy enough volume to meet guidelines, its price was getting too extended above its pivot point by more than 5%, making it difficult to impossible for disciplined investors to buy properly within the investment system's guidelines.
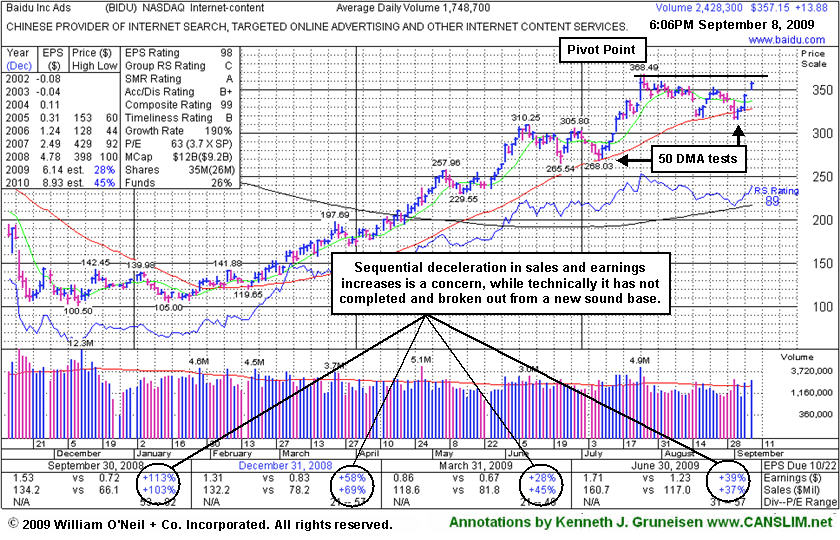
Its action was last summarized in this FSU section with an annotated daily graph on 9/08/09 under the headline, "Baidu Near Multi-Year Highs, But Decelerating Growth Is A Concern." In the bottom left portion of the weekly graph below you can see that sales and earnings increases were still above the +25% guideline in recent quarters, but the increases have been generally decelerating, giving cause for concern.
We still stand behind the recent analysis. Others have described the stock's action since 2008 as a big cup-with-handle pattern. However, the pullback or "correction" in the course of a normal cup-with-handle typically is not more than 50%. In this case, its substantial pullback from $380 to $100 is well beyond the normal guideline for a proper cup-with-handle pattern. Of course, the Bear Market contributed to its weakness, yet that pullback of -73% was deeper than the major averages' correction during the same bearish period.
Based on weak technical action BIDU was dropped from the Featured Stocks list on 1/11/08, when it was trading at $329, and it has rebounded very impressively from its January 2009 lows near $100. An annotated graph showed a vivid picture of the stock's weakness then under the headline, "Weakness Hurting Chances For Featured Favorite" (read here). Take a look back at that now! BIDU had rallied +356% since it first featured on Monday, October 30, 2006 in the CANSLIM.net Mid Day Breakouts Report (read here) with a $94.05 pivot point. Along the way it went through a multi-month consolidation under its 50 and 20 DMA lines, then later returned as a noteworthy leader featured in CANSLIM.net reports." Remember that a dropped stock can be featured again in a future CANSLIM.net report if it repairs its technical damage and forms a new pivot point. After its initial appearance, in fact, BIDU was featured again in yellow at $225.58 in the 09/11/07 CANSLIM.net Mid-Day BreakOuts Report as it was hitting new highs from an 8-week base period (read here). It may have looked "expensive" then, yet it subsequently zoomed to $429 by November of that year before beginning a very deep consolidation (coupled with a Bear Market).
Baidu.com, Inc. (BIDU +$13.88 or +3.89% to $357.15) gapped up today and was featured in yellow in the mid-day report with new pivot point and max buy levels cited (read here). It is setting up on the right side of a near 6-week flat base while rising toward its 52 week high after its latest test of support at its 50-day moving average (DMA) line. That important short-term average line acted as firm support in July. The latest consolidation is shorter than the minimum 8-week length of a proper "double bottom" pattern. This high-ranked leader has a solid quarterly and annual earnings history, but its clear sequential deceleration in its increases is a concern which has been cited in recent reports. It could deserve the benefit of the doubt is a fresh technical buy signal is triggered. Remember that the investment system's guidelines require for a proper technical breakout to rise above its pivot point with heavy volume that is a minimum of +50% above average, preferably much more.
Based on weak technical action it was dropped from the Featured Stocks list on 1/11/08, when it was trading at $329, and it has rebounded very impressively from its January 2009 lows near $100. An annotated graph showed a vivid picture of the stock's weakness then under the headline, "Weakness Hurting Chances For Featured Favorite" (read here). Take a look back at that now! BIDU had rallied +356% since it first featured on Monday, October 30, 2006 in the CANSLIM.net Mid Day Breakouts Report (read here) with a $94.05 pivot point. Along the way it went through a multi-month consolidation under its 50 and 20 DMA lines, then later returned as a noteworthy leader featured in CANSLIM.net reports." Remember that a dropped stock can be featured again in a future CANSLIM.net report if it repairs its technical damage and forms a new pivot point. After its initial appearance, in fact, BIDU was featured again in yellow at $225.58 in the 09/11/07 CANSLIM.net Mid-Day BreakOuts Report as it was hitting new highs from an 8-week base period (read here). It may have looked "expensive" then, yet it subsequently zoomed to $429 by November of that year before beginning a very deep consolidation (coupled with a Bear Market).
One of the critical characteristics of successful investing is knowing when to sell. Investors are best served when they buy based on the combination of strong fundamentals and technicals, then sell based on the technicals. The reason is because fundamentals often tend to lag a stock's technical condition and come to light later to help explain the technical chart action after the fact.
Baidu.com, Inc. (BIDU -$10.29 or -3.23% to $329.25) continued falling below its 50-day moving average (DMA) line and its recently violated upward trendline. Based on its recent weak action it will be dropped from the CANSLIM.net Featured Stocks list tonight. BIDU rallied +356% since it first featured on Monday, October 30, 2006 in the CANSLIM.net Mid Day Breakouts Report (read here) with a $94.05 pivot point.
A great resource that CANSLIM.net readers use to monitor a stock's ongoing action is the CANSLIM.net Featured Stocks Page. Each day, readers are informed of the important action in leading stocks. Today's note on BIDU is a great example of this powerful tool, as it includes the following important observations: "Traded down in 9 of the past 10 sessions during which sell signals were triggered by its 50 DMA breach and violation of the upward trendline connecting its August-November chart lows - evidence of its technical deterioration. Along the way it went through a multi-month consolidation under its 50 and 20 DMA lines, then later returned as a noteworthy leader featured in CANSLIM.net reports." Remember that a stock can be featured again in a future CANSLIM.net report if it repairs its technical damage and forms a new pivot point. After its initial appearance, in fact, BIDU was featured again in yellow at $225.58 in the 09/11/07 CANSLIM.net Mid-Day BreakOuts Report as it was hitting new highs from an 8-week base period (read here).
C A N S L I M | StockTalk | News | Chart | SEC | Zacks Reports | ![]()
![]()
![]()

View all notes | Alert me of new notes | CANSLIM.net Company Profile
Group action plays a very important role, and experienced investors learn that they can increase their odds of picking a great winner by always focusing their buying efforts in the market's leading groups. The "L" criteria in tells us to choose leading companies in leading industry groups, thus it is suggested that investors choose from the top quartile of the 197 Industry Groups (listed in the paper most days on page B4). A classic example of the success enjoyed by many CANSLIM.net readers usually starts when an investor reads a CANSLIM.net report and buys a featured stock before it has risen above the pivot point by greater than 5%. After a stock breaks out above its pivot point, there is only a +5% window that investors have to purchase the stock under the proper guidelines. Once a stock rises above the "maximum buy price" the risk of a shake out balloons, meaning that even a normal retracement in the stock might force you to employ the 7-8% loss cutting rule. Much can be told by the stock's daily action in the weeks and months that follow a breakout. Typically, a light volume and orderly pullback suggests that the bulls remain in control. However, high volume pullbacks that violate support paint a totally different picture.
Baidu.com, Inc.(BIDU +$9.53 or +2.38% to $409.20) enjoyed its second best close ever as it rose above its latest buy point on light volume. This stock was first featured on Monday, October 30, 2006 in the CANSLIM.net Mid Day Breakouts Report (read here) with a pivot point of ) $92.20. Early on, BIDU experienced a lot of whipsaw type action that made it very difficult to successfully trade for meaningful gains. After its initial breakout and buy signal, BIDU pulled back and triggered a technical sell signal when it soon traded below the 7-8% guideline. That action was discussed in the November 07, 2006 CANSLIM.net After-Market Report (read here) with the following note: "The recent distributional action is a concern, yet any rally to another new high close with adequate volume may again trigger a technical buy signal." The very next day this stock jumped to a new high close on the necessary volume and triggered a new technical buy signal. Since then it has surged a whopping +365%, and continues consolidating that impressive move.
BIDU's healthy action has helped it appear several times in various CANSLIM.net reports. Most recently, the stock appeared in the September 17, 2007 edition of the CANSLIM.net Mid Day Breakouts Report (read here) with a new $219.35 pivot point and a $230.32 maximum buy price. The stock vaulted an impressive +95% over the next few months before pulling back and finding support near its 50-day moving average (DMA) line in early November. After finding support near that important threshold, the bulls emerged and repaired the damage as it formed a new base. This healthy action has created a new $408.98 pivot point and a new $429.43 maximum buy price. As of today's action, the stock closed above its latest pivot point, but disciplined investors would notice that it failed to do so with the necessary volume needed to trigger a proper technical buy signal. A new technical buy signal would be triggered if gains are backed by volume at least +50% above average to confirm the breakout. Until then, patience is paramount.
C A N S L I M | StockTalk | News | Chart | SEC | Zacks Reports | ![]()
![]()
![]()

View all notes | Alert me of new notes | CANSLIM.net Company Profile
Often, when a leading stock is setting up to breakout of a solid base it is highlighted in CANSLIM.net's Mid-Day Breakouts Report. The most relevant factors are noted in the report which allows prudent CANSLIM oriented investors to place the issue in their watch list. After doing any necessary backup research, the investor is prepared to act if and when the stock triggers a technical buy signal (breaks above its pivot point on more than +50% average turnover). In the event the stock fails to trigger a technical buy signal and its price declines then it will simply be removed from the watch list.
Baidu.com, Inc. (BIDU -$12.26 or -5.78% to $199.69) pulled back on about average volume as it continued consolidating above its 50-day moving average (DMA) line and just below its latest pivot point of $219.35. The stock was recently featured on Monday August 27, 2007 in the CANSLIM.net Mid Day Breakouts Report (read here) with the following note: "Recently repaired a brief violation of its 50 DMA line, now trading within -4.2% of all-time highs and basing for the past 6 weeks. A breakout above the new pivot point with at least +50% above average volume would trigger a technical buy signal. Market conditions (the "M" criteria) must improve with a follow-through day before disciplined investors will take any new positions. First featured at $94.05 in the 10/30/06 CANSLIM.net Mid-Day BreakOuts Report, and traded up as much as +133% since that appearance it was triggering an initial technical buy signal (read here)." Until this stock trades above its latest pivot point with gains backed by at least +50% above average volume it should remain on an active watch list.
This stock was first featured on Monday, October 30, 2006 in the CANSLIM.net Mid Day Breakouts Report (read here) with a pivot point of ) $92.20. Early on, BIDU experienced a lot of whipsaw type action that made it very difficult to successfully trade for meaningful gains. After its initial breakout and buy signal, BIDU pulled back and triggered a technical sell signal when it soon traded below the 7-8% guideline. That action was discussed in the November 07, 2006 CANSLIM.net After-Market Report (read here) with the following note: "The recent distributional action is a concern, yet any rally to another new high close with adequate volume may again trigger a technical buy signal." The very next day this stock jumped to a new high close on the necessary volume and triggered a new technical buy signal. Since then it has surged over +133%, and continues consolidating that impressive move.
C A N S L I M | StockTalk | News | Chart | SEC | Zacks Reports

View all notes | Alert me of new notes | CANSLIM.net Company Profile
It is not uncommon for leading stocks to pull back after breaking out. Ideally, volume is lighter when the stock retraces back toward a chart support area such as prior chart highs, an upward trend line, or a key moving average such as the 50-day moving average (DMA) line or 200 DMA line. Violations of those technical support levels are a concern, and they are a much greater concern when they occur on higher than average volume. It is especially worrisome when the volume on the down day exceeds the above average volume which had accompanied the prior gains.
Baidu.com, Inc. (BIDU -$3.05 or -2.54% to $117.00) continued pulling back, which is normal after a very impressive rally. It was first featured on Monday, October 30, 2006 in the CANSLIM.net Mid Day Breakouts Report (read here) with a pivot point of ) $92.20. Early on, BIDU experienced a lot of whipsaw type action that made it very difficult to successfully trade for meaningful gains. After its initial breakout and buy signal, BIDU pulled back and triggered a technical sell signal when it soon traded below the 7-8% guideline. That action was discussed in the November 07, 2006 CANSLIM.net After-Market Report (read here) with the following note: "The recent distributional action is a concern, yet any rally to another new high close with adequate volume may again trigger a technical buy signal." The very next day this stock jumped to a new high close on the necessary volume and triggered a new technical buy signal. Since then it has surged over +30%, and it has recently begun consolidating that impressive move. It is nearing its November chart highs that were a brief resistance level, however there is not a lot of near-term chart support and its prior chart highs and its 50 DMA line are far below current prices.
C A N S L I M | StockTalk | News | Chart | ![]() DGO | SEC | Zacks Reports
DGO | SEC | Zacks Reports

View all notes | Alert me of new notes | CANSLIM.net Company Profile
Another important factor is the relationship between an uptrend and a stock's pivot point. Typically, stocks begin forming an uptrend after rising above their pivot point. In the event the upward trend is violated, the stock will generally be expected to continue falling until it can retest support. Initial support is often the 50 DMA, or its pivot point, whichever is higher.
Baidu.com, Inc. (BIDU +$5.23 or +5.28% to $93.88) surged for considerable gains on more than two times its average volume. This stock was first featured on Monday, October 30, 2006 in the CANSLIM.net Mid Day Breakouts Report (read here) with a $92.20 pivot point. It reported earnings and initially traded up on 10/31, but after hitting a new 52-week high it promptly ran into heavy resistance and negatively reversed. It continued lower but found support at its 50 DMA line, demonstrating action that is commonly seen in healthy stocks. Usually a healthy stock will not show such weakness, however, this stock's movement was erratic enough that it triggered the 7-8% sell rule, diving -9% below its pivot point before finding support. Now it is encouraging to see it bounce off support at its 50 DMA and show positive price action with above average volume. The recent distributional action is a concern, yet any rally to another new high close with adequate volume may again trigger a technical buy signal.
C A N S L I M | StockTalk | News | Chart | SEC | Zacks Reports

View all notes | Alert me of new notes | CANSLIM.net Company Profile
Once again, the "L" criteria in CAN SLIM(R) tells investors to choose leading companies in leading industry groups, and when we have identified a high-ranked leader with the proper characteristics we should wait and watch for gains on at least +50% above average volume as a confirmation that a breakout is attracting meaningful institutional sponsorship. A classic example of the success enjoyed by many CANSLIM.net readers usually starts when an investor reads a CANSLIM.net report and buys a featured stock before it has risen above the pivot point by greater than 5%. After a stock triggers a technical buy signal and is purchased, it is always important to employ the 7-8% loss cutting rule in the event of a downturn.
Baidu.com, Inc. (BIDU +$7.00 or +6.80% to $96.00) surged to a fresh 52-week high close on 4.5 times its average daily trading volume. This stock was first featured today in the CANSLIM.net Mid Day Breakouts Report (read here) with a $92.20 pivot point. This stock sports an impressive 94 Relative Strength (RS) rating and a decent 84 Earnings Per Share (EPS) rating. Baidu has clocked sizeable gains in the past four quarters on both the earnings and revenue front. Whenever a stock tops multi-month highs for a new high close with considerable gains coming on nearly 5 times normal volume it is a clear sign of institutional buying demand (the "I" criteria of the CAN SLIM(R) investment program). It finished the day near the session highs yet still under the maximum buy price listed in the report at $96.81, a guideline set at 5% above the pivot. As always, it is very important not to chase a stock by entering initial positions when the price is extended above the guidelines.
If it reverses and trades below its pivot point, the recent bullish action would be completely negated, and the odds would argue against holding. It is imperative to cut your losses if ever the 7-8% rule is triggered.C A N S L I M | StockTalk | News | Chart | ![]() DGO | SEC | Zacks Reports
DGO | SEC | Zacks Reports

View all notes | Alert me of new notes | CANSLIM.net Company Profile