Baidu's Bullish Gains Viewed On Weekly Graph
Monday, September 21, 2009 CANSLIM.net

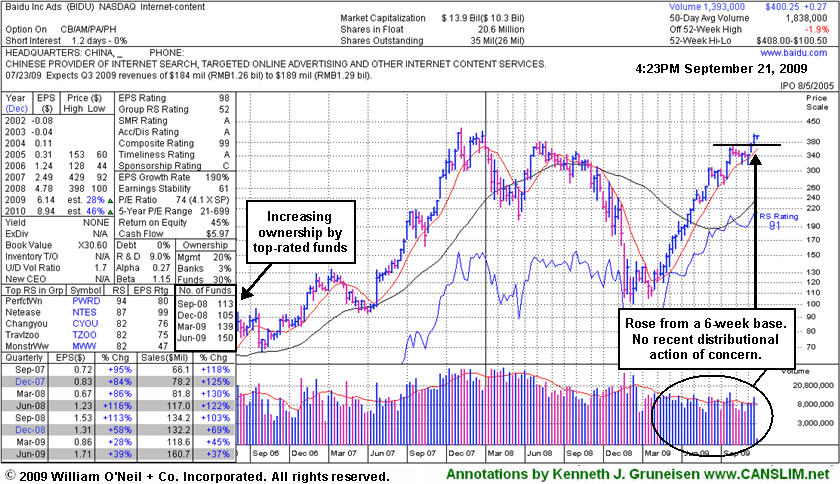
Baidu.com, Inc. (BIDU +$0.27 or +0.07% to $400.25) is quietly perched near the $400 level after 3 consecutive weekly gains. Its annotated weekly graph below shows no recent distributional action of concern and highlights increasing ownership by top-rated funds (the I criteria). BIDU was setting up on the right side of a near 6-week flat base while rising toward its 52 week high after its latest test of support at its 50-day moving average (DMA) line when it gapped up on 9/08/09 it was featured in yellow in the mid-day report with new pivot point and max buy levels cited (read here). By the time a fresh technical buy signal was triggered by its 9/15/09 gain with heavy enough volume to meet guidelines, its price was getting too extended above its pivot point by more than 5%, making it difficult to impossible for disciplined investors to buy properly within the investment system's guidelines.
Its action was last summarized in this FSU section with an annotated daily graph on 9/08/09 under the headline, "Baidu Near Multi-Year Highs, But Decelerating Growth Is A Concern." In the bottom left portion of the weekly graph below you can see that sales and earnings increases were still above the +25% guideline in recent quarters, but the increases have been generally decelerating, giving cause for concern.
We still stand behind the recent analysis. Others have described the stock's action since 2008 as a big cup-with-handle pattern. However, the pullback or "correction" in the course of a normal cup-with-handle typically is not more than 50%. In this case, its substantial pullback from $380 to $100 is well beyond the normal guideline for a proper cup-with-handle pattern. Of course, the Bear Market contributed to its weakness, yet that pullback of -73% was deeper than the major averages' correction during the same bearish period.
Based on weak technical action BIDU was dropped from the Featured Stocks list on 1/11/08, when it was trading at $329, and it has rebounded very impressively from its January 2009 lows near $100. An annotated graph showed a vivid picture of the stock's weakness then under the headline, "Weakness Hurting Chances For Featured Favorite" (read here). Take a look back at that now! BIDU had rallied +356% since it first featured on Monday, October 30, 2006 in the CANSLIM.net Mid Day Breakouts Report (read here) with a $94.05 pivot point. Along the way it went through a multi-month consolidation under its 50 and 20 DMA lines, then later returned as a noteworthy leader featured in CANSLIM.net reports." Remember that a dropped stock can be featured again in a future CANSLIM.net report if it repairs its technical damage and forms a new pivot point. After its initial appearance, in fact, BIDU was featured again in yellow at $225.58 in the 09/11/07 CANSLIM.net Mid-Day BreakOuts Report as it was hitting new highs from an 8-week base period (read here). It may have looked "expensive" then, yet it subsequently zoomed to $429 by November of that year before beginning a very deep consolidation (coupled with a Bear Market).

 Get
a Free 14 Day All Access Trial
Get
a Free 14 Day All Access Trial