Fundamental Concerns Yet Rebound Helped Technical Stance - Monday, August 14, 2017
Found Prompt Support at 50-Day Moving Average Line - Friday, July 7, 2017
Rising From Advanced Base With Above Average Volume - Friday, May 26, 2017
Sputtering Below its 50-Day Moving Average - Monday, March 20, 2017
Recent 50-Day Violation Raised Concerns - Tuesday, February 7, 2017
Orderly Consolidation Continues Well Above Support - Tuesday, January 3, 2017
Pulling Back After "Breakaway Gap" With Heavy Volume - Thursday, December 1, 2016
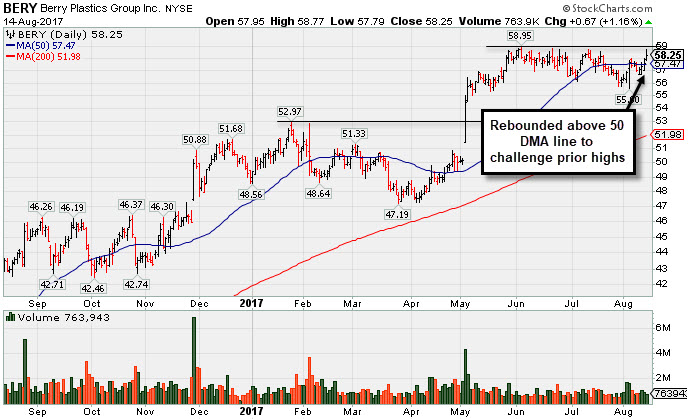
Fundamental Concerns Yet Rebound Helped Technical Stance - Monday, August 14, 2017
Berry Plastics Group Inc (BERY +$0.67 or +1.16% to $58.25) is consolidating back above its 50-day moving average (DMA) line ($56.63). However, it recently reported Jun '17 quarterly earnings +13% on +16% sales revenues, below the +25% minimum earnings guideline (C criteria), raising fundamental concerns. Disciplined investors have better odds by choosing buy candidates without fundamental flaws. Damaging losses below the 50 DMA line and recent lows would raise greater concerns and trigger a technical sell signal.
BERY had reported earnings +36% on +12% sales revenues for the Mar '17 quarter, after earnings rose +43% on -7% sales revenues for the Dec '16 quarter. The lower sales revenues were noted as a cause for concern, especially after the 4 prior quarterly comparisons showed strong sales revenues increases in the +32-35% range.
BERY was last shown in this FSU section on 7/07/17 with an annotated graph under the headline, "Found Prompt Support at 50-Day Moving Average Line". The high-ranked Containers/Packaging firm's annual earnings (A criteria) history has been strong. The number of top-rated funds owning its shares rose from 580 in Sep '16 to 637 in Jun '17, a reassuring sign concerning the I criteria. Its Up/Down Volume Ratio of 1.0 is an unbiased indication its shares have been neutral in terms of accumulation/distribution over the past 50 days. It currently has a Timeliness Rating of C and a Sponsorship rating of C.
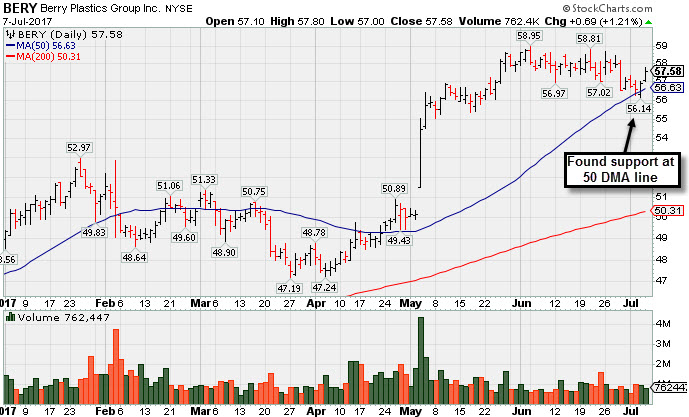
Found Prompt Support at 50-Day Moving Average Line - Friday, July 7, 2017
Berry Plastics Group Inc (BERY +$0.69 or +1.21% to $57.58) found support this week at its 50-day moving average (DMA) line ($56.63). More damaging losses would raise greater concerns and trigger a technical sell signal. It was highlighted in yellow with new pivot point cited based on its 5/10/17 high plus 10 cents in the 5/26/17 mid-day report (read here). It rebounded and rallied to new highs after dropped from the Featured Stocks list on 3/24/17.
BERY recently reported earnings +36% on +12% sales revenues for the Mar '17 quarter, and fundamentals remain strong. It reported earnings +43% on -7% sales revenues for the Dec '16 quarter. The lower sales revenues were noted as a cause for concern, especially after the 4 prior quarterly comparisons showed strong sales revenues increases in the +32-35% range.
BERY was last shown in this FSU section on 5/26/17 with an annotated graph under the headline, "Rising From Advanced Base With Above Average Volume". The high-ranked Containers/Packaging firm's annual earnings (A criteria) history has been strong. The number of top-rated funds owning its shares rose from 580 in Sep '16 to 641 in Jun '17, a reassuring sign concerning the I criteria. Its Up/Down Volume Ratio of 1.4 is an unbiased indication its shares have been under accumulation over the past 50 days. It currently has a Timeliness Rating of A and a Sponsorship rating of C.
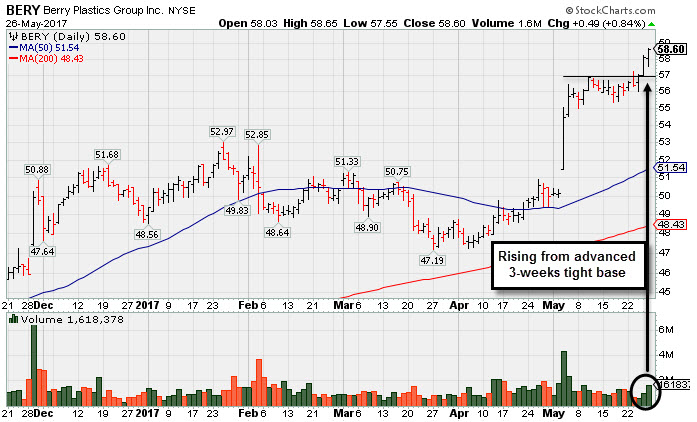
Rising From Advanced Base With Above Average Volume - Friday, May 26, 2017
Berry Plastics Group Inc (BERY +$0.49 or +0.84% to $58.60) was highlighted in yellow with new pivot point cited based on its 5/10/17 high plus 10 cents in the earlier mid-day report (read here). It had +32% above average volume behind its gain for a new high while rising from an advanced "3-weeks tight" base. However, a proper technical breakout should have a minimum of +40% above average volume
It has rebounded and rallied to new highs after dropped from the Featured Stocks list on 3/24/17. It reported earnings +36% on +12% sales revenues for the Mar '17 quarter, and fundamentals remain strong. Recently it reported earnings +43% on -7% sales revenues for the Dec '16 quarter. The lower sales revenues are noted as a cause for concern, especially after the 4 prior quarterly comparisons showed strong sales revenues increases in the +32-35% range.
BERY was last shown in this FSU section on 3/20/17 with an annotated graph under the headline, "Sputtering Below its 50-Day Moving Average ". The high-ranked Containers/Packaging firm was highlighted in yellow with pivot point cited based on its 10/25/16 high plus 10 cents in the 11/30/16 mid-day report (read here). There was a "breakaway gap" on 11/29/16 powering to new 52-week highs with considerable volume-driven gains.
Its annual earnings (A criteria) history has been strong. The number of top-rated funds owning its shares rose from 473 in Dec '15 to 638 in Mar '17, a reassuring sign concerning the I criteria. Its Up/Down Volume Ratio of 1.7 is an unbiased indication its shares have been under accumulation over the past 50 days. It currently has a Timeliness Rating of A and a Sponsorship rating of C.
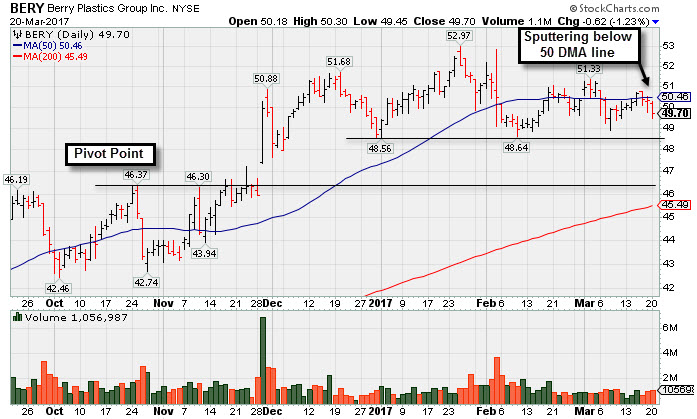
Sputtering Below its 50-Day Moving Average - Monday, March 20, 2017
Berry Plastics Group Inc's (BERY -$0.62 or -1.23% to $49.70) Relative Strength Rating is 74, back below the 80+ minimum for buy candidates under the fact-based investment system. Recently it has been sputtering below its 50-day moving average (DMA) line ($50.46) while prior lows in the $48.50 area define the next important near-term support. Damaging losses and violations would trigger a more worrisome technical sell signal.
BERY was last shown in this FSU section on 2/07/17 with an annotated graph under the headline, "Recent 50-Day Violation Raised Concerns", as it slumped below its 50-day moving average (DMA) line with volume-driven losses raising concerns and triggering a technical sell signal. Recently it reported earnings +43% on -7% sales revenues for the Dec '16 quarter. The lower sales revenues are noted as a cause for concern, especially after the 4 prior quarterly comparisons showed strong sales revenues increases in the +32-35% range.
The high-ranked Containers/Packaging firm was highlighted in yellow with pivot point cited based on its 10/25/16 high plus 10 cents in the 11/30/16 mid-day report (read here). There was a "breakaway gap" on 11/29/16 powering to new 52-week highs with considerable volume-driven gains. A breakaway gap is one noted exception to the rule that investors should not chase a stock more than +5% above prior highs, however, risk increases the further above the pivot point one buys any stock.
Its annual earnings (A criteria) history has been strong. The number of top-rated funds owning its shares rose from 473 in Dec '15 to 613 in Dec '16, a reassuring sign concerning the I criteria. It currently has a Timeliness Rating of B and a Sponsorship rating of B.
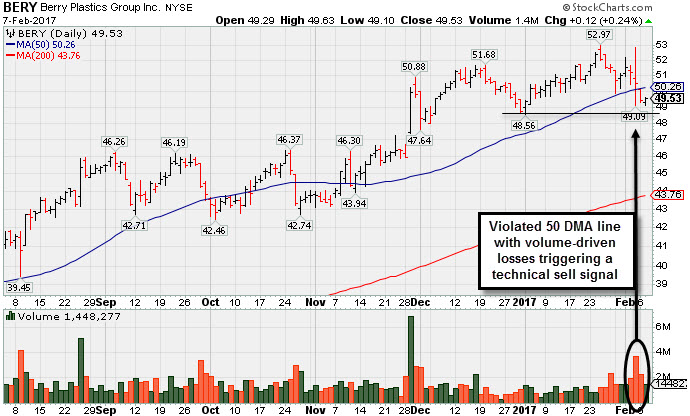
Recent 50-Day Violation Raised Concerns - Tuesday, February 7, 2017
Berry Plastics Group Inc (BERY +$0.12 or +0.24% to $49.53) recently slumped below its 50-day moving average (DMA) line with volume-driven losses raising concerns and triggering a technical sell signal. Recent lows in the $48.50 area define the next near-term support where a violation would trigger a more worrisome technical sell signal.
Recently it reported earnings +43% on -7% sales revenues for the Dec '16 quarter. The lower sales revenues are noted as a cause for concern, especially after the 4 prior quarterly comparisons showed strong sales revenues increases in the +32-35% range. BERY was last shown in this FSU section on 1/03/17 with an annotated graph under the headline, "Orderly Consolidation Continues Well Above Support", as it was consolidating above its "max buy" level with volume totals generally cooling since its breakout. The high-ranked Containers/Packaging firm was highlighted in yellow with pivot point cited based on its 10/25/16 high plus 10 cents in the 11/30/16 mid-day report (read here). There was a "breakaway gap" on 11/29/16 powering to new 52-week highs with considerable volume-driven gains. A breakaway gap is one noted exception to the rule that investors should not chase a stock more than +5% above prior highs, however, risk increases the further above the pivot point one buys any stock.
Its annual earnings (A criteria) history has been strong. The number of top-rated funds owning its shares rose from 473 in Dec '15 to 588 in Dec '16, a reassuring sign concerning the I criteria. Its current Up/Down Volume Ratio of 0.9 is an unbiased indication its shares have been under accumulation over the past 50 days. It currently has a Timeliness Rating of A and a Sponsorship rating of C.
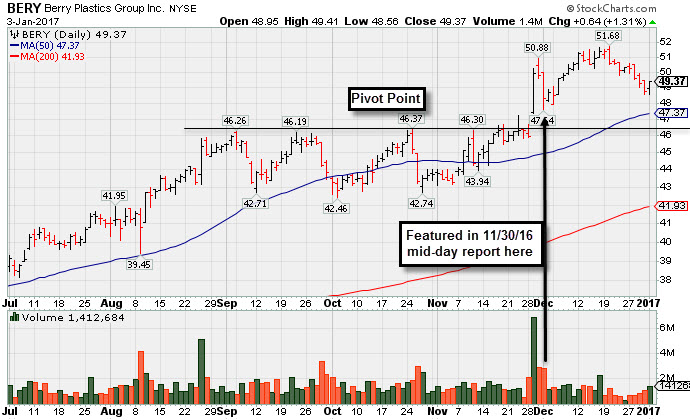
Orderly Consolidation Continues Well Above Support - Tuesday, January 3, 2017
Berry Plastics Group Inc (BERY +$0.64 or +1.31% to $49.37) found support today and posted a gain with better volume than seen while it has been consolidating above its "max buy" level with volume totals generally cooling since its breakout. Prior highs in the $46 area and its 50-day moving average (DMA) line ($47.37) define important support to watch on pullbacks.
It was last shown in this FSU section on 12/01/16 with an annotated graph under the headline, "Pulling Back After 'Breakaway Gap' With Heavy Volume". The high-ranked Containers/Packaging firm was highlighted in yellow with pivot point cited based on its 10/25/16 high plus 10 cents in the 11/30/16 mid-day report (read here). There was a "breakaway gap" on 11/29/16 powering to new 52-week highs with considerable volume-driven gains. A breakaway gap is one noted exception to the rule that investors should not chase a stock more than +5% above prior highs, however, risk increases the further above the pivot point one buys any stock.
Its annual earnings (A criteria) history has been strong. Big sales revenues and earnings increases above the +25% minimum guideline (C criteria) in the past 4 quarterly comparisons through Sep '16 help make it a match with the fact-based investment system's fundamental guidelines.
The number of top-rated funds owning its shares rose from 473 in Dec '15 to 568 in Sep '16, a reassuring sign concerning the I criteria. Its current Up/Down Volume Ratio of 1.3 is an unbiased indication its shares have been under accumulation over the past 50 days. It currently has a Timeliness Rating of A and a Sponsorship rating of C.
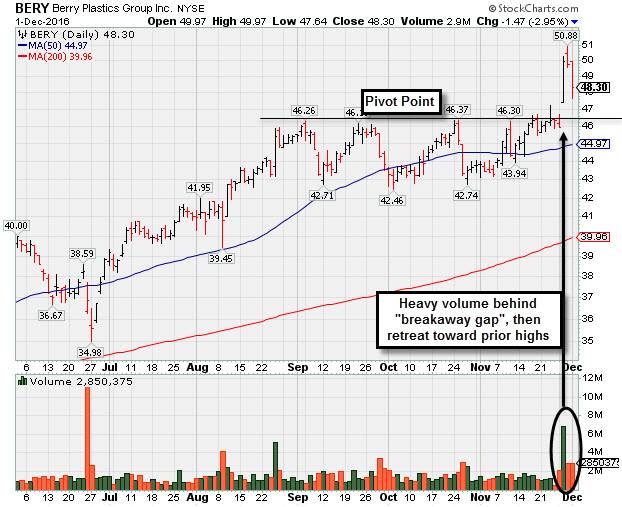
Pulling Back After "Breakaway Gap" With Heavy Volume - Thursday, December 1, 2016
Berry Plastics Group Inc (BERY -$1.47 or -2.95% to $48.30) pulled back with above average volume for a 2nd consecutive session. Prior highs in the $46 area define important near-term support to watch. The high-ranked Containers/Packaging firm was highlighted in yellow with pivot point cited based on its 10/25/16 high plus 10 cents in the 11/30/16 mid-day report (read here). There was a "breakaway gap" on 11/29/16 powering to new 52-week highs with considerable volume-driven gains. A breakaway gap is one noted exception to the rule that investors should not chase a stock more than +5% above prior highs, however, risk increases the further above the pivot point one buys any stock.
Its annual earnings (A criteria) history has been strong. Big sales revenues and earnings increases above the +25% minimum guideline (C criteria) in the past 4 quarterly comparisons through Sep '16 help make it a match with the fact-based investment system's fundamental guidelines.
The number of top-rated funds owning its shares rose from 473 in Dec '15 to 563 in Sep '16, a reassuring sign concerning the I criteria. Its current Up/Down Volume Ratio of 1.4 is an unbiased indication its shares have been under accumulation over the past 50 days. It has a Timeliness Rating of A but a Sponsorship rating of D.