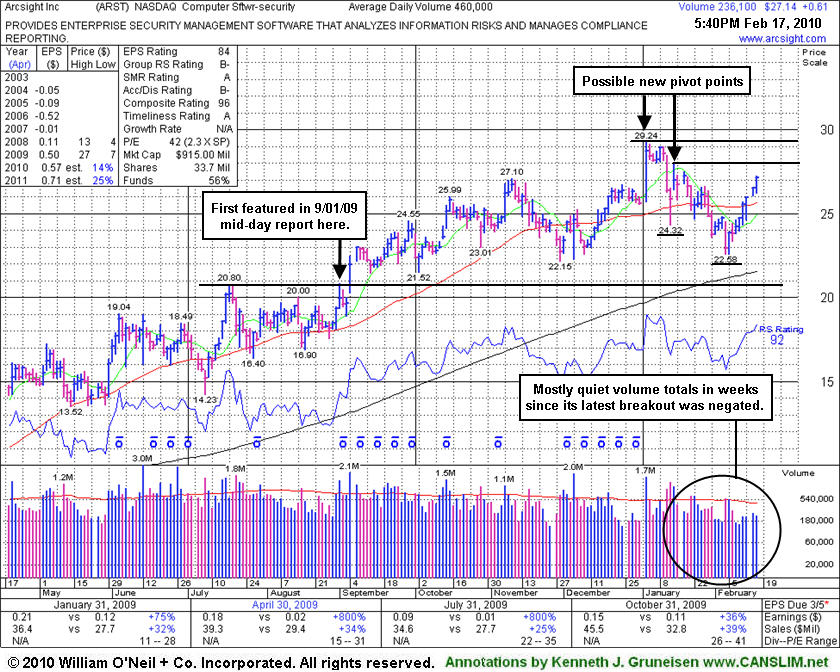
ArcSight, Inc. (ARST +$0.61 or +2.30% to $27.14) posted a 6th consecutive gain today with below average volume, rallying further above its 50-day moving average (DMA) line. In addition to the technical improvement above that short-term average that recently helped its outlook, its Earnings Per Share (EPS) rank has ratcheted back up above the 80 minimum guideline mentioned in the stock's last appearance in this FSU section with an annotated graph on 2/04/10 under the headline Gap Down and Waning EPS Rank Raise Concerns. Building a new potentially sound base now, its consolidation resembles a "double bottom" type pattern marked by an ideal "lower low" where its January 14th high of $27.95 could be used as the pivot point, however, it is a bit short of the minimum length (8 weeks) for a proper double bottom base. Otherwise, its all-time high ($29.24) could be the basis for a new pivot point. Either way, convincing gains above its recent peaks would be a very encouraging sign of hearty demand for the high-ranked Computer Software - Security firm's shares.
Market conditions (M criteria) leave disciplined investors still waiting patiently for a solid follow-through-day before any new buying efforts are justifiable under the investment system guidelines. Important support to watch now is its recent low ($22.58) and its 200 DMA line. ARST has continued putting up solid sales revenues and earnings results since first featured in yellow at $19.91 in the 9/01/09 mid-day report with an annotated daily graph (read here). On January 4, 2010 it had gapped up and triggered a technical buy signal as it blasted above its November 2009 high ($27.10), however, it failed to follow through with additional gains. Losses with above average volume later negated its last breakout and led to a close back in its prior base, raising concerns.
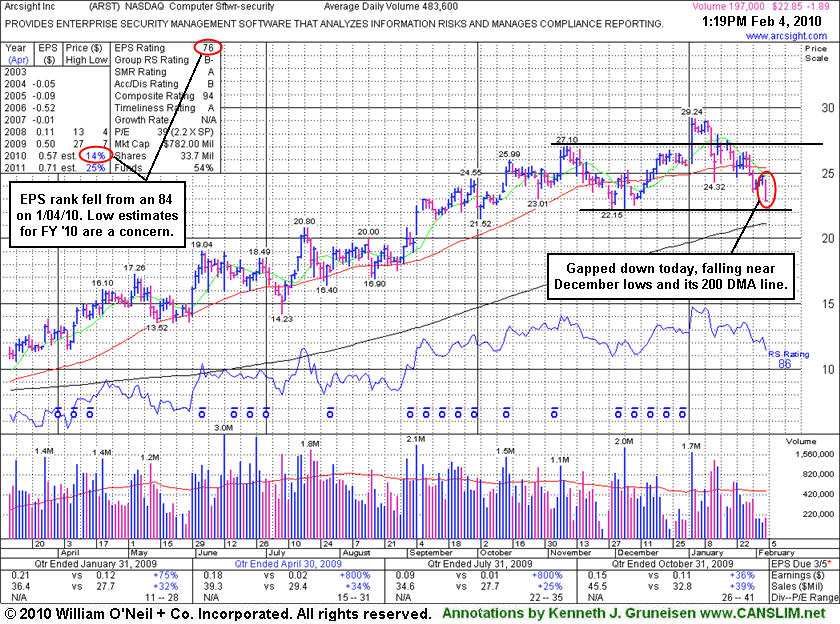
ArcSight, Inc. (ARST -$1.81 or -7.32% to $22.93) gapped down today, trading near its December lows and sinking toward its 200-day moving average (DMA) line. It would need to rebound above its 50 DMA line for its outlook to improve. Meanwhile, further deterioration below its prior lows or 200 DMA line would trigger additional sell signals. Distributional pressure negated its latest breakout. In the 1/21/10 Featured Stock Update (FSU) section (read here) we cautioned that its "close under its 12/31/09 close could prove to be a more ominous sign."
On January 4, 2010 it had gapped up and triggered a technical buy signal as it blasted above its latest pivot point. However, it failed to follow through with additional gains, then losses with above average volume negated its breakout and led to a close back in its prior base, raising concerns. In addition to the recent technical weakness, its Earnings Per Share (EPS) rank has fallen to 76 from 84 when it appeared in this FSU section on 1/04/10 under the headline "Breakout With Triple Average Volume Triggers Fresh Buy Signal." The Computer Software - Security firm has continued putting up solid sales revenues and earnings results since first featured in yellow at $19.91 in the 9/01/09 mid-day report with an annotated daily graph (read here). However, its waning EPS rank of late suggests that on a relative basis it has been lagging while other companies have been showing more explosive earnings growth during the current earnings season. ARST needs more time to potentially form a new sound base. Meanwhile, its weak action and market conditions (M criteria) leave disciplined investors waiting for a follow through day before any new buying efforts are justifiable under the investment system guidelines.
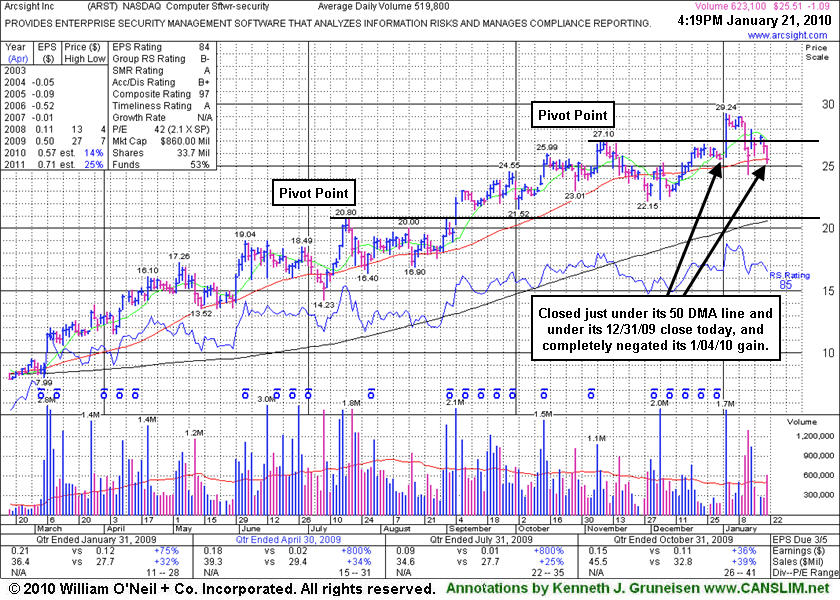
ArcSight, Inc. (ARST -$1.10 or -4.14% to $25.50) suffered a considerable loss today with above average volume. Technically, it closed just below its 50-day moving average (DMA) line (now $25.56), raising more serious concerns. Distributional pressure last week negated its latest breakout. Today's deterioration close under its 12/31/09 close could prove to be a more ominous sign. When last analyzed in this Featured Stock Update section under the headline "Breakout With Triple Average Volume Triggers Fresh Buy Signal" on January 4, 2010 it had gapped up and triggered a technical buy signal as it blasted above its latest pivot point. However, it failed to follow through with additional gains, then losses with above average volume negated its breakout and led to a close back in its prior base, raising concerns.
ARST needs more time to potentially form a new sound base, meanwhile its weak action and deteriorating market conditions (the M criteria) suggest that investors be especially cautious. The high-ranked Computer Software - Security firm has continued putting up solid sales revenues and earnings results since first featured in yellow at $19.91 in the 9/01/09 mid-day report with an annotated daily graph (read here).
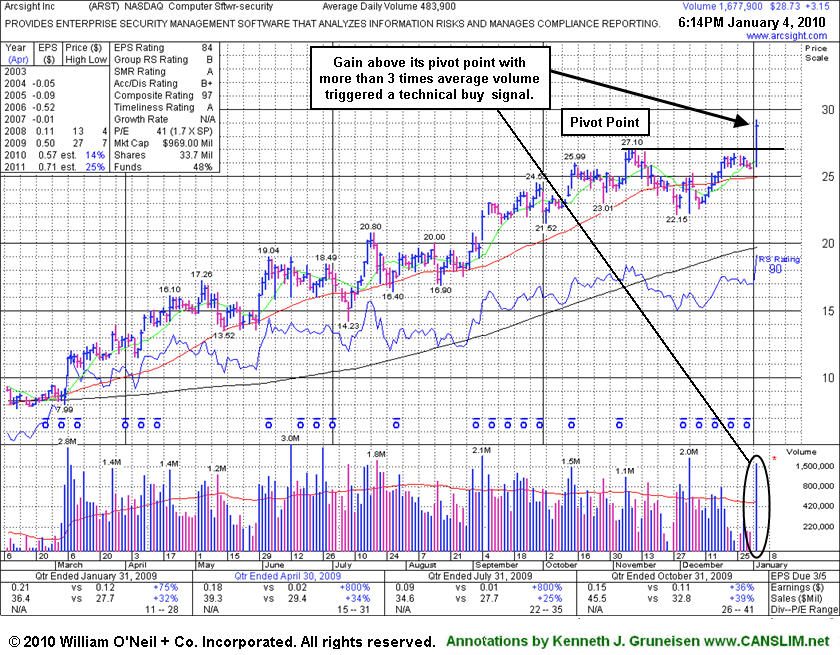
ArcSight, Inc. (ARST +$3.15 or +12.31% to $28.73) gapped up today and triggered a technical buy signal as it blasted above its latest pivot point. It quickly rallied on above its "max buy" level to new all-time highs with volume on the session more than 3 times average behind its considerable gain. Its color code was changed to green as it soon got extended from its latest 8 week base. Its recent rebound above its 50-day moving average (DMA) line was noted as it helped its outlook improve. Patience had allowed for it to form a sufficient new bullish base pattern, however the consolidation on the right side did not constitute a proper downward sloping "handle" for an ideal cup-with-handle pattern. Normally stocks are expected to correct by about -10-15% as the handle forms. Its powerful breakout on volume was an undeniable sign of institutional buying demand, nonetheless, even without a more recent shakeout. Prior chart highs in the $27 area are now an important support level, while any technical deterioration back into its latest base would raise concerns.
While ARST was considered a "late-stage" breakout possibility when first featured, it continued putting up solid sales revenues and earnings results since first featured in yellow at $19.91 in the 9/01/09 mid-day report with an annotated daily graph (read here).
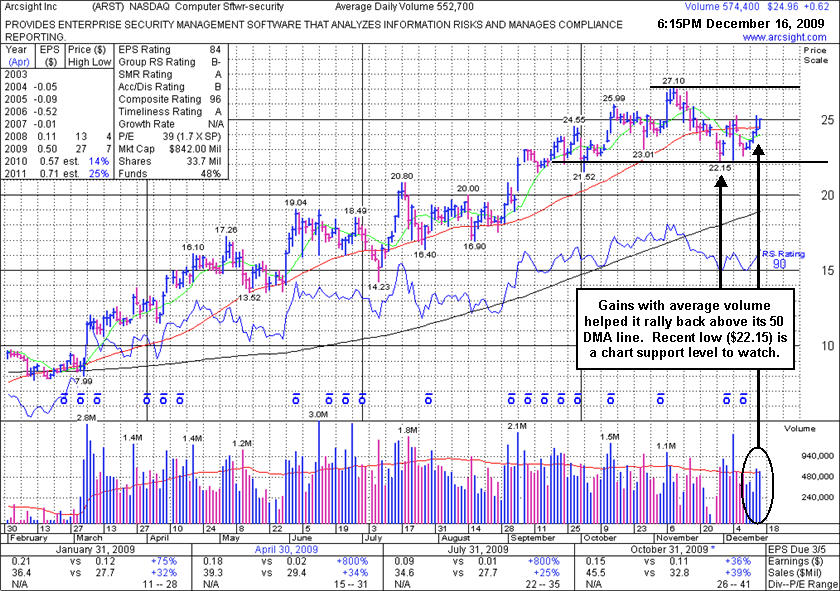
ArcSight, Inc. (ARST +$0.62 or -2.08% to $24.96) posted a 5th consecutive gain today on near average volume which helped it close above its 50-day moving average (DMA) line and helped it outlook. However, its current consolidation is not considered a new sound base. Patience may allow for it to form a new cup-with-handle or other bullish base pattern in due time. Meanwhile, deterioration below its recent chart lows ($22.15) would raise more serious concerns and trigger technical sell signals. Concerns were raised when it recently traded below its 50-day moving average (DMA) line. The 50 DMA line is always an important technical support level to watch on pullbacks. In this case, concerns were also raised when it undercut a prior chart low ($23.01), the next technical support.
It has shown resilience again this week after recently noted technical sell signals. However, keep in mind that ARST was considered a "late-stage" breakout possibility when featured after it had already made a considerable 5-fold rally from its November '08 low. ARST was first featured in yellow at $19.91 in the 9/01/09 mid-day report with an annotated daily graph (read here) and it was also featured with more detailed analysis in the September 2009 CANSLIM.net News with an annotated weekly graph (read here).
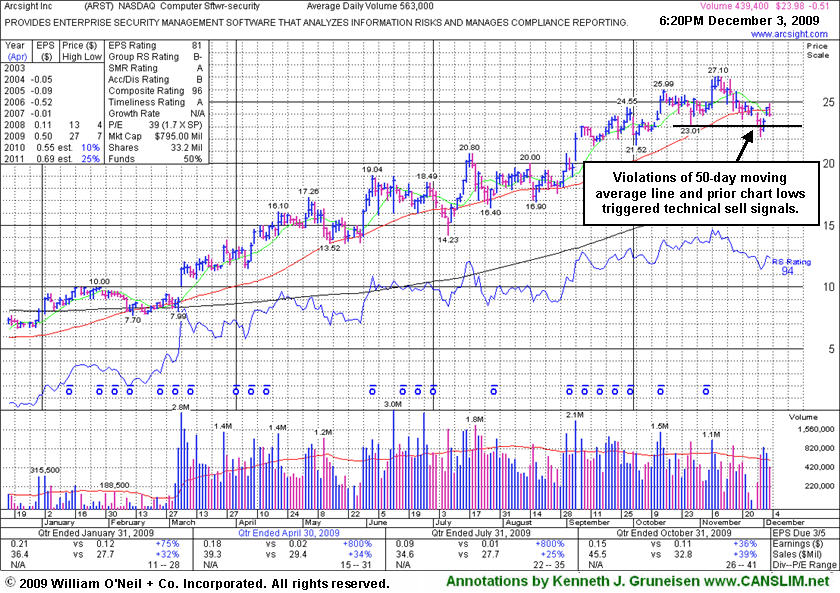
ArcSight, Inc. (ARST -$0.51 or -2.08% to $23.98) gapped up today but then negatively reversed and closed with a loss on light volume below its 50-day moving average (DMA) line. The 50 DMA line is always an important technical support level to watch on pullbacks. In this case, concerns were also raised when it undercut a prior chart low, the next technical support. It has shown resilience this week after recently noted technical sell signals, however the 50 DMA appears to now be acting as a resistance level.
Keep in mind that ARST was considered a "late-stage" breakout possibility when featured after it had already made a considerable 5-fold rally from its November '08 low. ARST was first featured in yellow at $19.91 in the 9/01/09 mid-day report with an annotated daily graph (read here) and it was also featured with more detailed analysis in the September 2009 CANSLIM.net News with an annotated weekly graph (read here).
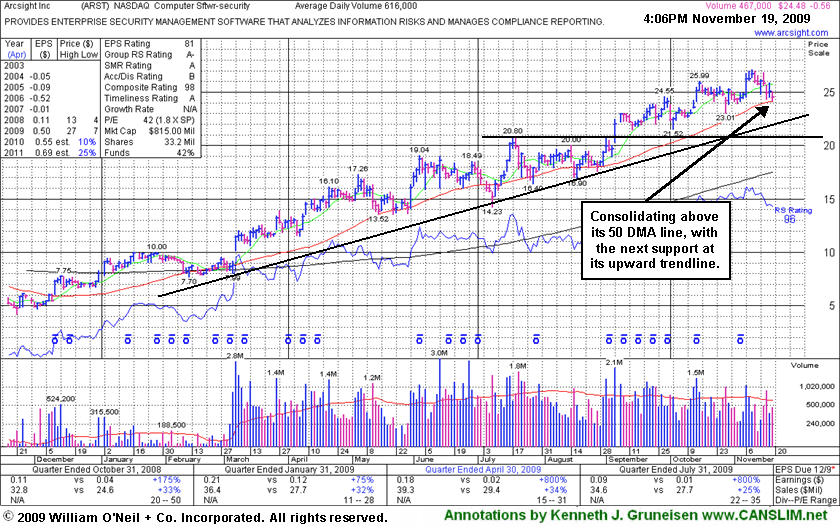
ArcSight, Inc. (ARST -$0.56 or -2.24% to $24.48) is consolidating above its 50-day moving average (DMA) line. Its color code remained green while we dismissed its 10/15/09 high ($25.99) as a new pivot point, with concern that it is now a later stage breakout without a recent base of substantial length. It has produced only one gain backed by above average volume in 5 weeks, however ARST stubbornly held its ground and it has encountered very little distributional pressure since its 9/04/09 breakout. The 50 DMA line is always an important technical support level to watch on pullbacks. In this case, the next technical support would be the upward trendline connecting its chart lows since March.
Keep in mind that ARST was considered a "late-stage" breakout possibility when featured after it had already made a considerable 5-fold rally from its November '08 low. ARST was first featured in yellow at $19.91 in the 9/01/09 mid-day report with an annotated daily graph (read here) and it was also featured with more detailed analysis in the September 2009 CANSLIM.net News with an annotated weekly graph (read here).
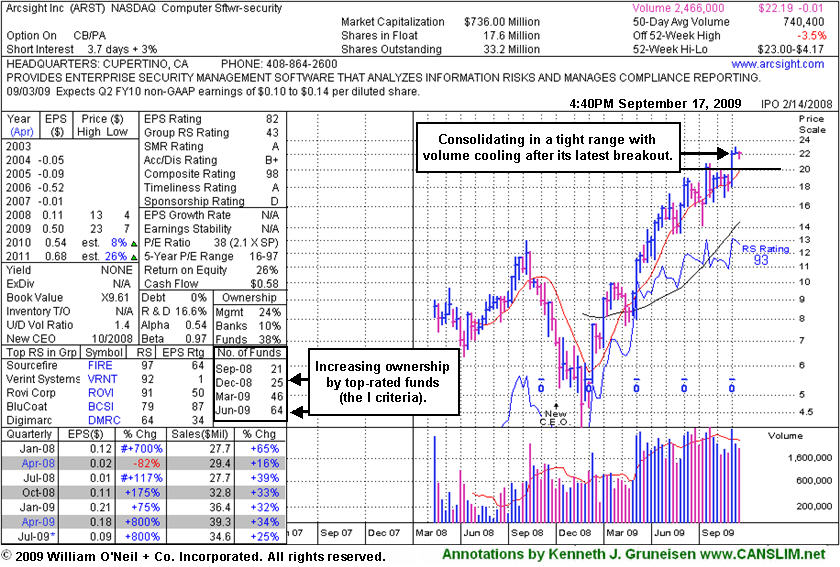
ArcSight, Inc. (ARST +$1.43 or +5.77% to $26.23) rallied today with above average volume to a new all-time high from a short consolidation in a very tight trading range above its 50-day moving average (DMA) line. Its color code remains green while dismissing its 10/15/09 high as a new pivot point, with concern that it is now a later stage breakout without a recent base of substantial length. ARST stubbornly held its ground and it has encountered very little distributional pressure since its 9/04/09 breakout. Its 50 DMA line is an important technical support level to watch on pullbacks.
Keep in mind that ARST was considered a "late-stage" breakout possibility when featured after it had already made a considerable 5-fold rally from its November '08 low. ARST was first featured in yellow at $19.91 in the 9/01/09 mid-day report with an annotated daily graph (read here) and it was also featured with more detailed analysis in the September 2009 CANSLIM.net News with an annotated weekly graph (read here).
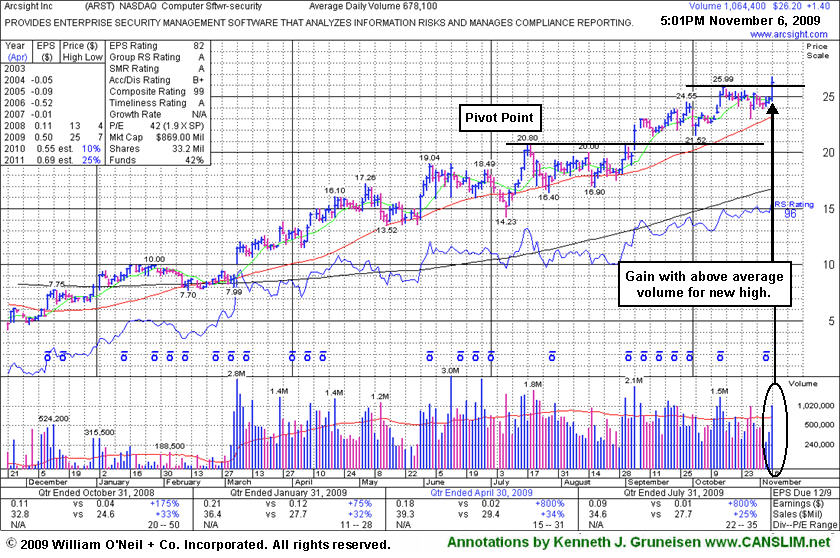
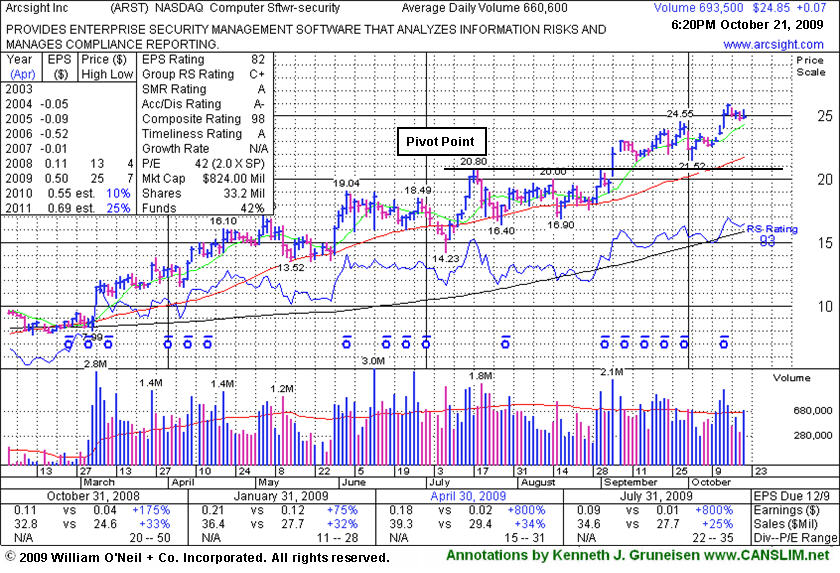
ArcSight, Inc. (ARST +$0.07 or +0.28% to $24.85) has stubbornly held its ground near all-time highs since last week's gains on above average volume. It is now too extended from its prior base to be buyable under the guidelines of the investment system. It has encountered very little distributional pressure since its 9/04/09 breakout, and yet it offered disciplined investors opportunities to accumulate shares without chasing it more than 5% above its pivot point. It had done so when its positive reversal prompted its last appearance in this FSU section on 10/02/09 under the headline "Positive Reversal After Intra-Day Pullback Under Max Buy Level." Its 10/02/09 low ($21.52) closely coincides now with its 50-day moving average (DMA) line, making that a very important technical support level to watch on pullbacks.
Keep in mind that ARST was considered a "late-stage" breakout possibility when featured after it had already made a considerable 5-fold rally from its November '08 low. ARST was first featured in yellow at $19.91 in the 9/01/09 mid-day report with an annotated daily graph (read here) and it was also featured with more detailed analysis in the September 2009 CANSLIM.net News with an annotated weekly graph (read here).
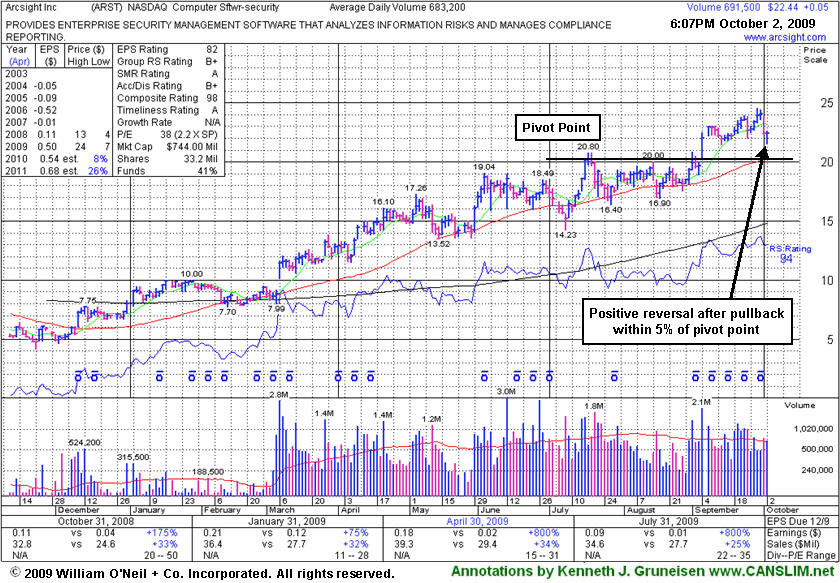
ArcSight, Inc. (ARST +$0.05 or +0.22% to $22.44) positively reversed after early losses led to a brief intra-day dip under its previously cited "max buy" level. It has stubbornly held its ground near all-time highs after a consideable 5-fold rally from its November '08 low. It also has encountered very little distributional pressure since its latest breakout, and since its last appearance in this FSU section on 9/17/09 under the headline, "Healthy Post-Breakout Action".
Prior chart highs and its 50-day moving average (DMA) line closely coincide now as a very important support level to watch on pullbacks. Deterioration back into its prior base and under the 50 DMA line would raise concerns and trigger technical sell signals. Remember, disciplined investors avoid chasing stocks more than +5% above their pivot point, and always limit losses by selling whenever any stock falls 7-8% from their buy price. ARST was first featured in yellow at $19.91 in the 9/01/09 mid-day report with an annotated daily graph (read here) and it was also featured with more detailed analysis in the September 2009 CANSLIM.net News with an annotated weekly graph (read here).
A classic example of the success enjoyed by many CANSLIM.net readers usually starts when an investor reads a CANSLIM.net report and buys a featured stock before it has risen above the pivot point by greater than 5%. After a stock breaks out above its pivot point, there is only a +5% window that investors have to purchase the stock under the proper guidelines. Once a stock rises above the "maximum buy price" the risk of a shake out balloons, meaning that even a normal retracement in the stock might force you to employ the 7-8% loss cutting rule. Much can be told by the stock's daily action in the weeks and months that follow a breakout. Typically, a light volume and orderly pullback suggests that the bulls remain in control. However, high volume pullbacks that violate support paint a totally different picture.
ArcSight, Inc. (ARST -$0.02 or -0.09% to $22.19) is hovering in a tight trading range, and with volume totals drying up it has stubbornly held its ground near all-time highs after a consideable 5-fold rally from its November '08 low. The weekly chart below shows it forming what may be considered a "3-weeks tight" pattern by some if it completes this week in close proximity to the 2 prior weekly closes. However a "3-weeks tight" pattern is an advanced type of chart pattern that typically follows a substantial run up percentage-wise of +70-100% or more in the prior 9-16 weeks. ARST has advanced, but it has not run up that considerably in the recent time span. It also has not encountered any distributional pressure since its latest breakout was shown in this FSU section with an annotated daily graph under the headline "Gap Up Gain Follows Quarterly Report For Computer Software Firm" after it gapped up on 9/04/09 and hit a new all-time high with a considerable gain on heavy volume. Volume was nearly 3 times its average daily volume as it blasted above its pivot point, triggering a technical buy signal.
Prior chart highs are now an important support level to watch on pullbacks, and any deterioration back into its prior base would raise concerns. Remember, disciplined investors avoid chasing stocks more than +5% above their pivot point, and always limit losses by selling whenever any stock falls 7-8% from their buy price. ARST was first featured in yellow at $19.91 in the 9/01/09 mid-day report with an annotated daily graph (read here) and it was also featured with more detailed analysis in the September 2009 CANSLIM.net News with an annotated weekly graph (read here).
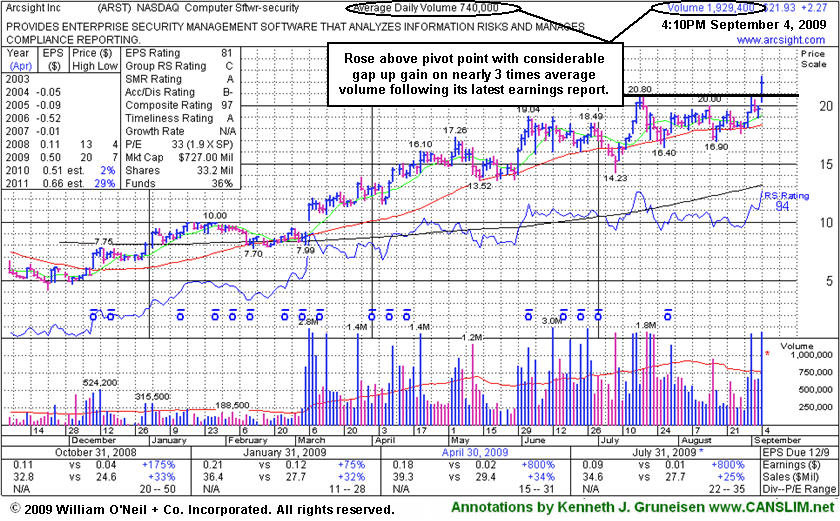
ArcSight, Inc. (ARST +$2.31 or +10.51% to $21.97) gapped up today and hit a new all-time high with a considerable gain on heavy volume after reporting results for the quarter ended July 31, 2009. Volume was nearly 3 times its average daily volume as it blasted above its pivot point, triggering a technical buy signal. Prior chart highs are now an important support level to watch on pullbacks, and any deterioration back into its prior base would raise concerns. Disciplined investors avoid chasing stocks more than +5% above their pivot point, and the window of time to take action within the investment system's guidelines can sometimes be brief. It should be noted that the stock ended the week near its previously cited "max buy" level. ARST was featured in yellow in the 9/01/09 mid-day report with an annotated daily graph (read here) and it was also featured with more detailed analysis in the September 2009 CANSLIM.net News with an annotated weekly graph (read here).
| Arcsight Inc. |
| |
|
Ticker Symbol: ARST (NASDAQ) |
Industry Group: Computer Software-Security |
Shares Outstanding: 33,200,000 |
|
Price: $19.91 8//01/09 12:02PM |
Day's Volume: 638,500 9/01/09 12:02PM |
Shares in Float: 17,600,000 |
|
52 Week High: $20.80 7/20/2009 |
50-Day Average Volume: 743,900 |
Up/Down Volume Ratio: 1.3 |
|
Pivot Point: $20.90 7/20/09 high plus .10 |
Pivot Point +5% = Max Buy Price: $21.95 |
Web Address: http://www.arcsight.com |
graph below is as of 8/31/09 close
CANSLIM.net Profile: ArcSight, Inc. provides compliance and security management solutions that protect enterprises and government agencies. It markets and sells its software directly, as well as through value added resellers and systems integrators. The company was formerly known as Wahoo Technologies, Inc. and changed its name to ArcSight, Inc. in March 2001. ArcSight, Inc. was founded in 2000 and is headquartered in Cupertino, California. It hails from the Computer Software - Security group which is presently ranked 102nd on the 197 Industry Groups list, which does not place it in the top quartile of industry groups. However, there are several other strong software stocks that are performing very well, which helps satisfy the L criteria. There were 21 top-rated funds with an ownership interest in September '08, yet that number jumped to 61 as of June '09, offering a very strong sign of increasing institutional interest (I criteria). Also, the stock has less than 20 million shares in the float, and having a small supply of shares (the S criteria) is a characteristic that most of the greatest stock market winners exhibited before they enjoyed explosive moves up. Its annual earnings growth history has been good, although there is some concern over the fact that Street estimates for FY '10 are not especially strong. Quarterly sales and earnings increases in the 4 latest quarterly comparisons were well above the +25% guideline needed to satisfy the C criteria. Return On Equity stands at +26%, which is above the +17% guideline.
What to Look For and What to Look Out For: Disciplined investors will look for the stock to first confirm a new technical buy signal by breaking out and closing above its $20.90 pivot point with gains on heavy volume in the coming days and weeks. Remember that buyable breakouts require three important components: the stock must clear its pivot point with considerable gains, those gains must be backed by at least +50% above average volume, and the overall market environment must improve and produce a new batch of leadership. As always, it is of the utmost importance to sell a stock if it drops 7-8% below your purchase price. Watch its 50-day moving average (DMA) line and recent lows in the $16 area as important chart support levels where any violations would raise concerns and trigger technical sell signals. The small supply of outstanding shares could lead to dramatic price volatility, especially if the institutional crowd rushes in or out. The market conditions are healthy as long as the current rally remains intact which makes it an ideal environment conducive for accumulating shares. This high-ranked leader should remain on an active watchlist and could be considered as a new buy candidate in the event it closes above its pivot point on the necessary volume needed to trigger a technical buy signal.
Technical Analysis: ARST has spent the past six weeks building a flat base while consolidating in a very tight range above its 50 DMA which is considered a healthy sign. The stock is now trading very near its pivot point. There have been only mild signs of institutional selling (distribution) in recent weeks. It found great support near its 50 DMA line during this year's impressive ascent while it rose almost 5-fold from its November '08 low. It could be capable of continuing much higher, but before new buying efforts are justified within the investment system guidelines remember that it is imperative to see volume surpass the necessary threshold needed to trigger a new technical buy signal as the stock trades and closes above its pivot point. Until then, this high-ranked stock should remain on an active watchlist while consolidating this year's big gains.