Healthy Post-Breakout Action
Thursday, September 17, 2009 CANSLIM.net

A classic example of the success enjoyed by many CANSLIM.net readers usually starts when an investor reads a CANSLIM.net report and buys a featured stock before it has risen above the pivot point by greater than 5%. After a stock breaks out above its pivot point, there is only a +5% window that investors have to purchase the stock under the proper guidelines. Once a stock rises above the "maximum buy price" the risk of a shake out balloons, meaning that even a normal retracement in the stock might force you to employ the 7-8% loss cutting rule. Much can be told by the stock's daily action in the weeks and months that follow a breakout. Typically, a light volume and orderly pullback suggests that the bulls remain in control. However, high volume pullbacks that violate support paint a totally different picture.
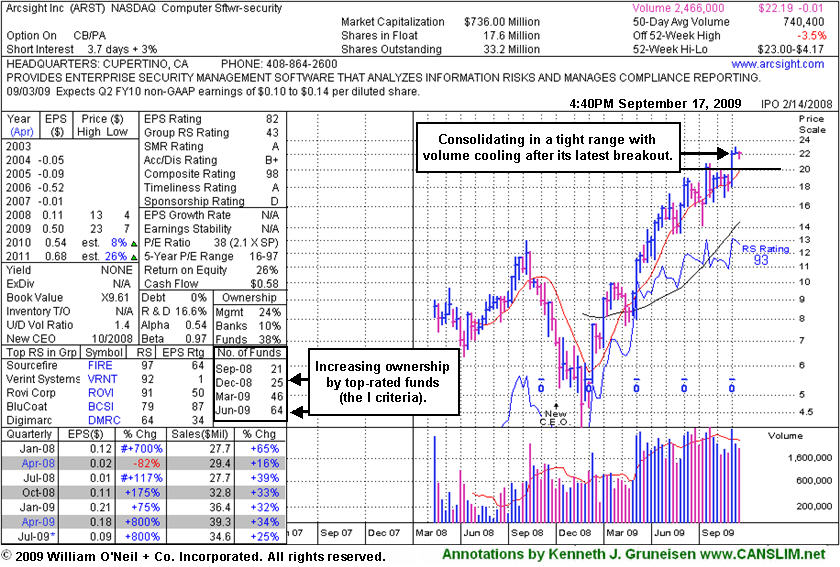
ArcSight, Inc. (ARST -$0.02 or -0.09% to $22.19) is hovering in a tight trading range, and with volume totals drying up it has stubbornly held its ground near all-time highs after a consideable 5-fold rally from its November '08 low. The weekly chart below shows it forming what may be considered a "3-weeks tight" pattern by some if it completes this week in close proximity to the 2 prior weekly closes. However a "3-weeks tight" pattern is an advanced type of chart pattern that typically follows a substantial run up percentage-wise of +70-100% or more in the prior 9-16 weeks. ARST has advanced, but it has not run up that considerably in the recent time span. It also has not encountered any distributional pressure since its latest breakout was shown in this FSU section with an annotated daily graph under the headline "Gap Up Gain Follows Quarterly Report For Computer Software Firm" after it gapped up on 9/04/09 and hit a new all-time high with a considerable gain on heavy volume. Volume was nearly 3 times its average daily volume as it blasted above its pivot point, triggering a technical buy signal.
Prior chart highs are now an important support level to watch on pullbacks, and any deterioration back into its prior base would raise concerns. Remember, disciplined investors avoid chasing stocks more than +5% above their pivot point, and always limit losses by selling whenever any stock falls 7-8% from their buy price. ARST was first featured in yellow at $19.91 in the 9/01/09 mid-day report with an annotated daily graph (read here) and it was also featured with more detailed analysis in the September 2009 CANSLIM.net News with an annotated weekly graph (read here).

 Get
a Free 14 Day All Access Trial
Get
a Free 14 Day All Access Trial