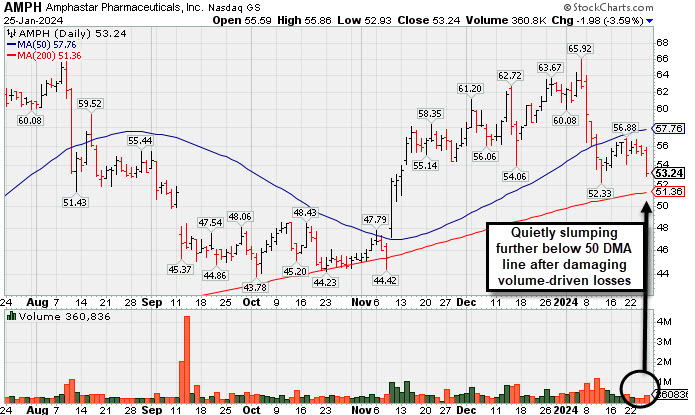
Quietly Sinking Toward 200-Day Moving Average Line - Thursday, January 25, 2024
Amphastar Pharm (AMPH -$1.98 or -3.59% to $53.24) fell further below its 50-day moving average (DMA) line toward its 200 DMA line. After damaging volume-driven losses, a rebound above the 50 DMA line ($57.76) is needed for its outlook to improve. Fundamentals remain strong.
AMPH was highlighted in yellow in the 12/04/23 mid-day report (read here) with pivot point cited based on its 11/21/23 high after a cup-with-handle base. It was last covered in great detailon 12/21/23 with an annotated graph under the headline "Consolidating Above Pivot Point With Volume Cooling".
AMPH has a highest possible 99 Earnings Per Share Rating, well above the 80+ minimum guideline for buy candidates. The 4 latest quarterly comparisons through Sep '23 have been well above the +25% minimum earnings guideline (C criteria). Annual earnings history (A criteria) has been strong. It hails from the Medical-Biomed/Biotech group which is currently ranked 3rd on the 197 Industry Groups list (L criteria).
The number of top-rated funds owning its shares reportedly rose from 435 in Mar '23 to 470 in Sep '23, a reassuring sign concerning the I criteria. Its current Up/Down Volume Ratio of 1.1 is an unbiased indication its shares have been under slight accumulation over the past 50 days.
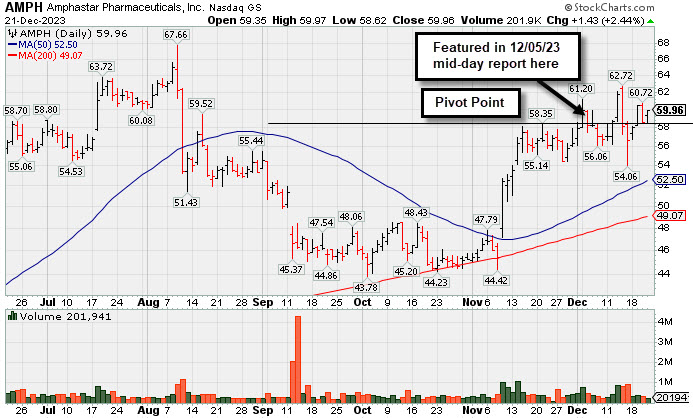
Consolidating Above Pivot Point With Volume Cooling - Thursday, December 21, 2023
Amphastar Pharm (AMPH +$1.43 or +2.44% to $59.96) posted a small gain today. Volume totals have been cooling while consolidating. It is above the pivot point cited based on its 11/21/23 high after a cup-with-handle base. Little resistance remains due to overhead supply. Fundamentals remain strong.
AMPH was highlighted in yellow in the 12/04/23 mid-day report (read here) with pivot point cited based on its 11/21/23 high after a cup-with-handle base. It was coverned in greater detail that evening with an annotated graph under the headline "Amphastar Pharm on Track for 7th Weekly Gain". The gain and strong close above the pivot point backed by +100% above average volume triggered a technical buy signal. Since then it has made choppy progress toward its August all-time high.
Fundamentals remain strong after it reported Sep '23 quarterly earnings +203% on +50% sales revenues versus the year-ago period. It has a 99 Earnings Per Share Rating, well above the 80+ minimum guideline for buy candidates. The 4 latest quarterly comparisons through Sep '23 have been well above the +25% minimum earnings guideline (C criteria). Annual earnings history (A criteria) has been strong. It hails from the Medical-Biomed/Biotech group which is currently ranked 31st on the 197 Industry Groups list (L criteria).
The number of top-rated funds owning its shares reportedly rose from 435 in Mar '23 to 465 in Sep '23, a reassuring sign concerning the I criteria. Its current Up/Down Volume Ratio of 1.5 is an unbiased indication its shares have been under accumulation over the past 50 days.
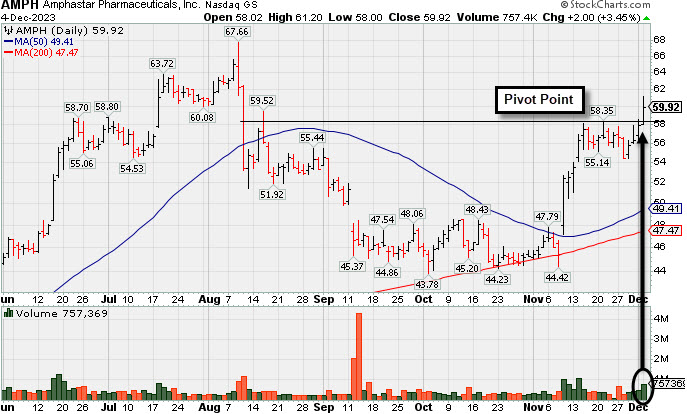
Amphastar Pharm on Track for 7th Weekly Gain - Monday, December 4, 2023
Amphastar Pharm (AMPH +$2.00 or +3.45% to $59.92) was highlighted in yellow in the earlier mid-day report (read here) with pivot point cited based on its 11/21/23 high after a cup-with-handle base. It is rebounding toward its August all-time high, and little resistance remains due to overhead supply. Today's gain and strong close above the pivot point backed by +100% above average volume triggered a technical buy signal.
Fundamentals remain strong after it reported Sep '23 quarterly earnings +203% on +50% sales revenues versus the year-ago period. It was last coverned in greater detail on 8/22/23 with an annotated graph under the headline "Rebound Above 50-Day Moving Average Needed for Outlook to Improve". AMPH found support at its 200 DMA line during its consolidation after dropped from the Featured Stocks list on 9/08/23.
It hails from the Medical-Biomed/Biotech group which is currently ranked 91st on the 197 Industry Groups list (L criteria). It has a 99 Earnings Per Share Rating, well above the 80+ minimum guideline for buy candidates. The 4 latest quarterly comparisons through Sep '23 have been well above the +25% minimum earnings guideline (C criteria). Annual earnings history (A criteria) has been strong.
The number of top-rated funds owning its shares reportedly rose from 435 in Mar '23 to 468 in Sep '23, a reassuring sign concerning the I criteria. Its current Up/Down Volume Ratio of 1.6 is an unbiased indication its shares have been under accumulation over the past 50 days.
Rebound Above 50-Day Moving Average Needed for Outlook to Improve - Tuesday, August 22, 2023
Amphastar Pharm (AMPH +$0.01 or +0.02% to $53.49) has recently sputtered below its 50-day-moving average (DMA) line ($57.23) which is acting as resistance after damaging volume-driven losses. A rebound above that important short-term average is needed for its outlook to improve. Fundamentals remain strong after it reported Jun '23 quarterly earnings +67% on +18% sales revenues versus the year-ago period.AMPH was highlighted in yellow with pivot point cited based on its 4/24/23 high in the 5/15/23 mid-day report (read here). It was last coverned in greater detail on 7/20/23 with an annotated graph under the headline "6th Straight Gain for Amphastar".
It hails from the Medical-Biomed/Biotech group which is currently ranked 59th on the 197 Industry Groyups list (L cvriteria). It has a 99 Earnings Per Share Rating, well above the 80+ minimum guideline for buy candidates. The 3 latest quarterly comparisons has been well above the +25% minimum earnings guideline (C criteria). Annual earnings history (A criteria) has been strong.
The number of top-rated funds owning its shares reportedly rose from 435 in Mar '23 to 441 in Jun '23, a somewhat reassuring sign concerning the I criteria. Its current Up/Down Volume Ratio of 1.3, is an unbiased indication its shares have been under accumulation over the past 50 days.
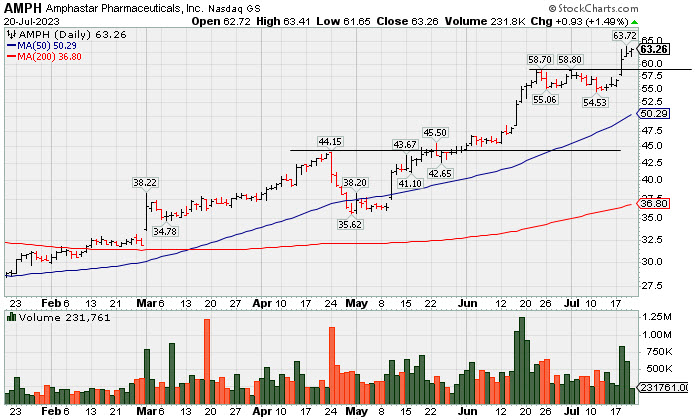
6th Straight Gain for Amphastar - Thursday, July 20, 2023
Amphastar Pharm (AMPH +$0.92 or +1.48% to $63.25) is perched at its all-time high today following 6 consecutive gains. It is extended from any sound base of sufficient length. Its 50-day moving average (DMA) line ($50.28) defines important support to watch above prior highs in the $44 area. Fundamentals remain strong.
AMPH was highlighted in yellow with pivot point cited based on its 4/24/23 high in the 5/15/23 mid-day report (read here). It was last coverned in greater detail on 6/20/23 with an annotated graph under then headline "Hit Another New High With 4th Consecutive Volume-Driven Gain".
It hails from the Medical-Biomed/Biotech group which is currently ranked 59th on the 197 Industry Groyups list (L cvriteria). It has a 99 Earnings Per Share Rating, well above the 80+ minimum guideline for buy candidates. Three of the 4 latest quarterly comparisons through Mar '23 versus the year-ago periods have been strong and well above the +25% minimum earnings guideline (C criteria). Annual earnings history (A criteria) has been strong.
The number of top-rated funds owning its shares reported fell from 454 in Jun '22 to 429 in Jun '23, not a reassuring sign concerning the I criteria. Its current Up/Down Volume Ratio of 2.5, however, is an unbiased indication its shares have been under accumulation over the past 50 days.
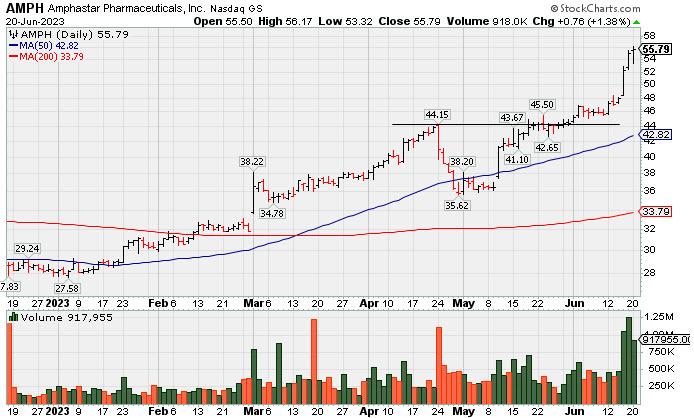
Hit Another New High With 4th Consecutive Volume-Driven Gain - Tuesday, June 20, 2023
Amphastar Pharm (AMPH +$0.76 or +1.38% to $55.79) hit yet another new high with today's 4th consecutive gain backed by above average volume, getting very extended from any sound base. Prior highs in the $44 area define initial support to watch above its 50-day moving average (DMA) line ($42.82) on pullbacks. Fundamentals remain strong.
AMPH was highlighted in yellow with pivot point cited based on its 4/24/23 high in the 5/15/23 mid-day report (read here) and it was coverned in greater detail that evening with an annotated graph under then headline "Weak Finish After Early Gain When Perched Near All-Time High". It slumped below its 50 DMA line with a streak of volume-driven losses but then halted its slide. A gap up and considerable volume-driven gain on 5/10/23 helped its outlook improve, then additional volume-driven gains repaired all technical damage and boosted it into new high territory.
It hails from the Medical-Biomed/Biotech group which is currently ranked 15th on the 197 Industry Groyups list (L cvriteria). It has a 99 Earnings Per Share Rating, well above the 80+ minimum guideline for buy candidates. Three of the 4 latest quarterly comparisons through Mar '23 versus the year-ago periods have been strong and well above the +25% minimum earnings guideline (C criteria). Annual earnings history (A criteria) has been strong.
The number of top-rated funds owning its shares reported fell from 454 in Jun '22 to 435 in Mar '23, not a reassuring sign concerning the I criteria. Its current Up/Down Volume Ratio of 1.6, however, is an unbiased indication its shares have been under accumulation over the past 50 days.
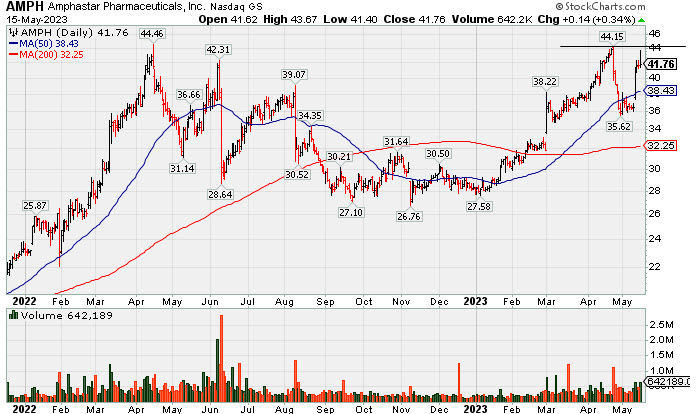
Weak Finish After Early Gain When Perched Near All-Time High - Monday, May 15, 2023
Amphastar Pharm (AMPH +$0.14 or +0.34% to $41.76) finished near the session low after an early gain. It was highlighted in yellow with pivot point cited based on its 4/24/23 high in the earlier mid-day report (read here). It rebounded near its 52-week and all-time highs with today's gain backed by +61% above average volume. Subsequent gains and a strong close above the pivot point backed by at least +40% above average volume may clinch a technical buy signal. Disciplined investors know to be patient and watch for proof of fresh institutional buying demand that can lead to a sustained and meaningful advance in price.
It hails from the Medical-Biomed/Biotech group which is currently ranked 12th on the 197 Industry Groyups list (L cvriteria). It has a 99 Earnings Per Share Rating, well above the 80+ minimum guideline for buy candidates. Three of the 4 latest quarterly comparisons through Mar '23 versus the year-ago periods have been strong and well above the +25% minimum earnings guideline (C criteria). Annual earnings history (A criteria) has been strong.
It hails from the Medical-Biomed/Biotech group which is currently ranked 12th on the 197 Industry Groyups list (L cvriteria). It has a 99 Earnings Per Share Rating, well above the 80+ minimum guideline for buy candidates. Three of the 4 latest quarterly comparisons through Mar '23 versus the year-ago periods have been strong and well above the +25% minimum earnings guideline (C criteria). Annual earnings history (A criteria) has been strong.
The number of top-rated funds owning its shares reported fell from 454 in Jun '22 to 430 in Mar '23, not a reassuring sign concerning the I criteria. Its current Up/Down Volume Ratio of 0.9 is an unbiased indication its shares have been under slight distributional pressure over the past 50 days.