You are not logged in.
This means you
CAN ONLY VIEW reports that were published prior to Monday, April 14, 2025.
You
MUST UPGRADE YOUR MEMBERSHIP if you want to see any current reports.
AFTER MARKET UPDATE - TUESDAY, DECEMBER 30TH, 2014
Previous After Market Report Next After Market Report >>>
|
|
|
|
DOW |
-55.16 |
17,983.07 |
-0.31% |
|
Volume |
525,688,780 |
-2% |
|
Volume |
1,174,319,980 |
+3% |
|
NASDAQ |
-29.47 |
4,777.44 |
-0.61% |
|
Advancers |
1,278 |
40% |
|
Advancers |
1,039 |
36% |
|
S&P 500 |
-10.22 |
2,080.35 |
-0.49% |
|
Decliners |
1,815 |
57% |
|
Decliners |
1,758 |
60% |
|
Russell 2000 |
-6.05 |
1,213.05 |
-0.50% |
|
52 Wk Highs |
129 |
|
|
52 Wk Highs |
108 |
|
|
S&P 600 |
-2.58 |
700.08 |
-0.37% |
|
52 Wk Lows |
43 |
|
|
52 Wk Lows |
40 |
|
|
 |
Major Indices Fell With Below Average Volume Totals
Kenneth J. Gruneisen - Passed the CAN SLIM® Master's Exam
Stocks declined on Tuesday. The Dow Jones Industrial Average lost 55 points to 17,983. The S&P 500 fell 10 points to 2,080. The NASDAQ finished 29 points lower to 4,777. The volume totals on the NYSE and on the Nasdaq exchange were near Monday's light totals. Breadth was negative as decliners led advancers by a 3-2 margin on the NYSE and on the Nasdaq exchange. Leadership contracted as there were 51 high-ranked companies from the CANSLIM.net Leaders List that made new 52-week highs and appeared on the CANSLIM.net BreakOuts Page, down from the prior session total of 85 stocks. New 52-week highs contracted but still outnumbered new 52-week lows on the NYSE and on the Nasdaq exchange. There were losses for all of the 10 high-ranked companies currently on the Featured Stocks Page, a list that has recently been getting trimmed.
New highs for the Dow Jones Industrial Average and S&P 500 Index coupled with healthy leadership signaled that the market (M criteria) is in a confirmed uptrend. Remember that new buying efforts should only be made in stocks meeting all fundamental and technical guidelines of the fact-based investment system!
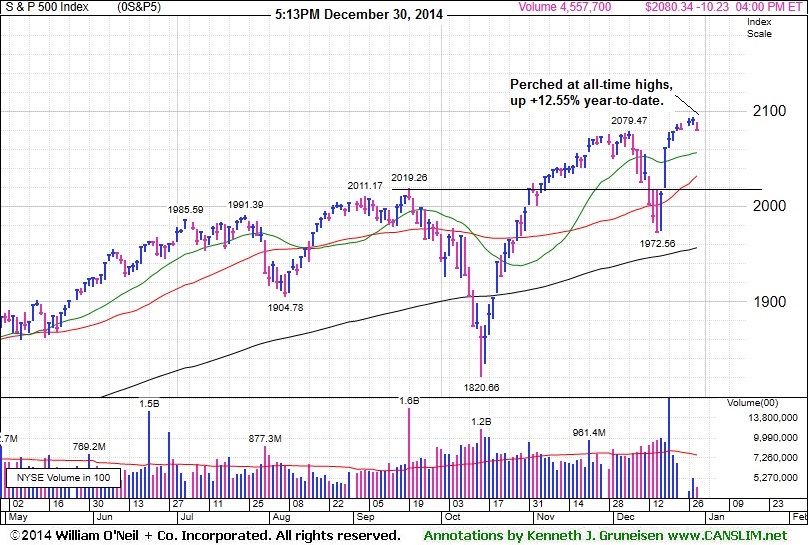
PICTURED: The S&P 500 Index is perched at its all-time high, up +12.55% year-to-date.
The major averages retreated as year-end profit taking made the scene amid global uncertainty. In Greece, Prime Minister Antonis Samaras failed to gather coalition support for his presidential candidate, inching the country closer to a snap-election. Additionally, a measure of consumer confidence rose in December, but failed to meet analyst projections.
At the close, all 10 sectors in the S&P 500 were in negative territory. Utilities fell the most after a recent rally. Duke Energy (DUK -2.5%) and NextEra Energy (NEE -2.4%) fell. In tech stocks, Apple (AAPL -1.2%) was lower after receiving a patent for a new stylus pen. Financials were off the least, buoyed by JP Morgan Chase & Co (JPM +0.3%).
NYSE trading in S&P 500 companies was nearly 42% below the 10-day average. Treasuries climbed, but finished off of earlier highs. The benchmark 10-year note advanced 5/32 to yield 2.19%. Commodities were mixed. On the NYMEX, WTI crude erased earlier losses to gain +0.2% to $53.70/barrel while natural gas fell -3% to $3.10/BTU. COMEX gold finished higher by +1.4% to $1,198.60/ounce.
Disciplined investors know that new buying efforts should only be made in stocks when all fundamental and technical guidelines are met. This should be done as the stock is breaking out of a sound base pattern. Historic studies have shown that odds are not as favorable for investors when buying stocks on pullbacks.
The Featured Stocks Page shows recent notes and Headline Links directing members to detailed analysis with data-packed graphs annotated by a Certified expert. See the Premium Member Homepage for archives to all prior pay reports published.
|
 Kenneth J. Gruneisen started out as a licensed stockbroker in August 1987, a couple of months prior to the historic stock market crash that took the Dow Jones Industrial Average down -22.6% in a single day. He has published daily fact-based fundamental and technical analysis on high-ranked stocks online for two decades. Through FACTBASEDINVESTING.COM, Kenneth provides educational articles, news, market commentary, and other information regarding proven investment systems that work in good times and bad.
Comments contained in the body of this report are technical opinions only and are not necessarily those of Gruneisen Growth Corp. The material herein has been obtained from sources believed to be reliable and accurate, however, its accuracy and completeness cannot be guaranteed. Our firm, employees, and customers may effect transactions, including transactions contrary to any recommendation herein, or have positions in the securities mentioned herein or options with respect thereto. Any recommendation contained in this report may not be suitable for all investors and it is not to be deemed an offer or solicitation on our part with respect to the purchase or sale of any securities. |
|
 |
Energy, Tech, Retail, and Financial Groups Fell
Kenneth J. Gruneisen - Passed the CAN SLIM® Master's Exam
Energy-related shares fell and the Oil Services Index ($OSX -1.54%) and Integrated Oil Index ($XOI -0.83%) both ended lower on Tuesday. The Biotechnology Index ($BTK -1.23%) led the tech sector's retreat while the Semiconductor Index ($SOX -0.59%) and Networking Index ($NWX -0.42%) each ended the session with smaller losses. The Retail Index ($RLX -0.30%) and financial shares had a slightly negative bias as the Broker/Dealer Index ($XBD -0.38%) and the Bank Index ($BKX -0.16%) both edged lower. The Gold & Silver Index ($XAU +3.57%) was a standout gainer.
Charts courtesy www.stockcharts.com
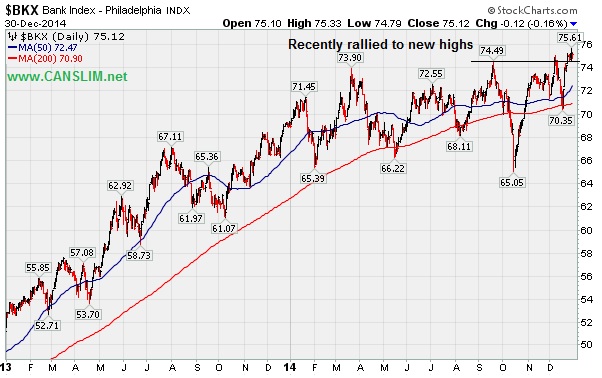
PICTURED: The Bank Index ($BKX -0.16%) recently rallied to new highs. It showed great resilience after an abrupt pullback below its 200-day moving average (DMA) line in October.
| Oil Services |
$OSX |
212.14 |
-3.31 |
-1.54% |
-24.51% |
| Integrated Oil |
$XOI |
1,355.85 |
-11.37 |
-0.83% |
-9.80% |
| Semiconductor |
$SOX |
690.99 |
-4.09 |
-0.59% |
+29.15% |
| Networking |
$NWX |
361.90 |
-1.51 |
-0.42% |
+11.72% |
| Broker/Dealer |
$XBD |
185.73 |
-0.71 |
-0.38% |
+15.68% |
| Retail |
$RLX |
1,031.98 |
-3.11 |
-0.30% |
+9.81% |
| Gold & Silver |
$XAU |
69.06 |
+2.38 |
+3.57% |
-17.93% |
| Bank |
$BKX |
75.12 |
-0.12 |
-0.16% |
+8.46% |
| Biotech |
$BTK |
3,452.33 |
-43.12 |
-1.23% |
+48.14% |
|
|
|
 |
Forming New Base And Fundamentals Remain Favorable
Kenneth J. Gruneisen - Passed the CAN SLIM® Master's Exam
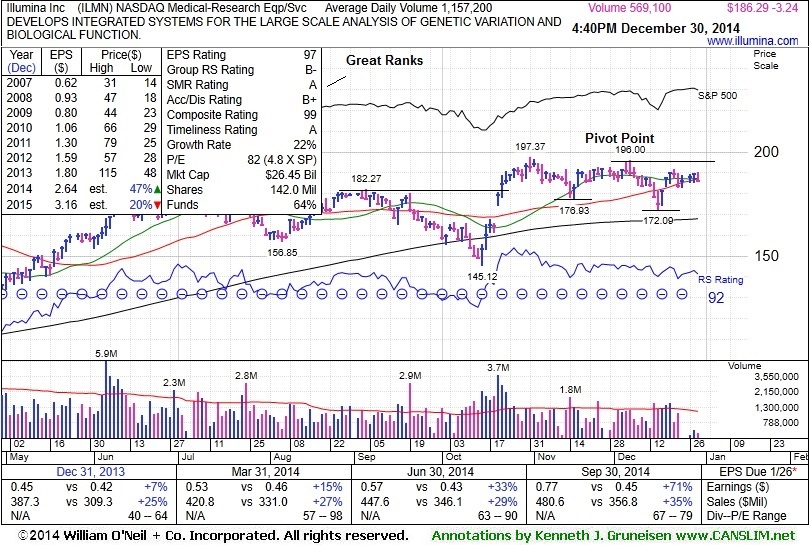
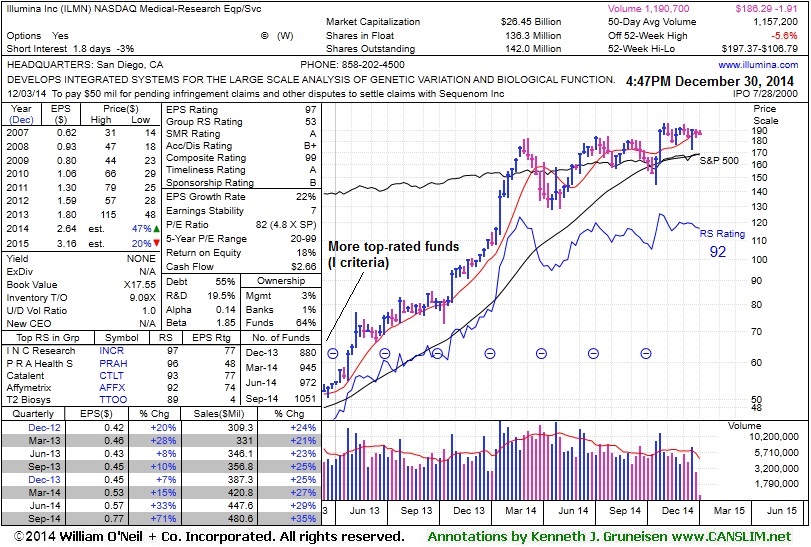
Illumina Inc (ILMN -$3.24 or -1.71% to $186.29) has been finding support near its 50-day moving average (DMA) line ($187.06). It appears to be forming a new "double bottom" base. There is some resistance due to overhead supply up through $197, however its color code was changed to yellow, and a volume-driven gain above the new pivot point cited based on its 12/05/14 high would trigger a new technical buy signal. Disciplined investors avoid chasing stocks more than +5% above their prior highs and always limit losses by selling any stock that falls more than -7% from their purchase price.
This Medical - Research Equipment/Services firm was last shown in this FSU section on 12/15/4 with annotated graphs under the headline, "Violation of 50-Day Average Triggered Technical Sell Signal , It undercut prior highs in the $182 area and triggered technical sell signals. ILMN made limited headway since highlighted in the 10/22/14 mid-day report (read here).
ILMN reported earnings +71% on +35% sales revenues for the Sep '14 quarter, its 2nd consecutive quarterly comparison with earnings above the +25% minimum guideline (C criteria). Sequential quarterly comparisons show encouraging sales revenues and earnings acceleration. Its current Relative Strength (RS) rank of 92 is well above the 80+ minimum guideline for buy candidates. Its annual earnings (A criteria) growth history has improved steadily since a downturn in FY '09. The number of top-rated funds owning its shares rose from 877 in Dec '13 to 1,051 in Sep '14, a reassuring sign concerning the I criteria.
|
|
|
Color Codes Explained :
Y - Better candidates highlighted by our
staff of experts.
G - Previously featured
in past reports as yellow but may no longer be buyable under the
guidelines.
***Last / Change / Volume data in this table is the closing quote data***
Symbol/Exchange
Company Name
Industry Group |
PRICE |
CHANGE
(%Change) |
Day High |
Volume
(% DAV)
(% 50 day avg vol) |
52 Wk Hi
% From Hi |
Featured
Date |
Price
Featured |
Pivot Featured |
|
Max Buy |
ACT
-
NYSE
Actavis plc
Medical-Generic Drugs
|
$259.57
|
-0.65
-0.25% |
$261.67
|
1,261,779
42.00% of 50 DAV
50 DAV is 3,004,000
|
$272.75
-4.83%
|
12/29/2014
|
$260.22
|
PP = $272.85
|
|
MB = $286.49
|
Most Recent Note - 12/29/2014 6:03:30 PM
Y - Color code is changed to yellow with new pivot point cited based on its 11/26/14 high plus 10 cents. Consolidating above support at prior highs and its 50 DMA line. See the latest FSU analysis for more details and new annotated graphs.
>>> FEATURED STOCK ARTICLE : Formed New Base Above Prior Highs and 50-Day Moving Average - 12/29/2014
View all notes |
Set NEW NOTE alert |
CANSLIM.net Company Profile |
SEC
News |
Chart |
Request a new note
C
A N
S L
I M


|
AFSI
-
NASDAQ
Amtrust Financial Svcs
INSURANCE - Property and; Casualty Insurance
|
$54.98
|
-0.60
-1.08% |
$56.14
|
596,773
55.62% of 50 DAV
50 DAV is 1,073,000
|
$59.31
-7.30%
|
10/17/2014
|
$45.24
|
PP = $46.02
|
|
MB = $48.32
|
 Most Recent Note - 12/30/2014 6:01:52 PM
G - Found support near prior highs in the $53 area well above its 50 DMA line. More damaging losses would raise greater concerns.
>>> FEATURED STOCK ARTICLE : Finding Support Near Prior Highs - 12/24/2014
View all notes |
Set NEW NOTE alert |
CANSLIM.net Company Profile |
SEC
News |
Chart |
Request a new note
C
A N
S L
I M
|
ALXN
-
NASDAQ
Alexion Pharmaceuticals
DRUGS - Drug Manufacturers - Other
|
$184.94
|
-3.77
-2.00% |
$188.24
|
678,834
61.94% of 50 DAV
50 DAV is 1,096,000
|
$203.30
-9.03%
|
10/23/2014
|
$184.01
|
PP = $185.53
|
|
MB = $194.81
|
Most Recent Note - 12/30/2014 6:03:33 PM
G - Its 50 DMA line recently acted as resistance, plus it faces resistance due to overhead supply up through $203. The recent low ($176.01 on 12/17/14) defines the next important support level. Disciplined investors limit losses by selling if any stock falls more than -7% from their purchase price.
>>> FEATURED STOCK ARTICLE : Recent 50-Day Moving Average Violation Triggered Sell Signal - 12/17/2014
View all notes |
Set NEW NOTE alert |
CANSLIM.net Company Profile |
SEC
News |
Chart |
Request a new note
C
A N
S L
I M
|
BIDU
-
NASDAQ
Baidu Inc Ads
INTERNET - Internet Information Providers
|
$230.01
|
-0.20
-0.09% |
$231.20
|
1,546,265
47.00% of 50 DAV
50 DAV is 3,290,000
|
$251.99
-8.72%
|
10/30/2014
|
$234.08
|
PP = $231.51
|
|
MB = $243.09
|
Most Recent Note - 12/30/2014 6:05:42 PM
Y - Quietly consolidating near its 50 DMA line. Recent lows in the $217-218 area define important near-term support where subsequent losses would raise more serious concerns.
>>> FEATURED STOCK ARTICLE : Rebound Above 50-Day Moving Average Helped Technical Stance - 12/19/2014
View all notes |
Set NEW NOTE alert |
CANSLIM.net Company Profile |
SEC
News |
Chart |
Request a new note
C
A N
S L
I M
|
EPAM
-
NYSE
Epam Systems Inc
COMPUTER SOFTWARE and SERVICES - Information Technology Service
|
$47.80
|
-0.48
-0.99% |
$48.81
|
210,399
47.93% of 50 DAV
50 DAV is 439,000
|
$52.89
-9.62%
|
10/23/2014
|
$45.21
|
PP = $46.09
|
|
MB = $48.39
|
Most Recent Note - 12/29/2014 6:05:25 PM
G - Still consolidating just above its 50 DMA line. Prior highs in the $46 area acted as support last week. Subsequent losses below recent lows would raise concerns and trigger a more worrisome technical sell signal.
>>> FEATURED STOCK ARTICLE : Violated 50-Day Moving Average Triggering Technical Sell Signal - 12/16/2014
View all notes |
Set NEW NOTE alert |
CANSLIM.net Company Profile |
SEC
News |
Chart |
Request a new note
C
A N
S L
I M
|
Symbol/Exchange
Company Name
Industry Group |
PRICE |
CHANGE
(%Change) |
Day High |
Volume
(% DAV)
(% 50 day avg vol) |
52 Wk Hi
% From Hi |
Featured
Date |
Price
Featured |
Pivot Featured |
|
Max Buy |
FB
-
NASDAQ
Facebook Inc Cl A
INTERNET
|
$79.22
|
-0.80
-1.00% |
$80.59
|
14,355,077
45.37% of 50 DAV
50 DAV is 31,641,000
|
$82.17
-3.59%
|
12/22/2014
|
$81.79
|
PP = $81.26
|
|
MB = $85.32
|
Most Recent Note - 12/29/2014 6:08:05 PM
Y - Holding its ground with volume totals cooling while perched at its all-time high and no resistance remains due to overhead supply. Volume-driven gains above the pivot point are needed to clinch a proper new (or add-on) technical buy signal.
>>> FEATURED STOCK ARTICLE : Gains for New Highs Backed By Lighter Volume - 12/22/2014
View all notes |
Set NEW NOTE alert |
CANSLIM.net Company Profile |
SEC
News |
Chart |
Request a new note
C
A N
S L
I M
|
ILMN
-
NASDAQ
Illumina Inc
DRUGS - Biotechnology
|
$186.29
|
-3.24
-1.71% |
$190.33
|
583,679
50.45% of 50 DAV
50 DAV is 1,157,000
|
$197.37
-5.61%
|
12/30/2014
|
$186.26
|
PP = $196.00
|
|
MB = $205.80
|
Most Recent Note - 12/30/2014 5:57:16 PM
Y - Color code is changed to yellow while consolidating near its 50 DMA line forming a "double bottom" base. Subsequent volume-driven gains above the pivot point may trigger a technical buy signal. Faces some resistance due to overhead supply up through $197. See the latest FSU analysis for more details and new annotated graphs.
>>> FEATURED STOCK ARTICLE : Forming New Base And Fundamentals Remain Favorable - 12/30/2014
View all notes |
Set NEW NOTE alert |
CANSLIM.net Company Profile |
SEC
News |
Chart |
Request a new note
C
A N
S L
I M
|
PANW
-
NYSE
Palo Alto Networks
Computer Sftwr-Security
|
$121.80
|
-1.09
-0.89% |
$122.96
|
606,682
38.16% of 50 DAV
50 DAV is 1,590,000
|
$128.20
-4.99%
|
7/30/2014
|
$84.21
|
PP = $85.88
|
|
MB = $90.17
|
Most Recent Note - 12/29/2014 12:35:40 PM
G - Pulling back today on slightly higher volume. Prior reports cautioned members - "It has not formed a sound base. The 50 DMA line defines near-term support to watch below recent lows."
>>> FEATURED STOCK ARTICLE : Latest Consolidation Was Not a Base of Sufficient Length - 12/18/2014
View all notes |
Set NEW NOTE alert |
CANSLIM.net Company Profile |
SEC
News |
Chart |
Request a new note
C
A N
S L
I M
|
RH
-
NYSE
Restoration Hardware Hld
RETAIL - Home Furnishing Stores
|
$96.76
|
-1.18
-1.20% |
$98.35
|
404,642
44.37% of 50 DAV
50 DAV is 912,000
|
$100.66
-3.87%
|
12/11/2014
|
$98.66
|
PP = $94.60
|
|
MB = $99.33
|
Most Recent Note - 12/30/2014 6:07:42 PM
Y - Volume totals have been cooling while stubbornly holding its ground near its all-time high. Subsequent losses leading to a close below its old high close ($93.05 on 6/30/14) would completely negate the recent breakout and raise concerns.
>>> FEATURED STOCK ARTICLE : Consolidating Above Prior Highs With Volume Totals Cooling - 12/26/2014
View all notes |
Set NEW NOTE alert |
CANSLIM.net Company Profile |
SEC
News |
Chart |
Request a new note
C
A N
S L
I M
|
UIHC
-
NASDAQ
United Insurance Holding
Insurance-Prop/Cas/Titl
|
$21.29
|
-0.02
-0.09% |
$21.69
|
74,545
32.70% of 50 DAV
50 DAV is 228,000
|
$22.41
-5.00%
|
12/5/2014
|
$20.64
|
PP = $20.31
|
|
MB = $21.33
|
Most Recent Note - 12/30/2014 6:09:53 PM
G - Consolidating after getting extended from a sound base. Prior highs and its 50 DMA line define near-term support in the $20 area.
>>> FEATURED STOCK ARTICLE : Recent Streak of Gains Lacked Volume Conviction - 12/23/2014
View all notes |
Set NEW NOTE alert |
CANSLIM.net Company Profile |
SEC
News |
Chart |
Request a new note
C
A N
S L
I M
|
Symbol/Exchange
Company Name
Industry Group |
PRICE |
CHANGE
(%Change) |
Day High |
Volume
(% DAV)
(% 50 day avg vol) |
52 Wk Hi
% From Hi |
Featured
Date |
Price
Featured |
Pivot Featured |
|
Max Buy |
|
|
|
THESE ARE NOT BUY RECOMMENDATIONS!
Comments contained in the body of this report are technical
opinions only. The material herein has been obtained
from sources believed to be reliable and accurate, however,
its accuracy and completeness cannot be guaranteed.
This site is not an investment advisor, hence it does
not endorse or recommend any securities or other investments.
Any recommendation contained in this report may not
be suitable for all investors and it is not to be deemed
an offer or solicitation on our part with respect to
the purchase or sale of any securities. All trademarks,
service marks and trade names appearing in this report
are the property of their respective owners, and are
likewise used for identification purposes only.
This report is a service available
only to active Paid Premium Members.
You may opt-out of receiving report notifications
at any time. Questions or comments may be submitted
by writing to Premium Membership Services 665 S.E. 10 Street, Suite 201 Deerfield Beach, FL 33441-5634 or by calling 1-800-965-8307
or 954-785-1121.
|
|
|

