You are not logged in.
This means you
CAN ONLY VIEW reports that were published prior to Monday, April 14, 2025.
You
MUST UPGRADE YOUR MEMBERSHIP if you want to see any current reports.
AFTER MARKET UPDATE - THURSDAY, DECEMBER 29TH, 2011
Previous After Market Report Next After Market Report >>>
|
|
|
|
DOW |
+135.63 |
12,287.04 |
+1.12% |
|
Volume |
531,695,870 |
-2% |
|
Volume |
1,007,896,430 |
-5% |
|
NASDAQ |
+23.76 |
2,613.74 |
+0.92% |
|
Advancers |
2,363 |
76% |
|
Advancers |
1,883 |
70% |
|
S&P 500 |
+13.38 |
1,263.02 |
+1.07% |
|
Decliners |
656 |
21% |
|
Decliners |
732 |
27% |
|
Russell 2000 |
+9.77 |
744.98 |
+1.33% |
|
52 Wk Highs |
110 |
|
|
52 Wk Highs |
33 |
|
|
S&P 600 |
+5.70 |
418.99 |
+1.38% |
|
52 Wk Lows |
34 |
|
|
52 Wk Lows |
76 |
|
|
 |
Major Averages Rise With Light Volume Conviction
Kenneth J. Gruneisen - Passed the CAN SLIM® Master's Exam
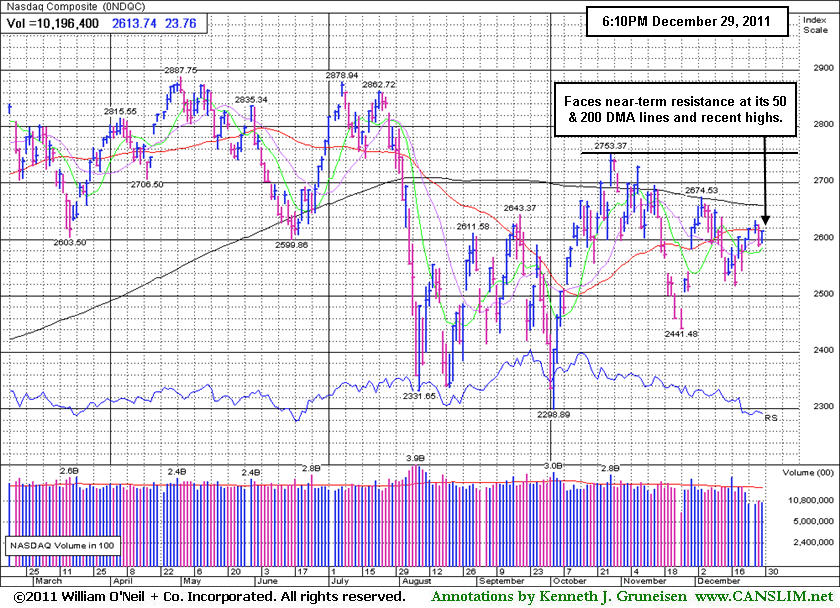
Heading into the final trading day of 2011, the Dow Jones Industrial Average is up +6.1% for the year. With Thursday's gain, the S&P 500 Index moved back into the black by +0.4%. The Nasdaq Composite Index is down -1.5% for the year. Behind Thursday's gains for the major averages the volume totals cooled slightly from the prior session totals and remained lighter than average on the NYSE and on the Nasdaq exchange. Breadth was positive as advancing issues led decliners by more than 3-1 on the NYSE and by nearly 3-1 on the Nasdaq exchange. New 52-week highs outnumbered new 52-week lows on the NYSE but new lows solidly outnumbered new highs on the Nasdaq exchange again. There were 31 high-ranked companies from the CANSLIM.net Leaders List that made new 52-week highs and appeared on the CANSLIM.net BreakOuts Page, up from the prior session total of 28 stocks. There were gains for 14 of the 17 high-ranked companies currently included on the Featured Stocks Page.
The bulls are not ready to give up on 2011 just yet. Stocks rallied to erase most of Wednesday's decline after receiving positive news on the economy. A report on housing showed the number of homes under contract rose +7.3% in November well ahead of consensus projections of a +1.5% increase. Although the weekly initial jobless claims figure came in slightly above expectations, investors were encouraged by signs the labor may be improving with fewer people filing for unemployment benefits over the past month.
The session was led by the financials and industrials. Shares of JP Morgan Chase & Co (JPM +2.36%) and Caterpillar Inc (CAT +1.35%) rose. Homebuilders lifted on the better-than-expected housing data. Lennar Corp (LEN +4.64%) and Pulte Group Inc (PHM +6.05%)
The Q4 2011 CANSLIM.net Webcast aired on Wednesday, December 28th at 8PM EST and is now available "ON DEMAND" to all upgraded members at no additional cost. Via the Premium Member Homepage links to all prior reports and webcasts are always available.
PICTURED: The Nasdaq Composite Index faces near-term resistance at its 50-day and 200-day moving average (DMA) lines and recent chart highs.
|
 Kenneth J. Gruneisen started out as a licensed stockbroker in August 1987, a couple of months prior to the historic stock market crash that took the Dow Jones Industrial Average down -22.6% in a single day. He has published daily fact-based fundamental and technical analysis on high-ranked stocks online for two decades. Through FACTBASEDINVESTING.COM, Kenneth provides educational articles, news, market commentary, and other information regarding proven investment systems that work in good times and bad.
Comments contained in the body of this report are technical opinions only and are not necessarily those of Gruneisen Growth Corp. The material herein has been obtained from sources believed to be reliable and accurate, however, its accuracy and completeness cannot be guaranteed. Our firm, employees, and customers may effect transactions, including transactions contrary to any recommendation herein, or have positions in the securities mentioned herein or options with respect thereto. Any recommendation contained in this report may not be suitable for all investors and it is not to be deemed an offer or solicitation on our part with respect to the purchase or sale of any securities. |
|
 |
Financial, Tech, and Commodity-Linked Groups Rose
Kenneth J. Gruneisen - Passed the CAN SLIM® Master's Exam
Financial shares were among Thursday's influential gainers as the Broker/Dealer Index ($XBD +1.71%) and Bank Index ($BKX +2.11%) rose, yet the session was marked by widespread gains from most industry groups. The Gold & Silver Index ($XAU +1.75%) bounced up from its lowest close since August 2010. The Retail Index ($RLX +0.53%) posted a smaller gain, and there unanimous gains in the tech sector indices as the Biotechnology Index ($BTK +1.55%), Networking Index ($NWX +0.62%), Internet Index ($IIX +0.69%), and Semiconductor Index ($SOX +0.92%) finished higher. Strength in energy-related shares boosted the Oil Services Index ($OSX +0.87%) and Integrated Oil Index ($XOI +1.13%), and the Healthcare Index ($HMO +0.68%) rounded out a widely positive session.
Charts courtesy www.stockcharts.com
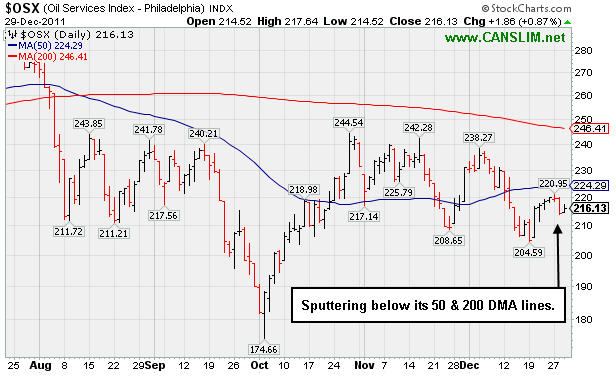
PICTURED: The Oil Services Index ($OSX +0.87%) is sputtering below its 50-day and 200-day moving average (DMA) lines.
| Oil Services |
$OSX |
216.13 |
+1.86 |
+0.87% |
-11.83% |
| Healthcare |
$HMO |
2,306.66 |
+15.56 |
+0.68% |
+36.33% |
| Integrated Oil |
$XOI |
1,228.96 |
+13.75 |
+1.13% |
+1.30% |
| Semiconductor |
$SOX |
365.93 |
+3.34 |
+0.92% |
-11.14% |
| Networking |
$NWX |
215.61 |
+1.32 |
+0.62% |
-23.15% |
| Internet |
$IIX |
282.62 |
+1.94 |
+0.69% |
-8.16% |
| Broker/Dealer |
$XBD |
83.76 |
+1.41 |
+1.71% |
-31.07% |
| Retail |
$RLX |
527.23 |
+2.76 |
+0.53% |
+3.71% |
| Gold & Silver |
$XAU |
179.43 |
+3.09 |
+1.75% |
-20.81% |
| Bank |
$BKX |
39.70 |
+0.82 |
+2.11% |
-23.96% |
| Biotech |
$BTK |
1,090.18 |
+16.63 |
+1.55% |
-15.99% |
|
|
|
 |
High-Ranked Biomed/Biotech Firm Perched Near High
Kenneth J. Gruneisen - Passed the CAN SLIM® Master's Exam
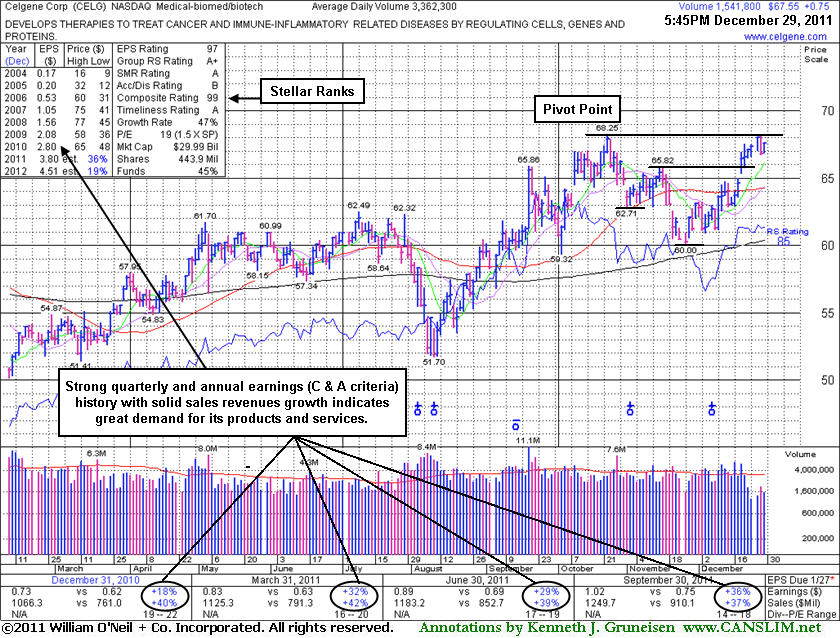
Celgene Corp (CELG +$0.75 or +1.12% to $67.55) posted a small gain today on below average volume. A recent streak of 8 consecutive small gains helped it rally within close striking distance of its 52-week high and the new pivot point that was cited on 12/20/11 based on its prior high plus 10 cents. Some may consider its strong finish on 12/20/11 to have already cleared a "double bottom" base, however, its ability to power into new high territory with additional volume-driven gains would be viewed as most reassuring sign that it may be capable of a meaningful and sustained advance. Subsequent volume-driven gains above the pivot point cited may trigger a new (or add-on) technical buy signal.
Its last appearance in this FSU section was on 12/01/11 with an annotated graph under the headline, "Rebound Above 50-Day Moving Average Needed For Outlook To Improve", while consolidating below its 50-day moving average (DMA) line. That important short-term average acted as resistance briefly, but it eventually repaired the technical damage with volume-driven gains. The stock's choppy action, coupled with tough market action (M criteria) in prior weeks, may likely have prompted investors to sell this high-ranked Medical -Biomed/ Biotech firm's shares and reduce market exposure. Additional opportunities to accumulate the same company's shares within the fact-based system's guidelines can eventually come along, so patience and discipline are required. New buying efforts may be justified under the fact-based system's guidelines using a tactic called pyramiding. As always, disciplined investors limit losses if any stock ever falls more that -7% from their buy point.
|
|
|
Color Codes Explained :
Y - Better candidates highlighted by our
staff of experts.
G - Previously featured
in past reports as yellow but may no longer be buyable under the
guidelines.
***Last / Change / Volume data in this table is the closing quote data***
Symbol/Exchange
Company Name
Industry Group |
PRICE |
CHANGE
(%Change) |
Day High |
Volume
(% DAV)
(% 50 day avg vol) |
52 Wk Hi
% From Hi |
Featured
Date |
Price
Featured |
Pivot Featured |
|
Max Buy |
ADS
-
NYSE
Alliance Data Sys Corp
COMPUTER SOFTWARE and SERVICES - Information and Delivery Service
|
$104.33
|
+0.41
0.39% |
$104.70
|
370,362
47.42% of 50 DAV
50 DAV is 781,100
|
$107.33
-2.80%
|
10/21/2011
|
$97.94
|
PP = $101.15
|
|
MB = $106.21
|
Most Recent Note - 12/27/2011 12:44:09 PM
Y - Stubbornly holding its ground with volume totals cooling while perched within close striking distance of its all-time high. Its 50 DMA line defines important near-term chart support.
>>> The latest Featured Stock Update with an annotated graph appeared on 12/14/2011. Click here.
View all notes |
Alert me of new notes |
CANSLIM.net Company Profile |
SEC |
Zacks Reports |
StockTalk |
News |
Chart |
Request a new note
C
A N
S L
I M


|
ALXN
-
NASDAQ
Alexion Pharmaceuticals
DRUGS - Drug Manufacturers - Other
|
$70.98
|
+0.06
0.08% |
$71.29
|
1,289,391
107.81% of 50 DAV
50 DAV is 1,196,000
|
$72.18
-1.66%
|
11/30/2011
|
$68.66
|
PP = $70.52
|
|
MB = $74.05
|
Most Recent Note - 12/27/2011 12:09:14 PM
Y - Rallying to new all-time high territory and above its pivot point with today's gain. A strong close with at least +40% above average volume or more may clinch a new technical buy signal. Recent lows near $62 define important near-term support to watch.
>>> The latest Featured Stock Update with an annotated graph appeared on 12/12/2011. Click here.
View all notes |
Alert me of new notes |
CANSLIM.net Company Profile |
SEC |
Zacks Reports |
StockTalk |
News |
Chart |
Request a new note
C
A N
S L
I M
|
CATM
-
NASDAQ
Cardtronics Inc
DIVERSIFIED SERVICES - Business/Management Services
|
$27.38
|
+0.28
1.03% |
$27.79
|
238,893
68.00% of 50 DAV
50 DAV is 351,300
|
$28.74
-4.73%
|
12/23/2011
|
$28.64
|
PP = $28.56
|
|
MB = $29.99
|
Most Recent Note - 12/28/2011 5:22:32 PM
Y - Down today for a 2nd consecutive loss on near average volume, slumping further below the pivot point cited. Its 50 DMA line defines important chart support to watch.
>>> The latest Featured Stock Update with an annotated graph appeared on 12/23/2011. Click here.
View all notes |
Alert me of new notes |
CANSLIM.net Company Profile |
SEC |
Zacks Reports |
StockTalk |
News |
Chart |
Request a new note
C
A N
S L
I M
|
CELG
-
NASDAQ
Celgene Corp
DRUGS - Drug Manufacturers - Major
|
$67.55
|
+0.75
1.12% |
$67.64
|
1,548,617
46.06% of 50 DAV
50 DAV is 3,362,300
|
$68.25
-1.03%
|
12/20/2011
|
$66.68
|
PP = $68.35
|
|
MB = $71.77
|
 Most Recent Note - 12/29/2011 6:10:32 PM
Y - Perched within close striking distance of its 52-week high. Subsequent volume-driven gains above the pivot point may trigger a new (or add-on) technical buy signal. See the latest FSU analysis for more details and a new annotated graph.
>>> The latest Featured Stock Update with an annotated graph appeared on 12/29/2011. Click here.
View all notes |
Alert me of new notes |
CANSLIM.net Company Profile |
SEC |
Zacks Reports |
StockTalk |
News |
Chart |
Request a new note
C
A N
S L
I M
|
FEIC
-
NASDAQ
F E I Co
ELECTRONICS - Diversified Electronics
|
$41.84
|
+0.04
0.10% |
$42.19
|
188,986
54.40% of 50 DAV
50 DAV is 347,400
|
$43.00
-2.70%
|
12/7/2011
|
$41.41
|
PP = $42.35
|
|
MB = $44.47
|
Most Recent Note - 12/27/2011 12:48:54 PM
Y - Rallying into new all-time high territory today, however volume is running at a below average pace behind its gain. Its 50 DMA line and prior lows in the $36 area define chart support. Disciplined investors would watch for a volume-driven gain above the pivot point to trigger a proper technical buy signal.
>>> The latest Featured Stock Update with an annotated graph appeared on 12/21/2011. Click here.
View all notes |
Alert me of new notes |
CANSLIM.net Company Profile |
SEC |
Zacks Reports |
StockTalk |
News |
Chart |
Request a new note
C
A N
S L
I M
|
Symbol/Exchange
Company Name
Industry Group |
PRICE |
CHANGE
(%Change) |
Day High |
Volume
(% DAV)
(% 50 day avg vol) |
52 Wk Hi
% From Hi |
Featured
Date |
Price
Featured |
Pivot Featured |
|
Max Buy |
GNC
-
NYSE
G N C Holdings Inc
RETAIL - Drug Stores
|
$29.19
|
+0.18
0.62% |
$29.26
|
250,384
15.26% of 50 DAV
50 DAV is 1,640,400
|
$29.50
-1.05%
|
10/26/2011
|
$24.60
|
PP = $24.80
|
|
MB = $26.04
|
Most Recent Note - 12/27/2011 1:16:31 PM
G - Holding its ground perched near all-time high territory. It is extended from its prior base pattern. Prior chart highs and its 50 DMA line coincide in the $25-26 area defining important support to watch on pullbacks.
>>> The latest Featured Stock Update with an annotated graph appeared on 12/16/2011. Click here.
View all notes |
Alert me of new notes |
CANSLIM.net Company Profile |
SEC |
Zacks Reports |
StockTalk |
News |
Chart |
Request a new note
C
A N
S L
I M
|
HMSY
-
NASDAQ
H M S Holdings Corp
COMPUTER SOFTWARE and SERVICES - Healthcare Information Service
|
$31.94
|
+0.48
1.53% |
$32.06
|
401,646
37.58% of 50 DAV
50 DAV is 1,068,700
|
$32.33
-1.20%
|
10/27/2011
|
$26.44
|
PP = $28.37
|
|
MB = $29.79
|
Most Recent Note - 12/28/2011 6:39:35 PM
G - Touched a new all-time high today and then reversed into the red for a small loss on light volume. No resistance remains, but it is extended from its prior base. See the latest FSU analysis for more details and a new annotated graph.
>>> The latest Featured Stock Update with an annotated graph appeared on 12/28/2011. Click here.
View all notes |
Alert me of new notes |
CANSLIM.net Company Profile |
SEC |
Zacks Reports |
StockTalk |
News |
Chart |
Request a new note
C
A N
S L
I M
|
ISRG
-
NASDAQ
Intuitive Surgical Inc
HEALTH SERVICES - Medical Appliances and Equipment
|
$466.03
|
+8.33
1.82% |
$466.04
|
210,979
61.15% of 50 DAV
50 DAV is 345,000
|
$465.65
0.08%
|
12/20/2011
|
$442.43
|
PP = $449.16
|
|
MB = $471.62
|
Most Recent Note - 12/29/2011 5:42:08 PM
Y - Up today without great volume conviction, yet rising even further into new all-time high territory. Recent gains above its pivot point have lacked the volume needed to trigger a proper new (or add-on) technical buy signal. Important support is defined by its 50 DMA line.
>>> The latest Featured Stock Update with an annotated graph appeared on 12/13/2011. Click here.
View all notes |
Alert me of new notes |
CANSLIM.net Company Profile |
SEC |
Zacks Reports |
StockTalk |
News |
Chart |
Request a new note
C
A N
S L
I M
|
MELI
-
NASDAQ
Mercadolibre Inc
INTERNET - Internet Software and; Services
|
$80.25
|
-0.15
-0.19% |
$80.98
|
538,593
75.94% of 50 DAV
50 DAV is 709,200
|
$95.48
-15.95%
|
12/5/2011
|
$91.08
|
PP = $92.83
|
|
MB = $97.47
|
Most Recent Note - 12/27/2011 12:54:53 PM
G - Quietly consolidating just above its 50 DMA line and prior lows defining chart support near the $80 area. It stalled after volume-driven gains to new all-time highs in early-December, yet it has not encountered heavy distributional pressure.
>>> The latest Featured Stock Update with an annotated graph appeared on 12/5/2011. Click here.
View all notes |
Alert me of new notes |
CANSLIM.net Company Profile |
SEC |
Zacks Reports |
StockTalk |
News |
Chart |
Request a new note
C
A N
S L
I M
|
MG
-
NYSE
Mistras Group Inc
DIVERSIFIED SERVICES - Bulding and Faci;ity Management Services
|
$25.50
|
-0.30
-1.16% |
$25.92
|
98,735
67.53% of 50 DAV
50 DAV is 146,200
|
$26.15
-2.49%
|
10/28/2011
|
$22.49
|
PP = $23.61
|
|
MB = $24.79
|
Most Recent Note - 12/27/2011 1:14:50 PM
G - Up today and on track for a 5th consecutive small gain. Color code is changed to green after inching above its "max buy" level. Prior highs in the $23 area define chart support along with its 50 DMA line.
>>> The latest Featured Stock Update with an annotated graph appeared on 12/8/2011. Click here.
View all notes |
Alert me of new notes |
CANSLIM.net Company Profile |
SEC |
Zacks Reports |
StockTalk |
News |
Chart |
Request a new note
C
A N
S L
I M
|
Symbol/Exchange
Company Name
Industry Group |
PRICE |
CHANGE
(%Change) |
Day High |
Volume
(% DAV)
(% 50 day avg vol) |
52 Wk Hi
% From Hi |
Featured
Date |
Price
Featured |
Pivot Featured |
|
Max Buy |
MKTX
-
NASDAQ
Marketaxess Holdings Inc
FINANCIAL SERVICES - Investment Brokerage - Nationa
|
$30.21
|
+0.28
0.94% |
$30.93
|
218,213
107.60% of 50 DAV
50 DAV is 202,800
|
$31.59
-4.37%
|
10/28/2011
|
$29.79
|
PP = $31.05
|
|
MB = $32.60
|
Most Recent Note - 12/28/2011 12:48:58 PM
Y - Up today, rallying within striking distance of its best-ever close. Held its ground after reversing back into the prior base when encountering distributional pressure immediately following its volume-driven breakout on 12/20/11. The 50 DMA line is initial chart support to watch.
>>> The latest Featured Stock Update with an annotated graph appeared on 12/20/2011. Click here.
View all notes |
Alert me of new notes |
CANSLIM.net Company Profile |
SEC |
Zacks Reports |
StockTalk |
News |
Chart |
Request a new note
C
A N
S L
I M
|
OSIS
-
NASDAQ
O S I Systems Inc
ELECTRONICS - Semiconductor Equipment and Mate
|
$49.00
|
-0.06
-0.12% |
$49.89
|
53,906
47.75% of 50 DAV
50 DAV is 112,900
|
$49.41
-0.83%
|
11/1/2011
|
$42.07
|
PP = $45.57
|
|
MB = $47.85
|
Most Recent Note - 12/27/2011 12:58:30 PM
G - Up today without great volume conviction, yet inching further above its "max buy" level into new all-time high territory and its color code is changed to green. Its 50 DMA line and recent chart lows near $45 define important near-term support to watch.
>>> The latest Featured Stock Update with an annotated graph appeared on 12/27/2011. Click here.
View all notes |
Alert me of new notes |
CANSLIM.net Company Profile |
SEC |
Zacks Reports |
StockTalk |
News |
Chart |
Request a new note
C
A N
S L
I M
|
PRGO
-
NASDAQ
Perrigo Co
DRUGS - Drug Related Products
|
$99.04
|
+0.14
0.14% |
$99.51
|
476,587
35.62% of 50 DAV
50 DAV is 1,338,000
|
$104.70
-5.41%
|
12/9/2011
|
$99.54
|
PP = $101.56
|
|
MB = $106.64
|
Most Recent Note - 12/27/2011 1:01:32 PM
Y - Perched near its all-time high today, holding its ground since a negative reversal on 12/22/11. Insider buying was recently reported while perched near all-time highs, which is a reassuring sign. It has formed a late-stage base, however disciplined investors would watch for confirming gains to trigger a proper new technical buy signal. Chart readers may note that its Relative Strength line peaked in September and did not recently lead the way confirming new highs.
>>> The latest Featured Stock Update with an annotated graph appeared on 12/9/2011. Click here.
View all notes |
Alert me of new notes |
CANSLIM.net Company Profile |
SEC |
Zacks Reports |
StockTalk |
News |
Chart |
Request a new note
C
A N
S L
I M
|
RAX
-
NYSE
Rackspace Hosting Inc
INTERNET - Internet Software and; Services
|
$43.37
|
+0.06
0.14% |
$43.81
|
771,274
49.11% of 50 DAV
50 DAV is 1,570,500
|
$46.50
-6.72%
|
11/8/2011
|
$44.28
|
PP = $46.27
|
|
MB = $48.58
|
Most Recent Note - 12/27/2011 1:02:58 PM
Y - Holding its ground today perched within -5.7% of its 52-week and all-time high. Its 50 DMA line defines near-term support to watch. That short-term moving average has risen since its positive crossover with the 200 DMA line shown on the graph in the latest FSU analysis dated 12/07/11.
>>> The latest Featured Stock Update with an annotated graph appeared on 12/7/2011. Click here.
View all notes |
Alert me of new notes |
CANSLIM.net Company Profile |
SEC |
Zacks Reports |
StockTalk |
News |
Chart |
Request a new note
C
A N
S L
I M
|
SWI
-
NYSE
Solarwinds Inc
COMPUTER SOFTWARE and SERVICES - Application Software
|
$28.48
|
+0.02
0.07% |
$28.83
|
521,059
41.03% of 50 DAV
50 DAV is 1,269,800
|
$33.68
-15.44%
|
10/27/2011
|
$27.78
|
PP = $25.62
|
|
MB = $26.90
|
Most Recent Note - 12/27/2011 1:08:11 PM
G - Still lingering below its 50 DMA line after damaging losses triggered worrisome technical sell signals, and a rebound above that important short-term average is needed for its outlook to improve. Prior highs in the $25-26 area and its 200 DMA line define the next important area of chart support.
>>> The latest Featured Stock Update with an annotated graph appeared on 12/19/2011. Click here.
View all notes |
Alert me of new notes |
CANSLIM.net Company Profile |
SEC |
Zacks Reports |
StockTalk |
News |
Chart |
Request a new note
C
A N
S L
I M
|
Symbol/Exchange
Company Name
Industry Group |
PRICE |
CHANGE
(%Change) |
Day High |
Volume
(% DAV)
(% 50 day avg vol) |
52 Wk Hi
% From Hi |
Featured
Date |
Price
Featured |
Pivot Featured |
|
Max Buy |
TDG
-
NYSE
Transdigm Group Inc
AEROSPACE/DEFENSE - Aerospace/Defense Products and; Services
|
$96.49
|
+1.15
1.21% |
$96.65
|
172,411
48.54% of 50 DAV
50 DAV is 355,200
|
$102.73
-6.07%
|
11/9/2011
|
$98.45
|
PP = $95.14
|
|
MB = $99.90
|
Most Recent Note - 12/28/2011 5:03:33 PM
Y - Finished near the session low today with a considerable loss on higher (yet still below average) volume. Its 50 DMA line defines near-term support above recent lows where subsequent violations would trigger technical sell signals.
>>> The latest Featured Stock Update with an annotated graph appeared on 12/6/2011. Click here.
View all notes |
Alert me of new notes |
CANSLIM.net Company Profile |
SEC |
Zacks Reports |
StockTalk |
News |
Chart |
Request a new note
C
A N
S L
I M
|
V
-
NYSE
Visa Inc Cl A
DIVERSIFIED SERVICES - Business/Management Services
|
$103.15
|
+2.43
2.41% |
$103.25
|
2,159,362
51.46% of 50 DAV
50 DAV is 4,195,900
|
$103.45
-0.29%
|
10/24/2011
|
$94.21
|
PP = $94.85
|
|
MB = $99.59
|
Most Recent Note - 12/29/2011 5:40:35 PM
G - Up today with below average volume, rising to a best-ever close. It is extended from its prior base and trading above its "max buy" level. Prior highs in the $95 area and its 50 DMA line define chart support to watch on pullbacks.
>>> The latest Featured Stock Update with an annotated graph appeared on 12/15/2011. Click here.
View all notes |
Alert me of new notes |
CANSLIM.net Company Profile |
SEC |
Zacks Reports |
StockTalk |
News |
Chart |
Request a new note
C
A N
S L
I M
|
|
|
|
THESE ARE NOT BUY RECOMMENDATIONS!
Comments contained in the body of this report are technical
opinions only. The material herein has been obtained
from sources believed to be reliable and accurate, however,
its accuracy and completeness cannot be guaranteed.
This site is not an investment advisor, hence it does
not endorse or recommend any securities or other investments.
Any recommendation contained in this report may not
be suitable for all investors and it is not to be deemed
an offer or solicitation on our part with respect to
the purchase or sale of any securities. All trademarks,
service marks and trade names appearing in this report
are the property of their respective owners, and are
likewise used for identification purposes only.
This report is a service available
only to active Paid Premium Members.
You may opt-out of receiving report notifications
at any time. Questions or comments may be submitted
by writing to Premium Membership Services 665 S.E. 10 Street, Suite 201 Deerfield Beach, FL 33441-5634 or by calling 1-800-965-8307
or 954-785-1121.
|
|
|

