***Last / Change / Volume data in this table is the closing quote data***
Symbol/Exchange
Company Name
Industry Group |
PRICE |
CHANGE
(%Change) |
Day High |
Volume
(% DAV)
(% 50 day avg vol) |
52 Wk Hi
% From Hi |
Featured
Date |
Price
Featured |
Pivot Featured |
|
Max Buy |
ABV
-
NYSE
Comp De Bebidas Adr
FOOD and BEVERAGE - Beverages - Brewers
|
$30.03
|
-0.59
-1.93% |
$30.39
|
1,334,636
225.07% of 50 DAV
50 DAV is 593,000
|
$153.79
-80.47%
|
12/10/2010
|
$139.87
|
PP = $145.46
|
|
MB = $152.73
|
 Most Recent Note - 12/28/2010 4:25:56 PM
G - Pulled back from all-time highs today. Prior highs in the $29 area define important chart support to watch above its 50 DMA line. Do not be confused by the 5:1 split impacting its share price as of today. (Previous data concerning Featured Price and Pivot Point will soon be adjusted).
>>> The latest Featured Stock Update with an annotated graph appeared on 12/3/2010. Click here.
View all notes |
Alert me of new notes |
CANSLIM.net Company Profile |
SEC |
Zacks Reports |
StockTalk |
News |
Chart |
Request a new note
C
A N
S L
I M


|
ARUN
-
NASDAQ
Aruba Networks Inc
COMPUTER HARDWARE - Networking andamp; Communication Dev
|
$21.20
|
-0.49
-2.26% |
$21.85
|
1,410,846
59.39% of 50 DAV
50 DAV is 2,375,500
|
$24.28
-12.69%
|
8/30/2010
|
$18.12
|
PP = $18.51
|
|
MB = $19.44
|
Most Recent Note - 12/28/2010 4:30:07 PM
G - Closed further below its 50 DMA line today and finished just below earlier low closes with a loss on lighter volume. More damaging losses below the prior session low ($20.37) would raise greater concerns and trigger more serious technical sell signals.
>>> The latest Featured Stock Update with an annotated graph appeared on 12/14/2010. Click here.
View all notes |
Alert me of new notes |
CANSLIM.net Company Profile |
SEC |
Zacks Reports |
StockTalk |
News |
Chart |
Request a new note
C
A N
S L
I M
|
CACC
-
NASDAQ
Credit Acceptance Corp
FINANCIAL SERVICES - Credit Services
|
$62.29
|
-0.60
-0.95% |
$62.47
|
9,436
42.31% of 50 DAV
50 DAV is 22,300
|
$63.58
-2.02%
|
11/22/2010
|
$59.97
|
PP = $62.00
|
|
MB = $65.10
|
Most Recent Note - 12/27/2010 3:04:52 PM
Y - Quietly touched a new 52-week high earlier this afternoon without great volume conviction behind its gain.
>>> The latest Featured Stock Update with an annotated graph appeared on 12/20/2010. Click here.
View all notes |
Alert me of new notes |
CANSLIM.net Company Profile |
SEC |
Zacks Reports |
StockTalk |
News |
Chart |
Request a new note
C
A N
S L
I M
|
CIS
-
NYSE
Camelot Info Systems Ads
COMPUTER SOFTWARE andamp; SERVICES - Information Technology Service
|
$22.76
|
-0.19
-0.83% |
$23.83
|
190,458
46.88% of 50 DAV
50 DAV is 406,300
|
$24.89
-8.56%
|
11/26/2010
|
$18.93
|
PP = $19.72
|
|
MB = $20.71
|
Most Recent Note - 12/27/2010 5:53:40 PM
G - Quietly consolidating near its all-time high, with no resistance remaining due to overhead supply. Recently completed a Secondary Offering and found support near prior highs in the $19.50 area, but it has not formed a sound new base following its 11/29/10 breakout.
>>> The latest Featured Stock Update with an annotated graph appeared on 11/26/2010. Click here.
View all notes |
Alert me of new notes |
CANSLIM.net Company Profile |
SEC |
Zacks Reports |
StockTalk |
News |
Chart |
Request a new note
C
A N
S L
I M
|
CMG
-
NYSE
Chipotle Mexican Grill
LEISURE - Restaurants
|
$220.04
|
-2.69
-1.21% |
$224.99
|
921,310
86.13% of 50 DAV
50 DAV is 1,069,700
|
$262.78
-16.26%
|
9/1/2010
|
$158.31
|
PP = $155.52
|
|
MB = $163.30
|
Most Recent Note - 12/27/2010 12:04:43 PM
G - Concerns are raised after today's gap down under its 50 DMA line and early weakness below its recent chart low ($221.41 on 12/14/10). Technically, it is not near any sound base, while more damaging losses could suggest it is due for a longer and deeper consolidation.
>>> The latest Featured Stock Update with an annotated graph appeared on 12/17/2010. Click here.
View all notes |
Alert me of new notes |
CANSLIM.net Company Profile |
SEC |
Zacks Reports |
StockTalk |
News |
Chart |
Request a new note
C
A N
S L
I M
|
Symbol/Exchange
Company Name
Industry Group |
PRICE |
CHANGE
(%Change) |
Day High |
Volume
(% DAV)
(% 50 day avg vol) |
52 Wk Hi
% From Hi |
Featured
Date |
Price
Featured |
Pivot Featured |
|
Max Buy |
DECK
-
NASDAQ
Deckers Outdoor Corp
CONSUMER NON-DURABLES - Textile - Apparel Footwear
|
$83.18
|
-1.78
-2.10% |
$85.40
|
1,043,141
55.82% of 50 DAV
50 DAV is 1,868,800
|
$87.88
-5.35%
|
10/27/2010
|
$54.16
|
PP = $54.86
|
|
MB = $57.60
|
Most Recent Note - 12/28/2010 3:59:53 PM
G - It is extended well above its 50 DMA line, not near any sound base, yet still holding its ground near all-time highs.
>>> The latest Featured Stock Update with an annotated graph appeared on 12/16/2010. Click here.
View all notes |
Alert me of new notes |
CANSLIM.net Company Profile |
SEC |
Zacks Reports |
StockTalk |
News |
Chart |
Request a new note
C
A N
S L
I M
|
EZCH
-
NASDAQ
Ezchip Semiconductor Ltd
ELECTRONICS - Semiconductor - Specialized
|
$28.42
|
-0.10
-0.35% |
$28.72
|
95,800
34.94% of 50 DAV
50 DAV is 274,200
|
$29.73
-4.41%
|
12/2/2010
|
$27.53
|
PP = $26.00
|
|
MB = $27.30
|
Most Recent Note - 12/27/2010 2:47:01 PM
G - Volume totals have been cooling while consolidating in a tight range near its 52-week high. Prior chart highs in the $26 area define an important technical support level to watch.
>>> The latest Featured Stock Update with an annotated graph appeared on 12/2/2010. Click here.
View all notes |
Alert me of new notes |
CANSLIM.net Company Profile |
SEC |
Zacks Reports |
StockTalk |
News |
Chart |
Request a new note
C
A N
S L
I M
|
EZPW
-
NASDAQ
Ezcorp Inc Cl A
SPECIALTY RETAIL - Specialty Retail, Other
|
$27.48
|
-0.06
-0.22% |
$27.65
|
244,225
69.40% of 50 DAV
50 DAV is 351,900
|
$28.75
-4.42%
|
11/5/2010
|
$24.02
|
PP = $23.85
|
|
MB = $25.04
|
Most Recent Note - 12/27/2010 2:48:34 PM
G - Hovering near its 52-week high, recently noted - "Stubbornly holding its ground after recent volume-driven gains, extended from a sound base pattern. Its 50 DMA line defines important support."
>>> The latest Featured Stock Update with an annotated graph appeared on 11/6/2010. Click here.
View all notes |
Alert me of new notes |
CANSLIM.net Company Profile |
SEC |
Zacks Reports |
StockTalk |
News |
Chart |
Request a new note
C
A N
S L
I M
|
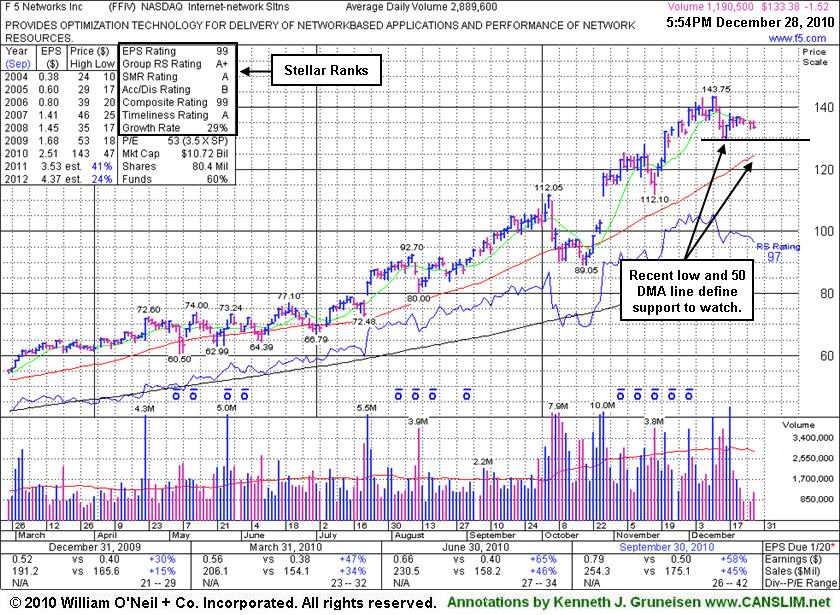
FFIV
-
NASDAQ
F 5 Networks Inc
INTERNET - Internet Software and Services
|
$133.38
|
-1.52
-1.13% |
$135.63
|
1,194,087
41.10% of 50 DAV
50 DAV is 2,905,300
|
$143.75
-7.21%
|
6/16/2010
|
$74.50
|
PP = $74.10
|
|
MB = $77.81
|
Most Recent Note - 12/27/2010 3:01:31 PM
G - Volume totals have been cooling while consolidating in a tight range only -6% off its all-time high. Its recent low ($129.59 on 12/16/10) defines initial chart support well above its 50 DMA line.
>>> The latest Featured Stock Update with an annotated graph appeared on 12/28/2010. Click here.
View all notes |
Alert me of new notes |
CANSLIM.net Company Profile |
SEC |
Zacks Reports |
StockTalk |
News |
Chart |
Request a new note
C
A N
S L
I M
|
FOSL
-
NASDAQ
Fossil Inc
CONSUMER DURABLES - Recreational Goods, Other
|
$71.50
|
+0.22
0.31% |
$71.80
|
277,263
34.94% of 50 DAV
50 DAV is 793,500
|
$74.34
-3.82%
|
11/26/2010
|
$69.10
|
PP = $70.17
|
|
MB = $73.68
|
Most Recent Note - 12/22/2010 5:43:10 PM
Y - Still consolidating above prior highs, only -3.3% off its all-time high. Volume totals have been cooling since its technical breakout on 12/02/10 from an advanced "3-weeks tight" pattern.
>>> The latest Featured Stock Update with an annotated graph appeared on 11/29/2010. Click here.
View all notes |
Alert me of new notes |
CANSLIM.net Company Profile |
SEC |
Zacks Reports |
StockTalk |
News |
Chart |
Request a new note
C
A N
S L
I M
|
Symbol/Exchange
Company Name
Industry Group |
PRICE |
CHANGE
(%Change) |
Day High |
Volume
(% DAV)
(% 50 day avg vol) |
52 Wk Hi
% From Hi |
Featured
Date |
Price
Featured |
Pivot Featured |
|
Max Buy |
HMSY
-
NASDAQ
H M S Holdings Corp
COMPUTER SOFTWARE and SERVICES - Healthcare Information Service
|
$65.07
|
-0.10
-0.15% |
$65.56
|
73,182
36.43% of 50 DAV
50 DAV is 200,900
|
$67.10
-3.03%
|
11/19/2010
|
$61.89
|
PP = $63.01
|
|
MB = $66.16
|
Most Recent Note - 12/22/2010 5:45:27 PM
G - Touched a new high after a strong start today, but it reversed into the red for the close for a small loss on light volume. Prior highs in the $62 define initial chart support to watch above its 50 DMA line. Its Relative Strength rank has slumped to 74, below the 80+ guideline.
>>> The latest Featured Stock Update with an annotated graph appeared on 11/19/2010. Click here.
View all notes |
Alert me of new notes |
CANSLIM.net Company Profile |
SEC |
Zacks Reports |
StockTalk |
News |
Chart |
Request a new note
C
A N
S L
I M
|
JOBS
-
NASDAQ
Fifty One Job Inc Ads
DIVERSIFIED SERVICES - Staffing and; Outsourcing Service
|
$48.75
|
+0.10
0.21% |
$49.18
|
60,701
33.30% of 50 DAV
50 DAV is 182,300
|
$55.50
-12.16%
|
10/13/2010
|
$42.07
|
PP = $40.60
|
|
MB = $42.63
|
Most Recent Note - 12/27/2010 2:37:07 PM
G - Considerable loss today, trading near its 50 DMA line and recent lows. Recently noted as extended from any sound base, consolidating after nearly challenging its all-time high near $55 from 2004.
>>> The latest Featured Stock Update with an annotated graph appeared on 11/16/2010. Click here.
View all notes |
Alert me of new notes |
CANSLIM.net Company Profile |
SEC |
Zacks Reports |
StockTalk |
News |
Chart |
Request a new note
C
A N
S L
I M
|
LULU
-
NASDAQ
Lululemon Athletica
MANUFACTURING - Textile Manufacturing
|
$68.89
|
-2.83
-3.95% |
$72.20
|
1,701,166
103.96% of 50 DAV
50 DAV is 1,636,400
|
$74.60
-7.65%
|
10/8/2010
|
$47.66
|
PP = $46.67
|
|
MB = $49.00
|
Most Recent Note - 12/28/2010 3:57:08 PM
G - Down today with higher (near average) volume conviction, consolidating from its all-time high. There is no near-term chart support while it is extended from its 50 DMA line (now $54.27).
>>> The latest Featured Stock Update with an annotated graph appeared on 12/1/2010. Click here.
View all notes |
Alert me of new notes |
CANSLIM.net Company Profile |
SEC |
Zacks Reports |
StockTalk |
News |
Chart |
Request a new note
C
A N
S L
I M
|
MWIV
-
NASDAQ
M W I Veterinary Supply
HEALTH SERVICES - Medical Instruments and; Supplies
|
$65.38
|
-0.17
-0.26% |
$65.84
|
21,344
36.74% of 50 DAV
50 DAV is 58,100
|
$65.75
-0.56%
|
11/4/2010
|
$61.79
|
PP = $59.60
|
|
MB = $62.58
|
Most Recent Note - 12/27/2010 2:55:04 PM
G - Hit another new 52-week high with a 6th consecutive gain, rallying with above average volume.
>>> The latest Featured Stock Update with an annotated graph appeared on 12/21/2010. Click here.
View all notes |
Alert me of new notes |
CANSLIM.net Company Profile |
SEC |
Zacks Reports |
StockTalk |
News |
Chart |
Request a new note
C
A N
S L
I M
|
NEOG
-
NASDAQ
Neogen Corp
DRUGS - Diagnostic Substances
|
$41.93
|
+0.04
0.10% |
$42.09
|
64,108
77.90% of 50 DAV
50 DAV is 82,300
|
$42.47
-1.27%
|
9/1/2010
|
$30.79
|
PP = $30.49
|
|
MB = $32.01
|
Most Recent Note - 12/27/2010 12:31:29 PM
G - Touched yet another new high today with a small gain. It may go on to produce more climactic gains while unhindered by resistance due to overhead supply. It has been noted repeatedly as extended from any sound base after steadily advancing. Its 50 DMA line has been a reliable support level.
>>> The latest Featured Stock Update with an annotated graph appeared on 12/6/2010. Click here.
View all notes |
Alert me of new notes |
CANSLIM.net Company Profile |
SEC |
Zacks Reports |
StockTalk |
News |
Chart |
Request a new note
C
A N
S L
I M
|
Symbol/Exchange
Company Name
Industry Group |
PRICE |
CHANGE
(%Change) |
Day High |
Volume
(% DAV)
(% 50 day avg vol) |
52 Wk Hi
% From Hi |
Featured
Date |
Price
Featured |
Pivot Featured |
|
Max Buy |
NFLX
-
NASDAQ
Netflix Inc
SPECIALTY RETAIL - Music and Video Stores
|
$183.67
|
+3.66
2.03% |
$184.37
|
3,887,809
62.39% of 50 DAV
50 DAV is 6,231,700
|
$206.80
-11.18%
|
11/9/2010
|
$173.10
|
PP = $184.84
|
|
MB = $194.08
|
Most Recent Note - 12/28/2010 4:20:05 PM
G - Small gain today with light volume, consolidating just above its 50 DMA line and recent lows defining near-term support. More damaging losses could trigger technical sell signals.
>>> The latest Featured Stock Update with an annotated graph appeared on 11/24/2010. Click here.
View all notes |
Alert me of new notes |
CANSLIM.net Company Profile |
SEC |
Zacks Reports |
StockTalk |
News |
Chart |
Request a new note
C
A N
S L
I M
|
NTAP
-
NASDAQ
Netapp Inc
COMPUTER HARDWARE - Data Storage Devices
|
$54.71
|
-0.31
-0.56% |
$55.23
|
1,456,528
23.79% of 50 DAV
50 DAV is 6,122,900
|
$57.96
-5.61%
|
9/8/2010
|
$46.98
|
PP = $44.99
|
|
MB = $47.24
|
Most Recent Note - 12/27/2010 3:13:32 PM
G - Volume totals have been cooling while consolidating above its 50 DMA line and working on building a new base.
>>> The latest Featured Stock Update with an annotated graph appeared on 12/27/2010. Click here.
View all notes |
Alert me of new notes |
CANSLIM.net Company Profile |
SEC |
Zacks Reports |
StockTalk |
News |
Chart |
Request a new note
C
A N
S L
I M
|
ORCL
-
NASDAQ
Oracle Corp
COMPUTER SOFTWARE and SERVICES - Application Software
|
$31.57
|
-0.09
-0.28% |
$31.76
|
9,733,965
31.06% of 50 DAV
50 DAV is 31,334,900
|
$32.27
-2.17%
|
12/7/2010
|
$29.05
|
PP = $29.92
|
|
MB = $31.42
|
Most Recent Note - 12/27/2010 3:10:22 PM
G - Volume totals have recently been light while stubbornly holding its ground in a tight range following its considerable 12/17/10 gap up gain on heavy volume. It is extended from a sound base, with support at prior chart highs and its 50 DMA line.
>>> The latest Featured Stock Update with an annotated graph appeared on 11/18/2010. Click here.
View all notes |
Alert me of new notes |
CANSLIM.net Company Profile |
SEC |
Zacks Reports |
StockTalk |
News |
Chart |
Request a new note
C
A N
S L
I M
|
PAY
-
NYSE
Verifone Systems Inc
COMPUTER HARDWARE - Transaction Automation Systems
|
$38.56
|
-0.66
-1.68% |
$39.33
|
689,577
45.24% of 50 DAV
50 DAV is 1,524,200
|
$41.47
-7.02%
|
11/29/2010
|
$33.96
|
PP = $36.04
|
|
MB = $37.84
|
Most Recent Note - 12/22/2010 4:49:58 PM
G - Consolidating -6.7% off its all-time high, extended from its prior base. The old high in the $36 area nearly coincides with its 50 DMA line, defining important support to watch.
>>> The latest Featured Stock Update with an annotated graph appeared on 12/15/2010. Click here.
View all notes |
Alert me of new notes |
CANSLIM.net Company Profile |
SEC |
Zacks Reports |
StockTalk |
News |
Chart |
Request a new note
C
A N
S L
I M
|
RAX
-
NYSE
Rackspace Hosting Inc
INTERNET - Internet Software and; Services
|
$30.99
|
-0.11
-0.35% |
$31.72
|
1,065,340
56.04% of 50 DAV
50 DAV is 1,901,000
|
$32.69
-5.20%
|
9/21/2010
|
$22.84
|
PP = $23.61
|
|
MB = $24.79
|
Most Recent Note - 12/22/2010 4:53:17 PM
G - Volume totals have been cooling while stubbornly holding its ground since hitting its 12/10/10 all-time high. No resistance remains due to overhead supply, but it is extended from any sound base.
>>> The latest Featured Stock Update with an annotated graph appeared on 11/17/2010. Click here.
View all notes |
Alert me of new notes |
CANSLIM.net Company Profile |
SEC |
Zacks Reports |
StockTalk |
News |
Chart |
Request a new note
C
A N
S L
I M
|
Symbol/Exchange
Company Name
Industry Group |
PRICE |
CHANGE
(%Change) |
Day High |
Volume
(% DAV)
(% 50 day avg vol) |
52 Wk Hi
% From Hi |
Featured
Date |
Price
Featured |
Pivot Featured |
|
Max Buy |
ROVI
-
NASDAQ
Rovi Corp
COMPUTER SOFTWARE andamp; SERVICES - Security Software andamp; Services
|
$58.25
|
+0.65
1.13% |
$58.29
|
1,843,999
168.83% of 50 DAV
50 DAV is 1,092,200
|
$59.06
-1.37%
|
10/29/2010
|
$49.99
|
PP = $53.10
|
|
MB = $55.76
|
Most Recent Note - 12/28/2010 4:59:22 PM
G - Up today with its best volume behind any gain since 11/01/10. Consolidating in a tight trading range well above prior chart highs and its 50 DMA line.
>>> The latest Featured Stock Update with an annotated graph appeared on 12/13/2010. Click here.
View all notes |
Alert me of new notes |
CANSLIM.net Company Profile |
SEC |
Zacks Reports |
StockTalk |
News |
Chart |
Request a new note
C
A N
S L
I M
|
SHOO
-
NASDAQ
Steven Madden Limited
CONSUMER NON-DURABLES - Textile - Apparel Footwear
|
$43.44
|
-1.03
-2.32% |
$44.85
|
318,149
89.17% of 50 DAV
50 DAV is 356,800
|
$47.69
-8.91%
|
11/23/2010
|
$44.61
|
PP = $44.95
|
|
MB = $47.20
|
Most Recent Note - 12/28/2010 4:08:08 PM
G - Loss today with near average volume violated its 50 DMA line. Finished the session under its recent low close, raising more serious concerns. More damaging losses may trigger technical sell signals.
>>> The latest Featured Stock Update with an annotated graph appeared on 11/23/2010. Click here.
View all notes |
Alert me of new notes |
CANSLIM.net Company Profile |
SEC |
Zacks Reports |
StockTalk |
News |
Chart |
Request a new note
C
A N
S L
I M
|
SLW
-
NYSE
Silver Wheaton Corp
METALS and; MINING - Silver
|
$38.30
|
+1.73
4.73% |
$38.50
|
7,097,125
67.85% of 50 DAV
50 DAV is 10,460,000
|
$42.34
-9.54%
|
8/25/2010
|
$21.40
|
PP = $21.99
|
|
MB = $23.09
|
Most Recent Note - 12/28/2010 4:09:13 PM
G - Considerable gain today with light volume after gapping up. Recently tested prior chart highs in the $36-37 area previously noted as initial support above its 50 DMA line. Gains in recent weeks lacked volume conviction while distributional pressure has been an ongoing concern since its negative reversal at an all-time high on 12/07/10.
>>> The latest Featured Stock Update with an annotated graph appeared on 12/8/2010. Click here.
View all notes |
Alert me of new notes |
CANSLIM.net Company Profile |
SEC |
Zacks Reports |
StockTalk |
News |
Chart |
Request a new note
C
A N
S L
I M
|
UA
-
NYSE
Under Armour Inc Cl A
CONSUMER NON-DURABLES - Textile - Apparel Clothing
|
$53.47
|
-1.03
-1.89% |
$54.67
|
412,918
56.00% of 50 DAV
50 DAV is 737,300
|
$60.14
-11.09%
|
9/9/2010
|
$39.99
|
PP = $40.10
|
|
MB = $42.11
|
Most Recent Note - 12/28/2010 4:11:43 PM
G - Down today with light volume while slumping under recent lows toward its 50 DMA line ($52.86 now) defining important support.
>>> The latest Featured Stock Update with an annotated graph appeared on 12/23/2010. Click here.
View all notes |
Alert me of new notes |
CANSLIM.net Company Profile |
SEC |
Zacks Reports |
StockTalk |
News |
Chart |
Request a new note
C
A N
S L
I M
|
ULTA
-
NASDAQ
Ulta Salon Cosm & Frag
SPECIALTY RETAIL - Specialty Retail, Other
|
$33.96
|
-0.19
-0.56% |
$34.34
|
135,007
24.35% of 50 DAV
50 DAV is 554,500
|
$37.24
-8.81%
|
9/3/2010
|
$26.36
|
PP = $25.89
|
|
MB = $27.18
|
Most Recent Note - 12/28/2010 4:13:18 PM
G - Still quietly consolidating just above its 50 DMA line. Subsequent deterioration below it or the most recent chart low ($32.01 on 12/15/10) could raise concerns and trigger technical sell signals.
>>> The latest Featured Stock Update with an annotated graph appeared on 12/22/2010. Click here.
View all notes |
Alert me of new notes |
CANSLIM.net Company Profile |
SEC |
Zacks Reports |
StockTalk |
News |
Chart |
Request a new note
C
A N
S L
I M
|
Symbol/Exchange
Company Name
Industry Group |
PRICE |
CHANGE
(%Change) |
Day High |
Volume
(% DAV)
(% 50 day avg vol) |
52 Wk Hi
% From Hi |
Featured
Date |
Price
Featured |
Pivot Featured |
|
Max Buy |
VIT
-
NYSE
Vanceinfo Tech Inc Ads
COMPUTER SOFTWARE and SERVICES - Business Software and Services
|
$33.95
|
-0.48
-1.39% |
$34.52
|
347,517
52.86% of 50 DAV
50 DAV is 657,400
|
$41.06
-17.32%
|
7/8/2010
|
$25.20
|
PP = $26.58
|
|
MB = $27.91
|
Most Recent Note - 12/28/2010 4:18:09 PM
G - Today's 4th consecutive loss on light volume has it further below its 50 DMA line. It would need to rally above that short-term average for its outlook to improve. Based on weakness it will be dropped from the Featured Stocks list tonight. Its Relative Strength rating has slumped since it completed a Public Offering on 11/23/10.
>>> The latest Featured Stock Update with an annotated graph appeared on 12/9/2010. Click here.
View all notes |
Alert me of new notes |
CANSLIM.net Company Profile |
SEC |
Zacks Reports |
StockTalk |
News |
Chart |
Request a new note
C
A N
S L
I M
|