***Last / Change / Volume data in this table is the closing quote data***
Symbol/Exchange
Company Name
Industry Group |
PRICE |
CHANGE
(%Change) |
Day High |
Volume
(% DAV)
(% 50 day avg vol) |
52 Wk Hi
% From Hi |
Featured
Date |
Price
Featured |
Pivot Featured |
|
Max Buy |
ABV
-
NYSE
Comp De Bebidas Adr
FOOD and BEVERAGE - Beverages - Brewers
|
$153.10
|
+1.18
0.78% |
$153.45
|
264,208
44.55% of 50 DAV
50 DAV is 593,000
|
$153.79
-0.45%
|
12/10/2010
|
$139.87
|
PP = $145.46
|
|
MB = $152.73
|
 Most Recent Note - 12/27/2010 3:18:52 PM
G - Hovering near all-time highs, its gain today on light volume has it trading above its "max buy" level and its color code is changed to green. Volume behind its 12/21/10 gain was above average, but lacked truly great conviction. Recent lows in the $133 area define important chart support to watch.
>>> The latest Featured Stock Update with an annotated graph appeared on 12/3/2010. Click here.
View all notes |
Alert me of new notes |
CANSLIM.net Company Profile |
SEC |
Zacks Reports |
StockTalk |
News |
Chart |
Request a new note
C
A N
S L
I M


|
ARUN
-
NASDAQ
Aruba Networks Inc
COMPUTER HARDWARE - Networking andamp; Communication Dev
|
$21.69
|
-0.05
-0.23% |
$22.08
|
2,749,154
115.73% of 50 DAV
50 DAV is 2,375,500
|
$24.28
-10.67%
|
8/30/2010
|
$18.12
|
PP = $18.51
|
|
MB = $19.44
|
Most Recent Note - 12/27/2010 5:52:34 PM
G - Closed below its 50 DMA line today with a loss on slightly above average volume, but well up from the session low. Finishing in the upper third of its intra-day range was an encouraging sign, while a subsequent rebound above its 50 DMA is needed for its outlook to improve.
>>> The latest Featured Stock Update with an annotated graph appeared on 12/14/2010. Click here.
View all notes |
Alert me of new notes |
CANSLIM.net Company Profile |
SEC |
Zacks Reports |
StockTalk |
News |
Chart |
Request a new note
C
A N
S L
I M
|
BIDU
-
NASDAQ
Baidu Inc Ads
INTERNET - Internet Information Providers
|
$100.13
|
-0.03
-0.03% |
$100.20
|
5,512,914
51.09% of 50 DAV
50 DAV is 10,790,500
|
$115.04
-12.96%
|
12/10/2010
|
$108.00
|
PP = $115.14
|
|
MB = $120.90
|
Most Recent Note - 12/27/2010 3:24:32 PM
G - Volume totals have been cooling while it remains slumped below its 50 DMA line. That short-term average may now act as resistance while overhead supply may hinder its upward progress. Based on recent technical weakness it will be dropped from the Featured Stocks list tonight.
>>> The latest Featured Stock Update with an annotated graph appeared on 11/30/2010. Click here.
View all notes |
Alert me of new notes |
CANSLIM.net Company Profile |
SEC |
Zacks Reports |
StockTalk |
News |
Chart |
Request a new note
C
A N
S L
I M
|
CACC
-
NASDAQ
Credit Acceptance Corp
FINANCIAL SERVICES - Credit Services
|
$62.89
|
+0.91
1.47% |
$63.58
|
13,000
58.30% of 50 DAV
50 DAV is 22,300
|
$63.45
-0.88%
|
11/22/2010
|
$59.97
|
PP = $62.00
|
|
MB = $65.10
|
Most Recent Note - 12/27/2010 3:04:52 PM
Y - Quietly touched a new 52-week high earlier this afternoon without great volume conviction behind its gain.
>>> The latest Featured Stock Update with an annotated graph appeared on 12/20/2010. Click here.
View all notes |
Alert me of new notes |
CANSLIM.net Company Profile |
SEC |
Zacks Reports |
StockTalk |
News |
Chart |
Request a new note
C
A N
S L
I M
|
CIS
-
NYSE
Camelot Info Systems Ads
COMPUTER SOFTWARE andamp; SERVICES - Information Technology Service
|
$22.95
|
-0.58
-2.46% |
$23.75
|
219,950
54.13% of 50 DAV
50 DAV is 406,300
|
$24.89
-7.79%
|
11/26/2010
|
$18.93
|
PP = $19.72
|
|
MB = $20.71
|
Most Recent Note - 12/27/2010 5:53:40 PM
G - Quietly consolidating near its all-time high, with no resistance remaining due to overhead supply. Recently completed a Secondary Offering and found support near prior highs in the $19.50 area, but it has not formed a sound new base following its 11/29/10 breakout.
>>> The latest Featured Stock Update with an annotated graph appeared on 11/26/2010. Click here.
View all notes |
Alert me of new notes |
CANSLIM.net Company Profile |
SEC |
Zacks Reports |
StockTalk |
News |
Chart |
Request a new note
C
A N
S L
I M
|
Symbol/Exchange
Company Name
Industry Group |
PRICE |
CHANGE
(%Change) |
Day High |
Volume
(% DAV)
(% 50 day avg vol) |
52 Wk Hi
% From Hi |
Featured
Date |
Price
Featured |
Pivot Featured |
|
Max Buy |
CMG
-
NYSE
Chipotle Mexican Grill
LEISURE - Restaurants
|
$222.73
|
-5.56
-2.44% |
$225.46
|
1,154,742
107.95% of 50 DAV
50 DAV is 1,069,700
|
$262.78
-15.24%
|
9/1/2010
|
$158.31
|
PP = $155.52
|
|
MB = $163.30
|
Most Recent Note - 12/27/2010 12:04:43 PM
G - Concerns are raised after today's gap down under its 50 DMA line and early weakness below its recent chart low ($221.41 on 12/14/10). Technically, it is not near any sound base, while more damaging losses could suggest it is due for a longer and deeper consolidation.
>>> The latest Featured Stock Update with an annotated graph appeared on 12/17/2010. Click here.
View all notes |
Alert me of new notes |
CANSLIM.net Company Profile |
SEC |
Zacks Reports |
StockTalk |
News |
Chart |
Request a new note
C
A N
S L
I M
|
DECK
-
NASDAQ
Deckers Outdoor Corp
CONSUMER NON-DURABLES - Textile - Apparel Footwear
|
$84.96
|
+1.27
1.52% |
$85.00
|
923,469
49.42% of 50 DAV
50 DAV is 1,868,800
|
$87.88
-3.32%
|
10/27/2010
|
$54.16
|
PP = $54.86
|
|
MB = $57.60
|
Most Recent Note - 12/22/2010 1:38:32 PM
G - Not near any sound base, yet stubbornly holding its ground near all-time highs. See the latest FSU analysis for details and an annotated graph.
>>> The latest Featured Stock Update with an annotated graph appeared on 12/16/2010. Click here.
View all notes |
Alert me of new notes |
CANSLIM.net Company Profile |
SEC |
Zacks Reports |
StockTalk |
News |
Chart |
Request a new note
C
A N
S L
I M
|
EZCH
-
NASDAQ
Ezchip Semiconductor Ltd
ELECTRONICS - Semiconductor - Specialized
|
$28.52
|
+0.06
0.21% |
$29.32
|
120,212
43.84% of 50 DAV
50 DAV is 274,200
|
$29.73
-4.07%
|
12/2/2010
|
$27.53
|
PP = $26.00
|
|
MB = $27.30
|
Most Recent Note - 12/27/2010 2:47:01 PM
G - Volume totals have been cooling while consolidating in a tight range near its 52-week high. Prior chart highs in the $26 area define an important technical support level to watch.
>>> The latest Featured Stock Update with an annotated graph appeared on 12/2/2010. Click here.
View all notes |
Alert me of new notes |
CANSLIM.net Company Profile |
SEC |
Zacks Reports |
StockTalk |
News |
Chart |
Request a new note
C
A N
S L
I M
|
EZPW
-
NASDAQ
Ezcorp Inc Cl A
SPECIALTY RETAIL - Specialty Retail, Other
|
$27.54
|
-0.55
-1.96% |
$28.21
|
339,063
96.35% of 50 DAV
50 DAV is 351,900
|
$28.75
-4.21%
|
11/5/2010
|
$24.02
|
PP = $23.85
|
|
MB = $25.04
|
Most Recent Note - 12/27/2010 2:48:34 PM
G - Hovering near its 52-week high, recently noted - "Stubbornly holding its ground after recent volume-driven gains, extended from a sound base pattern. Its 50 DMA line defines important support."
>>> The latest Featured Stock Update with an annotated graph appeared on 11/6/2010. Click here.
View all notes |
Alert me of new notes |
CANSLIM.net Company Profile |
SEC |
Zacks Reports |
StockTalk |
News |
Chart |
Request a new note
C
A N
S L
I M
|
FFIV
-
NASDAQ
F 5 Networks Inc
INTERNET - Internet Software and Services
|
$134.90
|
-0.70
-0.52% |
$135.70
|
801,170
27.58% of 50 DAV
50 DAV is 2,905,300
|
$143.75
-6.16%
|
6/16/2010
|
$74.50
|
PP = $74.10
|
|
MB = $77.81
|
Most Recent Note - 12/27/2010 3:01:31 PM
G - Volume totals have been cooling while consolidating in a tight range only -6% off its all-time high. Its recent low ($129.59 on 12/16/10) defines initial chart support well above its 50 DMA line.
>>> The latest Featured Stock Update with an annotated graph appeared on 11/15/2010. Click here.
View all notes |
Alert me of new notes |
CANSLIM.net Company Profile |
SEC |
Zacks Reports |
StockTalk |
News |
Chart |
Request a new note
C
A N
S L
I M
|
Symbol/Exchange
Company Name
Industry Group |
PRICE |
CHANGE
(%Change) |
Day High |
Volume
(% DAV)
(% 50 day avg vol) |
52 Wk Hi
% From Hi |
Featured
Date |
Price
Featured |
Pivot Featured |
|
Max Buy |
FOSL
-
NASDAQ
Fossil Inc
CONSUMER DURABLES - Recreational Goods, Other
|
$71.28
|
-1.25
-1.72% |
$72.63
|
543,582
68.50% of 50 DAV
50 DAV is 793,500
|
$74.34
-4.12%
|
11/26/2010
|
$69.10
|
PP = $70.17
|
|
MB = $73.68
|
Most Recent Note - 12/22/2010 5:43:10 PM
Y - Still consolidating above prior highs, only -3.3% off its all-time high. Volume totals have been cooling since its technical breakout on 12/02/10 from an advanced "3-weeks tight" pattern.
>>> The latest Featured Stock Update with an annotated graph appeared on 11/29/2010. Click here.
View all notes |
Alert me of new notes |
CANSLIM.net Company Profile |
SEC |
Zacks Reports |
StockTalk |
News |
Chart |
Request a new note
C
A N
S L
I M
|
HMSY
-
NASDAQ
H M S Holdings Corp
COMPUTER SOFTWARE and SERVICES - Healthcare Information Service
|
$65.17
|
-0.48
-0.73% |
$65.87
|
62,102
30.91% of 50 DAV
50 DAV is 200,900
|
$67.10
-2.88%
|
11/19/2010
|
$61.89
|
PP = $63.01
|
|
MB = $66.16
|
Most Recent Note - 12/22/2010 5:45:27 PM
G - Touched a new high after a strong start today, but it reversed into the red for the close for a small loss on light volume. Prior highs in the $62 define initial chart support to watch above its 50 DMA line. Its Relative Strength rank has slumped to 74, below the 80+ guideline.
>>> The latest Featured Stock Update with an annotated graph appeared on 11/19/2010. Click here.
View all notes |
Alert me of new notes |
CANSLIM.net Company Profile |
SEC |
Zacks Reports |
StockTalk |
News |
Chart |
Request a new note
C
A N
S L
I M
|
JOBS
-
NASDAQ
Fifty One Job Inc Ads
DIVERSIFIED SERVICES - Staffing and; Outsourcing Service
|
$48.65
|
-1.35
-2.70% |
$50.03
|
151,051
82.86% of 50 DAV
50 DAV is 182,300
|
$55.50
-12.34%
|
10/13/2010
|
$42.07
|
PP = $40.60
|
|
MB = $42.63
|
Most Recent Note - 12/27/2010 2:37:07 PM
G - Considerable loss today, trading near its 50 DMA line and recent lows. Recently noted as extended from any sound base, consolidating after nearly challenging its all-time high near $55 from 2004.
>>> The latest Featured Stock Update with an annotated graph appeared on 11/16/2010. Click here.
View all notes |
Alert me of new notes |
CANSLIM.net Company Profile |
SEC |
Zacks Reports |
StockTalk |
News |
Chart |
Request a new note
C
A N
S L
I M
|
LULU
-
NASDAQ
Lululemon Athletica
MANUFACTURING - Textile Manufacturing
|
$71.72
|
+0.53
0.74% |
$72.06
|
755,574
46.17% of 50 DAV
50 DAV is 1,636,400
|
$74.60
-3.86%
|
10/8/2010
|
$47.66
|
PP = $46.67
|
|
MB = $49.00
|
Most Recent Note - 12/22/2010 1:46:15 PM
G - Pulling back today without great volume conviction, still perched near its all-time high. There is no near-term chart support while it is extended from its 50 DMA line (now $52.81).
>>> The latest Featured Stock Update with an annotated graph appeared on 12/1/2010. Click here.
View all notes |
Alert me of new notes |
CANSLIM.net Company Profile |
SEC |
Zacks Reports |
StockTalk |
News |
Chart |
Request a new note
C
A N
S L
I M
|
MWIV
-
NASDAQ
M W I Veterinary Supply
HEALTH SERVICES - Medical Instruments and; Supplies
|
$65.55
|
+1.01
1.56% |
$65.75
|
91,772
157.96% of 50 DAV
50 DAV is 58,100
|
$65.28
0.42%
|
11/4/2010
|
$61.79
|
PP = $59.60
|
|
MB = $62.58
|
Most Recent Note - 12/27/2010 2:55:04 PM
G - Hit another new 52-week high with a 6th consecutive gain, rallying with above average volume.
>>> The latest Featured Stock Update with an annotated graph appeared on 12/21/2010. Click here.
View all notes |
Alert me of new notes |
CANSLIM.net Company Profile |
SEC |
Zacks Reports |
StockTalk |
News |
Chart |
Request a new note
C
A N
S L
I M
|
Symbol/Exchange
Company Name
Industry Group |
PRICE |
CHANGE
(%Change) |
Day High |
Volume
(% DAV)
(% 50 day avg vol) |
52 Wk Hi
% From Hi |
Featured
Date |
Price
Featured |
Pivot Featured |
|
Max Buy |
NEOG
-
NASDAQ
Neogen Corp
DRUGS - Diagnostic Substances
|
$41.89
|
+0.01
0.02% |
$42.47
|
71,551
86.94% of 50 DAV
50 DAV is 82,300
|
$42.00
-0.26%
|
9/1/2010
|
$30.79
|
PP = $30.49
|
|
MB = $32.01
|
Most Recent Note - 12/27/2010 12:31:29 PM
G - Touched yet another new high today with a small gain. It may go on to produce more climactic gains while unhindered by resistance due to overhead supply. It has been noted repeatedly as extended from any sound base after steadily advancing. Its 50 DMA line has been a reliable support level.
>>> The latest Featured Stock Update with an annotated graph appeared on 12/6/2010. Click here.
View all notes |
Alert me of new notes |
CANSLIM.net Company Profile |
SEC |
Zacks Reports |
StockTalk |
News |
Chart |
Request a new note
C
A N
S L
I M
|
NFLX
-
NASDAQ
Netflix Inc
SPECIALTY RETAIL - Music and Video Stores
|
$180.01
|
-4.57
-2.48% |
$180.84
|
3,740,914
60.03% of 50 DAV
50 DAV is 6,231,700
|
$206.80
-12.95%
|
11/9/2010
|
$173.10
|
PP = $184.84
|
|
MB = $194.08
|
Most Recent Note - 12/27/2010 2:39:54 PM
G - Small gap down today with light volume, consolidating near its 50 DMA line and recent lows defining near-term support. More damaging losses could trigger technical sell signals.
>>> The latest Featured Stock Update with an annotated graph appeared on 11/24/2010. Click here.
View all notes |
Alert me of new notes |
CANSLIM.net Company Profile |
SEC |
Zacks Reports |
StockTalk |
News |
Chart |
Request a new note
C
A N
S L
I M
|
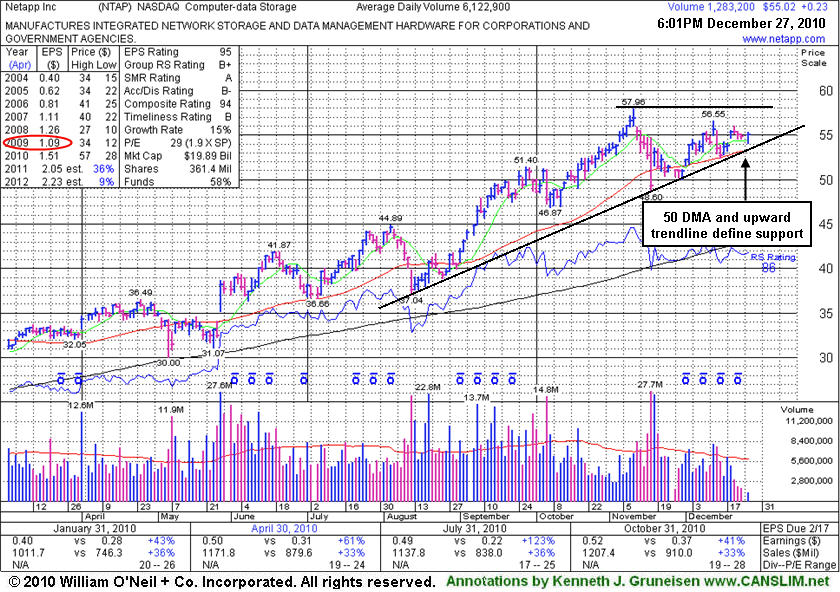
NTAP
-
NASDAQ
Netapp Inc
COMPUTER HARDWARE - Data Storage Devices
|
$55.02
|
+0.23
0.42% |
$55.29
|
1,284,797
20.98% of 50 DAV
50 DAV is 6,122,900
|
$57.96
-5.07%
|
9/8/2010
|
$46.98
|
PP = $44.99
|
|
MB = $47.24
|
Most Recent Note - 12/27/2010 3:13:32 PM
G - Volume totals have been cooling while consolidating above its 50 DMA line and working on building a new base.
>>> The latest Featured Stock Update with an annotated graph appeared on 12/27/2010. Click here.
View all notes |
Alert me of new notes |
CANSLIM.net Company Profile |
SEC |
Zacks Reports |
StockTalk |
News |
Chart |
Request a new note
C
A N
S L
I M
|
ORCL
-
NASDAQ
Oracle Corp
COMPUTER SOFTWARE and SERVICES - Application Software
|
$31.66
|
+0.12
0.38% |
$31.80
|
13,821,207
44.11% of 50 DAV
50 DAV is 31,334,900
|
$32.27
-1.89%
|
12/7/2010
|
$29.05
|
PP = $29.92
|
|
MB = $31.42
|
Most Recent Note - 12/27/2010 3:10:22 PM
G - Volume totals have recently been light while stubbornly holding its ground in a tight range following its considerable 12/17/10 gap up gain on heavy volume. It is extended from a sound base, with support at prior chart highs and its 50 DMA line.
>>> The latest Featured Stock Update with an annotated graph appeared on 11/18/2010. Click here.
View all notes |
Alert me of new notes |
CANSLIM.net Company Profile |
SEC |
Zacks Reports |
StockTalk |
News |
Chart |
Request a new note
C
A N
S L
I M
|
PAY
-
NYSE
Verifone Systems Inc
COMPUTER HARDWARE - Transaction Automation Systems
|
$39.22
|
+0.01
0.03% |
$39.38
|
449,522
29.49% of 50 DAV
50 DAV is 1,524,200
|
$41.47
-5.43%
|
11/29/2010
|
$33.96
|
PP = $36.04
|
|
MB = $37.84
|
Most Recent Note - 12/22/2010 4:49:58 PM
G - Consolidating -6.7% off its all-time high, extended from its prior base. The old high in the $36 area nearly coincides with its 50 DMA line, defining important support to watch.
>>> The latest Featured Stock Update with an annotated graph appeared on 12/15/2010. Click here.
View all notes |
Alert me of new notes |
CANSLIM.net Company Profile |
SEC |
Zacks Reports |
StockTalk |
News |
Chart |
Request a new note
C
A N
S L
I M
|
Symbol/Exchange
Company Name
Industry Group |
PRICE |
CHANGE
(%Change) |
Day High |
Volume
(% DAV)
(% 50 day avg vol) |
52 Wk Hi
% From Hi |
Featured
Date |
Price
Featured |
Pivot Featured |
|
Max Buy |
RAX
-
NYSE
Rackspace Hosting Inc
INTERNET - Internet Software and; Services
|
$31.10
|
+0.37
1.20% |
$31.31
|
723,099
38.04% of 50 DAV
50 DAV is 1,901,000
|
$32.69
-4.86%
|
9/21/2010
|
$22.84
|
PP = $23.61
|
|
MB = $24.79
|
Most Recent Note - 12/22/2010 4:53:17 PM
G - Volume totals have been cooling while stubbornly holding its ground since hitting its 12/10/10 all-time high. No resistance remains due to overhead supply, but it is extended from any sound base.
>>> The latest Featured Stock Update with an annotated graph appeared on 11/17/2010. Click here.
View all notes |
Alert me of new notes |
CANSLIM.net Company Profile |
SEC |
Zacks Reports |
StockTalk |
News |
Chart |
Request a new note
C
A N
S L
I M
|
ROVI
-
NASDAQ
Rovi Corp
COMPUTER SOFTWARE andamp; SERVICES - Security Software andamp; Services
|
$57.60
|
+0.34
0.59% |
$57.84
|
1,018,702
93.27% of 50 DAV
50 DAV is 1,092,200
|
$59.06
-2.47%
|
10/29/2010
|
$49.99
|
PP = $53.10
|
|
MB = $55.76
|
Most Recent Note - 12/27/2010 12:37:14 PM
G - Holding its ground today following a loss on 12/23/10 with above average volume after reporting plans to acquire Sonic Solutions (SNIC) in a $720 Million deal. It is extended from its latest base after wedging to highs without great volume conviction. Prior chart highs and its 50 DMA line define important support to watch.
>>> The latest Featured Stock Update with an annotated graph appeared on 12/13/2010. Click here.
View all notes |
Alert me of new notes |
CANSLIM.net Company Profile |
SEC |
Zacks Reports |
StockTalk |
News |
Chart |
Request a new note
C
A N
S L
I M
|
SHOO
-
NASDAQ
Steven Madden Limited
CONSUMER NON-DURABLES - Textile - Apparel Footwear
|
$44.47
|
+0.12
0.27% |
$44.63
|
167,364
46.91% of 50 DAV
50 DAV is 356,800
|
$47.69
-6.75%
|
11/23/2010
|
$44.61
|
PP = $44.95
|
|
MB = $47.20
|
Most Recent Note - 12/22/2010 5:25:50 PM
G - Closed near the session low today, slumping amid widespread weakness Retail/Apparel stocks. The slump back below its old high closes raised concerns, and its 50 DMA line and recent lows define important support to watch, where violations would raise more serious concerns and trigger technical sell signals.
>>> The latest Featured Stock Update with an annotated graph appeared on 11/23/2010. Click here.
View all notes |
Alert me of new notes |
CANSLIM.net Company Profile |
SEC |
Zacks Reports |
StockTalk |
News |
Chart |
Request a new note
C
A N
S L
I M
|
SLW
-
NYSE
Silver Wheaton Corp
METALS and; MINING - Silver
|
$36.57
|
-0.17
-0.46% |
$37.09
|
3,336,131
31.89% of 50 DAV
50 DAV is 10,460,000
|
$42.34
-13.63%
|
8/25/2010
|
$21.40
|
PP = $21.99
|
|
MB = $23.09
|
Most Recent Note - 12/22/2010 5:30:40 PM
G - Loss today on light volume led to its lowest close since 11/29/10, testing prior chart highs in the $36-37 area previously noted as initial support above its 50 DMA line. Gains in recent weeks lacked volume conviction while distributional pressure has been an ongoing concern since its negative reversal at an all-time high on 12/07/10.
>>> The latest Featured Stock Update with an annotated graph appeared on 12/8/2010. Click here.
View all notes |
Alert me of new notes |
CANSLIM.net Company Profile |
SEC |
Zacks Reports |
StockTalk |
News |
Chart |
Request a new note
C
A N
S L
I M
|
UA
-
NYSE
Under Armour Inc Cl A
CONSUMER NON-DURABLES - Textile - Apparel Clothing
|
$54.50
|
-0.35
-0.64% |
$54.85
|
268,112
36.36% of 50 DAV
50 DAV is 737,300
|
$60.14
-9.38%
|
9/9/2010
|
$39.99
|
PP = $40.10
|
|
MB = $42.11
|
Most Recent Note - 12/22/2010 1:35:48 PM
G - Down today for a considerable loss with volume increasing while slumping toward last week's low. The recent chart low ($53.60) and its 50 DMA line ($52.37 now) define important support levels to watch.
>>> The latest Featured Stock Update with an annotated graph appeared on 12/23/2010. Click here.
View all notes |
Alert me of new notes |
CANSLIM.net Company Profile |
SEC |
Zacks Reports |
StockTalk |
News |
Chart |
Request a new note
C
A N
S L
I M
|
Symbol/Exchange
Company Name
Industry Group |
PRICE |
CHANGE
(%Change) |
Day High |
Volume
(% DAV)
(% 50 day avg vol) |
52 Wk Hi
% From Hi |
Featured
Date |
Price
Featured |
Pivot Featured |
|
Max Buy |
ULTA
-
NASDAQ
Ulta Salon Cosm & Frag
SPECIALTY RETAIL - Specialty Retail, Other
|
$34.15
|
-0.59
-1.70% |
$34.84
|
297,734
53.69% of 50 DAV
50 DAV is 554,500
|
$37.24
-8.30%
|
9/3/2010
|
$26.36
|
PP = $25.89
|
|
MB = $27.18
|
Most Recent Note - 12/27/2010 2:43:04 PM
G - Quietly consolidating just above its 50 DMA line. Subsequent deterioration below it or the most recent chart low ($32.01 on 12/15/10) could raise concerns and trigger technical sell signals.
>>> The latest Featured Stock Update with an annotated graph appeared on 12/22/2010. Click here.
View all notes |
Alert me of new notes |
CANSLIM.net Company Profile |
SEC |
Zacks Reports |
StockTalk |
News |
Chart |
Request a new note
C
A N
S L
I M
|
VIT
-
NYSE
Vanceinfo Tech Inc Ads
COMPUTER SOFTWARE and SERVICES - Business Software and Services
|
$34.43
|
-0.02
-0.06% |
$34.51
|
412,944
62.81% of 50 DAV
50 DAV is 657,400
|
$41.06
-16.15%
|
7/8/2010
|
$25.20
|
PP = $26.58
|
|
MB = $27.91
|
Most Recent Note - 12/22/2010 5:35:43 PM
G - The longer it remains below its 50 DMA line, the worse the outlook gets, and any violation of its recent low ($33.71 on 12/15/10) would raise greater concerns and trigger additional sell signals. It has been enduring worrisome distributional pressure and its Relative Strength has slumped since it completed a Public Offering on 11/23/10.
>>> The latest Featured Stock Update with an annotated graph appeared on 12/9/2010. Click here.
View all notes |
Alert me of new notes |
CANSLIM.net Company Profile |
SEC |
Zacks Reports |
StockTalk |
News |
Chart |
Request a new note
C
A N
S L
I M
|