You are not logged in.
This means you
CAN ONLY VIEW reports that were published prior to Monday, April 14, 2025.
You
MUST UPGRADE YOUR MEMBERSHIP if you want to see any current reports.
AFTER MARKET UPDATE - MONDAY, DECEMBER 24TH, 2012
Previous After Market Report Next After Market Report >>>
|
|
|
|
DOW |
-51.76 |
13,139.08 |
-0.39% |
|
Volume |
286,479,620 |
-85% |
|
Volume |
604,030,970 |
-75% |
|
NASDAQ |
-8.41 |
3,012.60 |
-0.28% |
|
Advancers |
1,187 |
38% |
|
Advancers |
906 |
36% |
|
S&P 500 |
-3.49 |
1,426.66 |
-0.24% |
|
Decliners |
1,757 |
57% |
|
Decliners |
1,512 |
60% |
|
Russell 2000 |
-3.18 |
844.74 |
-0.38% |
|
52 Wk Highs |
55 |
|
|
52 Wk Highs |
29 |
|
|
S&P 600 |
-1.56 |
474.17 |
-0.33% |
|
52 Wk Lows |
18 |
|
|
52 Wk Lows |
18 |
|
|
 |
Major Averages End Shortened Session With Losses
Kenneth J. Gruneisen - Passed the CAN SLIM® Master's Exam
The major averages lost ground on Monday's shortened trading session while the volume totals were reported much lighter on both the NYSE and the Nasdaq exchange. Breadth was negative as decliners led advancers by about a 3-2 margin on the NYSE and on the Nasdaq exchange. The total number of stocks hitting new 52-week highs again contracted but still outnumbered new 52-week lows on the NYSE and on the Nasdaq exchange. There were 22 high-ranked companies from the CANSLIM.net Leaders List making new 52-week highs and appearing on the CANSLIM.net BreakOuts Page, down from the prior session total of 29 stocks. Any sustainable rally requires a healthy crop of companies hitting new 52-week highs, so it is an encouraging sign to see meaningful leadership. There were gains for only 2 of the 12 high-ranked companies currently included on the Featured Stocks Page.
The major averages were lower on Monday's holiday shortened session amid uncertainty a deal will be reached to avoid the fiscal cliff. With Congress on hiatus for the Christmas holiday, talks on the scheduled tax increases and spending cuts are on hold until Thursday.
Energy stocks were weaker on the session as crude oil prices edged lower. Shares of BP Plc (BP -1.69%) were down after a federal judge approved the company's $7.8 billion settlement from the 2010 Gulf oil spill. Regions Financial (RF -0.95%) shares were off following a Wall Street Journal report that said regulators were looking into claims that the bank improperly classified loans during the 2008 financial crisis. In tech, Microsoft Corp (MSFT -1.42%) was lower on reports that the company’s new Windows platform was not being received as well as previous versions.
Treasuries were lower with the 10-year note down 3/32 to yield 1.77%.
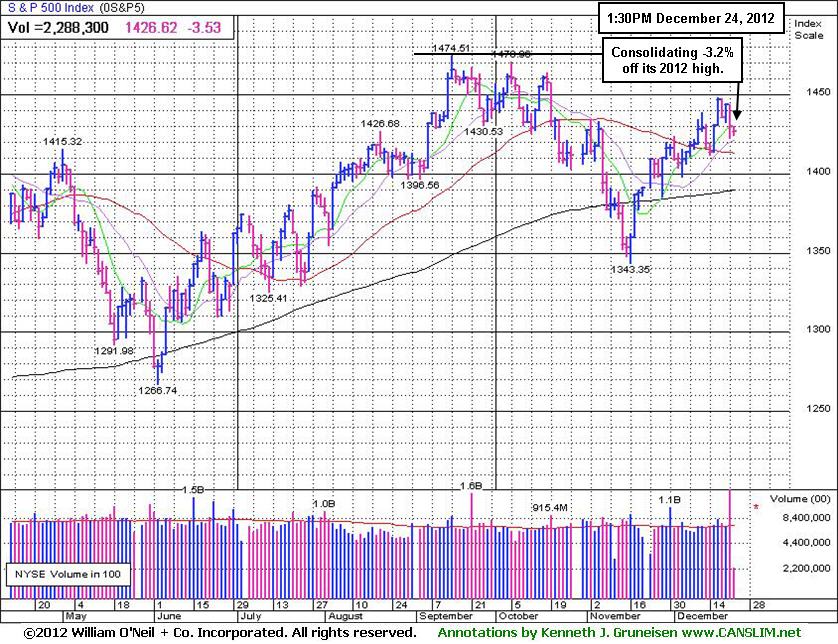
Technically, the market direction (M criteria) remains in a confirmed uptrend. The Nasdaq Composite Index, benchmark S&P 500 Index, and the Dow Jones Industrial Average are again collectively rallying above their respective 50-day moving average (DMA) lines. New buying efforts may be justified only in worthy high-ranked leaders. See the noteworthy companies included on the Featured Stocks Page.
Watch for an announcement via email concerning the next WEBCAST. The webcast will also be available via an updated link highlighted at the top of the Premium Member Homepage.
PICTURED: The S&P 500 Index is consolidating -3.2% off its 2012 high.
|
 Kenneth J. Gruneisen started out as a licensed stockbroker in August 1987, a couple of months prior to the historic stock market crash that took the Dow Jones Industrial Average down -22.6% in a single day. He has published daily fact-based fundamental and technical analysis on high-ranked stocks online for two decades. Through FACTBASEDINVESTING.COM, Kenneth provides educational articles, news, market commentary, and other information regarding proven investment systems that work in good times and bad.
Comments contained in the body of this report are technical opinions only and are not necessarily those of Gruneisen Growth Corp. The material herein has been obtained from sources believed to be reliable and accurate, however, its accuracy and completeness cannot be guaranteed. Our firm, employees, and customers may effect transactions, including transactions contrary to any recommendation herein, or have positions in the securities mentioned herein or options with respect thereto. Any recommendation contained in this report may not be suitable for all investors and it is not to be deemed an offer or solicitation on our part with respect to the purchase or sale of any securities. |
|
 |
Energy, Tech, and Financial Groups Edged Lower
Kenneth J. Gruneisen - Passed the CAN SLIM® Master's Exam
Weakness in energy-related shares led to modest losses for the Integrated Oil Index ($XOI -0.80%) and Oil Services Index ($OSX -0.68%). Weakness in financial shares created a drag on the major averages as the Bank Index ($BKX -0.41%) and Broker/Dealer Index ($XBD -0.40%) edged lower. The tech sector saw unanimous small losses from the Internet Index ($IIX -0.62%), Semiconductor Index ($SOX -0.38%), Networking Index ($NWX -0.25%), and Biotechnology Index ($BTK -0.24%). The Retail Index ($RLX +0.15%) and Gold & Silver Index ($XAU +0.19%) inched higher while the Healthcare Index ($HMO -0.45%) suffered a modest loss.
Charts courtesy www.stockcharts.com
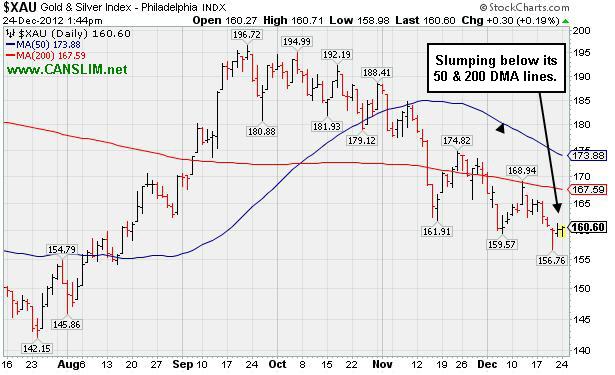
PICTURED: The Gold & Silver Index ($XAU +0.19%) has been continually slumping below its 50-day and 200-day moving average (DMA) lines.
| Oil Services |
$OSX |
219.53 |
-1.51 |
-0.68% |
+1.50% |
| Healthcare |
$HMO |
2,514.74 |
-11.35 |
-0.45% |
+10.22% |
| Integrated Oil |
$XOI |
1,242.82 |
-10.01 |
-0.80% |
+1.12% |
| Semiconductor |
$SOX |
384.14 |
-1.45 |
-0.38% |
+5.41% |
| Networking |
$NWX |
228.36 |
-0.57 |
-0.25% |
+6.14% |
| Internet |
$IIX |
326.50 |
-2.04 |
-0.62% |
+15.89% |
| Broker/Dealer |
$XBD |
92.74 |
-0.38 |
-0.40% |
+11.37% |
| Retail |
$RLX |
654.07 |
+0.97 |
+0.15% |
+25.01% |
| Gold & Silver |
$XAU |
160.60 |
+0.30 |
+0.19% |
-11.09% |
| Bank |
$BKX |
51.07 |
-0.21 |
-0.41% |
+29.69% |
| Biotech |
$BTK |
1,548.65 |
-3.77 |
-0.24% |
+41.89% |
|
|
|
 |
Encountered Stubborn Resistance Yet Remains Near Highs
Kenneth J. Gruneisen - Passed the CAN SLIM® Master's Exam
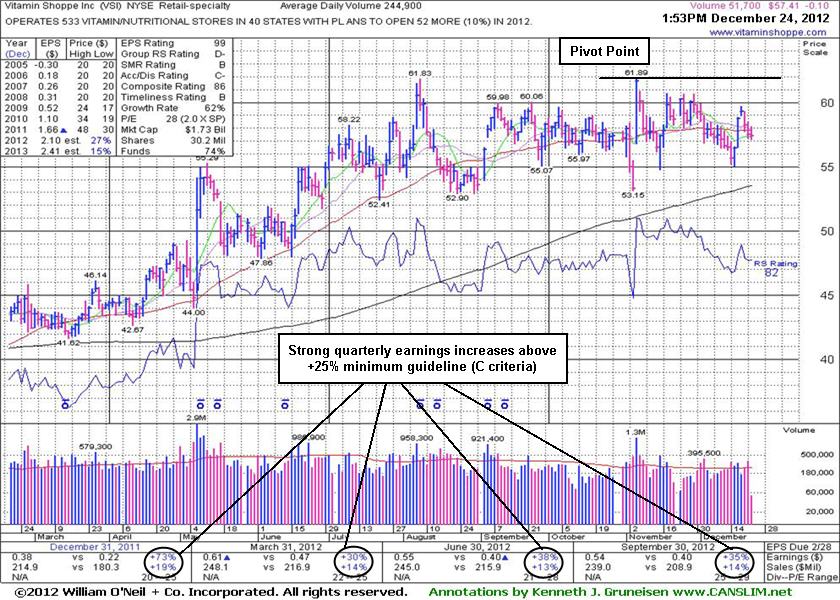
Vitamin Shoppe Inc (VSI -$0.10 or -0.17% to $57.41) is slumping below its 50-day moving average (DMA) line again with a small loss on light volume. While struggling its color code was changed to green. The $61 area has been a stubborn resistance level in recent months.
It was last shown in this FSU section on 12/03/12 with and annotated graph under the headline, ''Mild Distribution Day While Consolidating Above 50-Day Moving Average." It is still perched within close striking distance of its 52-week high. The prior article cautioned - "It could stay confined to that range for a long time, so disciplined investors will keep an eye on it until it shows conviction. A new pivot point is being cited based on its 11/06/12 high plus 10 cents. Subsequent volume-driven gains above that level could trigger a new technical buy signal." Prior reports also noted its waning Group Relative Strength Rating as a cause for concern.
An indication it may find good support from the institutional crowd is that the number of top-rated funds owning its shares has risen from 288 in Jun '11 to 395 in Sep '12, a reassuring sign concerning the I criteria. It released better than expected earnings +35% on +14% sales revenues for the Sep '12 quarter. Fundamentally, it has earned high ranks after showing strong quarterly and annual earnings increases satisfying the C and A criteria. Vitamin Shoppe has 30.2 million shares outstanding. That small supply is not a bad thing, but could contribute to greater price volatility. Historic studies have shown that once companies have grown their supply (S criteria) of shares outstanding to hundreds of millions, or even billions of shares outstanding, they are less likely candidates to be "above average" gainers.
|
|
|
Color Codes Explained :
Y - Better candidates highlighted by our
staff of experts.
G - Previously featured
in past reports as yellow but may no longer be buyable under the
guidelines.
***Last / Change / Volume data in this table is the closing quote data***
Symbol/Exchange
Company Name
Industry Group |
PRICE |
CHANGE
(%Change) |
Day High |
Volume
(% DAV)
(% 50 day avg vol) |
52 Wk Hi
% From Hi |
Featured
Date |
Price
Featured |
Pivot Featured |
|
Max Buy |
CELG
-
NASDAQ
Celgene Corp
DRUGS - Drug Manufacturers - Major
|
$79.27
|
-0.43
-0.54% |
$79.44
|
1,419,174
48.84% of 50 DAV
50 DAV is 2,905,800
|
$82.78
-4.24%
|
12/11/2012
|
$82.24
|
PP = $81.34
|
|
MB = $85.41
|
Most Recent Note - 12/21/2012 12:06:59 PM
Y - Down with above average volume today after a small gap down, enduring distributional pressure amid weakness in the broader market. Slumped below its pivot point following a technical buy signal on 12/11/12, however its small losses lacked great volume conviction. Disciplined investors always limit losses if any stock falls -7% from their purchase price.
>>> The latest Featured Stock Update with an annotated graph appeared on 12/12/2012. Click here.
View all notes |
Alert me of new notes |
CANSLIM.net Company Profile |
SEC |
Zacks Reports |
StockTalk |
News |
Chart |
Request a new note
C
A N
S L
I M


|
CFNL
-
NASDAQ
Cardinal Financial Corp
BANKING - Regional - Southeast Banks
|
$16.12
|
-0.18
-1.10% |
$16.32
|
46,349
21.95% of 50 DAV
50 DAV is 211,200
|
$16.66
-3.24%
|
12/3/2012
|
$15.20
|
PP = $16.31
|
|
MB = $17.13
|
Most Recent Note - 12/20/2012 11:14:30 AM
Y - Today's 4th consecutive gain has it hitting a new 52-week high and rallying above its pivot point. A strong gain backed by at least +40% above average volume may trigger a proper new (or add-on) technical buy signal.
>>> The latest Featured Stock Update with an annotated graph appeared on 12/10/2012. Click here.
View all notes |
Alert me of new notes |
CANSLIM.net Company Profile |
SEC |
Zacks Reports |
StockTalk |
News |
Chart |
Request a new note
C
A N
S L
I M
|
CMCSA
-
NASDAQ
Comcast Corp Cl A
MEDIA - CATV Systems
|
$37.36
|
+0.13
0.35% |
$37.46
|
3,393,502
27.58% of 50 DAV
50 DAV is 12,302,400
|
$38.22
-2.25%
|
12/3/2012
|
$37.08
|
PP = $38.06
|
|
MB = $39.96
|
Most Recent Note - 12/21/2012 12:09:44 PM
Y - Small gap down for a loss with above average volume amid widespread weakness today. It did not trigger a buy signal since previously noted with caution - "Disciplined investors will watch for gains above the pivot point backed by at least the bare minimum +40% above average volume threshold to trigger a proper new (or add-on) technical buy signal before taking action."
>>> The latest Featured Stock Update with an annotated graph appeared on 12/7/2012. Click here.
View all notes |
Alert me of new notes |
CANSLIM.net Company Profile |
SEC |
Zacks Reports |
StockTalk |
News |
Chart |
Request a new note
C
A N
S L
I M
|
MIDD
-
NASDAQ
Middleby Corp
MANUFACTURING - Diversified Machinery
|
$126.90
|
-0.80
-0.63% |
$127.44
|
13,351
15.12% of 50 DAV
50 DAV is 88,300
|
$134.51
-5.66%
|
10/8/2012
|
$118.46
|
PP = $122.67
|
|
MB = $128.80
|
Most Recent Note - 12/21/2012 5:35:21 PM
G - Down today for a 3rd consecutive loss with above average volume, enduring distributional pressure after a negative reversal on 12/19/12 at its new 52-week and all-time high. Earnings +23% on +18% sales for the Sep '12 quarter, below the +25% minimum earnings guideline (C criteria), raised concerns.
>>> The latest Featured Stock Update with an annotated graph appeared on 12/6/2012. Click here.
View all notes |
Alert me of new notes |
CANSLIM.net Company Profile |
SEC |
Zacks Reports |
StockTalk |
News |
Chart |
Request a new note
C
A N
S L
I M
|
N
-
NYSE
Netsuite Inc
DIVERSIFIED SERVICES - Business/Management Services
|
$66.97
|
-0.08
-0.12% |
$67.00
|
118,541
25.55% of 50 DAV
50 DAV is 464,000
|
$67.82
-1.25%
|
12/12/2012
|
$64.75
|
PP = $67.12
|
|
MB = $70.48
|
 Most Recent Note - 12/24/2012 2:10:00 PM
Y - Hovering in a tight range near its 52-week high and its pivot point. Disciplined investors know that volume must be at least +40% above average behind gains above the pivot point to trigger a proper technical buy signal.
>>> The latest Featured Stock Update with an annotated graph appeared on 12/13/2012. Click here.
View all notes |
Alert me of new notes |
CANSLIM.net Company Profile |
SEC |
Zacks Reports |
StockTalk |
News |
Chart |
Request a new note
C
A N
S L
I M
|
Symbol/Exchange
Company Name
Industry Group |
PRICE |
CHANGE
(%Change) |
Day High |
Volume
(% DAV)
(% 50 day avg vol) |
52 Wk Hi
% From Hi |
Featured
Date |
Price
Featured |
Pivot Featured |
|
Max Buy |
NSR
-
NYSE
Neustar Inc
TELECOMMUNICATIONS - Diversified Communication Serv
|
$42.62
|
+0.30
0.71% |
$42.70
|
118,722
32.61% of 50 DAV
50 DAV is 364,100
|
$43.85
-2.81%
|
12/11/2012
|
$41.85
|
PP = $41.41
|
|
MB = $43.48
|
Most Recent Note - 12/21/2012 3:56:27 PM
Y - Retreating from its 52-week high with above average volume behind today's 3rd consecutive small loss, yet it remains above its pivot point. Prior highs near $41 define initial support to watch on pullbacks.
>>> The latest Featured Stock Update with an annotated graph appeared on 12/11/2012. Click here.
View all notes |
Alert me of new notes |
CANSLIM.net Company Profile |
SEC |
Zacks Reports |
StockTalk |
News |
Chart |
Request a new note
C
A N
S L
I M
|
RAX
-
NYSE
Rackspace Hosting Inc
INTERNET - Internet Software and; Services
|
$72.71
|
-0.15
-0.21% |
$72.83
|
344,018
22.61% of 50 DAV
50 DAV is 1,521,200
|
$73.86
-1.56%
|
12/18/2012
|
$71.88
|
PP = $70.10
|
|
MB = $73.61
|
Most Recent Note - 12/24/2012 1:21:03 PM
Y - Holding its ground stubbornly since its volume-driven gain on 12/18/12 above its new pivot point triggered a new (or add-on) technical buy signal. Prior highs in the $70 area define initial support to watch on pullbacks.
>>> The latest Featured Stock Update with an annotated graph appeared on 12/18/2012. Click here.
View all notes |
Alert me of new notes |
CANSLIM.net Company Profile |
SEC |
Zacks Reports |
StockTalk |
News |
Chart |
Request a new note
C
A N
S L
I M
|
RNF
-
NYSE
Rentech Nitrogen Ptnr Lp
CHEMICALS - Agricultural Chemicals
|
$37.72
|
-0.46
-1.20% |
$38.05
|
69,874
23.49% of 50 DAV
50 DAV is 297,500
|
$41.15
-8.34%
|
11/1/2012
|
$39.11
|
PP = $40.15
|
|
MB = $42.16
|
Most Recent Note - 12/24/2012 1:29:33 PM
Y - Quietly consolidating near its 50 DMA line. Disciplined investors may still be watching for volume-driven gains for a new high close to trigger a technical buy signal.
>>> The latest Featured Stock Update with an annotated graph appeared on 12/19/2012. Click here.
View all notes |
Alert me of new notes |
CANSLIM.net Company Profile |
SEC |
Zacks Reports |
StockTalk |
News |
Chart |
Request a new note
C
A N
S L
I M
|
ULTA
-
NASDAQ
Ulta Salon Cosm & Frag
SPECIALTY RETAIL - Specialty Retail, Other
|
$97.10
|
-0.13
-0.13% |
$97.49
|
138,727
17.17% of 50 DAV
50 DAV is 808,100
|
$103.52
-6.20%
|
12/4/2012
|
$100.29
|
PP = $103.62
|
|
MB = $108.80
|
Most Recent Note - 12/21/2012 5:32:43 PM
Y - Consolidating above its 50 DMA line which recently acted as support. Waning Relative Strength rating, below the 80+ minimum guideline for buy candidates, is a concern. See the latest FSU analysis for more details and a new annotated graph.
>>> The latest Featured Stock Update with an annotated graph appeared on 12/21/2012. Click here.
View all notes |
Alert me of new notes |
CANSLIM.net Company Profile |
SEC |
Zacks Reports |
StockTalk |
News |
Chart |
Request a new note
C
A N
S L
I M
|
VRX
-
NYSE
Valeant Pharmaceuticals
DRUGS - Drug Manufacturers - Other
|
$60.39
|
-0.45
-0.74% |
$61.09
|
652,504
47.02% of 50 DAV
50 DAV is 1,387,800
|
$61.11
-1.18%
|
12/20/2012
|
$60.24
|
PP = $61.21
|
|
MB = $64.27
|
Most Recent Note - 12/20/2012 5:21:06 PM
Y - Rallied with +92% above average volume but failed to rise above its pivot point cited based on its 9/07/12 high plus 10 cents after highlighted in yellow in the earlier mid-day report. Encountered stubborn resistance in prior months near the $60-61 area. Disciplined investors may watch for a volume-driven gain above its pivot point to trigger a technical buy signal before taking action. Quarterly earnings increases (C criteria) have been strong and well above the +25% guideline. A downturn in FY '07 and '08 earnings (A criteria) has been followed by a strong earnings rebound in recent years. See the latest FSU analysis for more details and a new annotated graph.
>>> The latest Featured Stock Update with an annotated graph appeared on 12/20/2012. Click here.
View all notes |
Alert me of new notes |
CANSLIM.net Company Profile |
SEC |
Zacks Reports |
StockTalk |
News |
Chart |
Request a new note
C
A N
S L
I M
|
Symbol/Exchange
Company Name
Industry Group |
PRICE |
CHANGE
(%Change) |
Day High |
Volume
(% DAV)
(% 50 day avg vol) |
52 Wk Hi
% From Hi |
Featured
Date |
Price
Featured |
Pivot Featured |
|
Max Buy |
VSI
-
NYSE
Vitamin Shoppe Inc
SPECIALTY RETAIL - Specialty Retail, Other
|
$57.41
|
-0.10
-0.17% |
$58.14
|
51,737
21.13% of 50 DAV
50 DAV is 244,900
|
$61.89
-7.24%
|
12/3/2012
|
$59.06
|
PP = $61.99
|
|
MB = $65.09
|
Most Recent Note - 12/24/2012 2:11:53 PM
G - Sputtering below its 50 DMA line again today. The $61 area has been a stubborn resistance level in recent months. See the latest FSU analysis for more details and a new annotated graph.
>>> The latest Featured Stock Update with an annotated graph appeared on 12/24/2012. Click here.
View all notes |
Alert me of new notes |
CANSLIM.net Company Profile |
SEC |
Zacks Reports |
StockTalk |
News |
Chart |
Request a new note
C
A N
S L
I M
|
WPI
-
NYSE
Watson Pharmaceuticals
DRUGS - Drugs - Generic
|
$90.36
|
-0.49
-0.54% |
$91.47
|
327,890
42.22% of 50 DAV
50 DAV is 776,600
|
$91.16
-0.88%
|
12/17/2012
|
$87.99
|
PP = $90.49
|
|
MB = $95.01
|
Most Recent Note - 12/21/2012 5:37:26 PM
Y - Gain today with +122% above average volume for a new 52-week high clinched a technical buy signal. No resistance remains due to overhead supply.
>>> The latest Featured Stock Update with an annotated graph appeared on 12/17/2012. Click here.
View all notes |
Alert me of new notes |
CANSLIM.net Company Profile |
SEC |
Zacks Reports |
StockTalk |
News |
Chart |
Request a new note
C
A N
S L
I M
|
|
|
|
THESE ARE NOT BUY RECOMMENDATIONS!
Comments contained in the body of this report are technical
opinions only. The material herein has been obtained
from sources believed to be reliable and accurate, however,
its accuracy and completeness cannot be guaranteed.
This site is not an investment advisor, hence it does
not endorse or recommend any securities or other investments.
Any recommendation contained in this report may not
be suitable for all investors and it is not to be deemed
an offer or solicitation on our part with respect to
the purchase or sale of any securities. All trademarks,
service marks and trade names appearing in this report
are the property of their respective owners, and are
likewise used for identification purposes only.
This report is a service available
only to active Paid Premium Members.
You may opt-out of receiving report notifications
at any time. Questions or comments may be submitted
by writing to Premium Membership Services 665 S.E. 10 Street, Suite 201 Deerfield Beach, FL 33441-5634 or by calling 1-800-965-8307
or 954-785-1121.
|
|
|

