You are not logged in.
This means you
CAN ONLY VIEW reports that were published prior to Monday, April 14, 2025.
You
MUST UPGRADE YOUR MEMBERSHIP if you want to see any current reports.
AFTER MARKET UPDATE - THURSDAY, DECEMBER 24TH, 2009
Previous After Market Report Next After Market Report >>>
|
|
|
|
DOW |
+53.66 |
10,520.10 |
+0.51% |
|
Volume |
319,291,140 |
-59% |
|
Volume |
632,827,740 |
-61% |
|
NASDAQ |
+16.05 |
2,285.69 |
+0.71% |
|
Advancers |
2,169 |
71% |
|
Advancers |
1,637 |
59% |
|
S&P 500 |
+5.89 |
1,126.48 |
+0.53% |
|
Decliners |
756 |
25% |
|
Decliners |
983 |
35% |
|
Russell 2000 |
+3.09 |
634.07 |
+0.49% |
|
52 Wk Highs |
382 |
|
|
52 Wk Highs |
182 |
|
|
S&P 600 |
+1.73 |
337.41 |
+0.52% |
|
52 Wk Lows |
0 |
|
|
52 Wk Lows |
10 |
|
|
 |
Major Averages Quietly Rally Into Holiday Weekend
Adam Sarhan, Contributing Writer,
The market closed higher for the week as the major averages continued rising on Thursday's shortened pre-holiday session. Volume, an important indicator of institutional sponsorship, was lighter than Wednesday's levels, again revealing the lack of appetite for accumulating shares from very large and influential institutional investors. Advancers led decliners by nearly a 3-to-1 ratio on the NYSE and by nearly a 2-to-1 ratio on the Nasdaq exchange. There were 62 high-ranked companies from the CANSLIM.net Leaders List that made a new 52-week high and appeared on the CANSLIM.net BreakOuts Page, one less than the total of 63 issues that appeared on the prior session. New 52-week highs solidly outnumbered new 52-week lows on the NYSE and on the Nasdaq exchange.
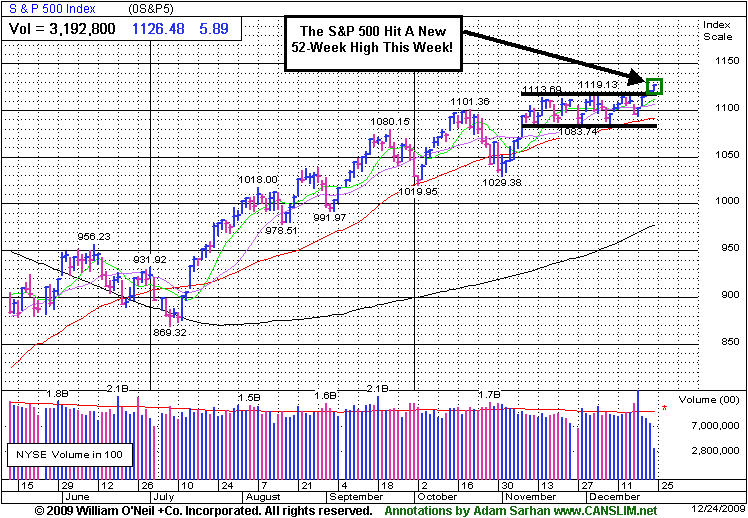
Stocks ended this shortened holiday week higher as investors digested the latest round of mixed economic data. On Monday, the major averages rallied on Monday as the latest round of mergers and acquisitions were announced. It was also encouraging to see the major averages rally even as the US dollar advanced. Since early December, the US dollar has steadily advanced but the major averages have managed to hold their own and move sideways to slighter higher during that period which is a significant change from the recent inverse relationship that prevailed for most of this year.
Before Tuesday's opening bell, the Commerce Department said third quarter GDP rose by +2.2% which was lower than prior estimates and led many to question the health of the ongoing recovery. The report showed that companies curbed spending and cut inventories due to lackluster demand. At 10:00AM EST, the National Association of Realtors said existing home sales jumped +7.4% to a 6.54 million annual rate. The report was the highest in more than two years and led many to question whether or not the ailing housing market has finally bottomed. It was encouraging to see stocks rally even in the face of weaker-than-expected economic data and a stronger dollar. Remember, a hallmark of a strong market is to see stocks rally even in the face of otherwise bearish news (i.e. weaker GDP #'s and a stronger dollar).
Investors digested a slew of economic data and sent stocks higher on Wednesday. At 7:00AM EST, the Mortgage Bankers' Association (MBA) said its purchase application index fell -11.6% while its refinance index fell -10.1%, both below consensus. On a more positive note, the report showed that long term mortgage rates remain extremely low with 30-year loans averaging +4.92%. At 10:00AM EST, the Commerce Department said new home sales plunged -11% in November to a 355,000 annual rate which fell short of estimates. Furthermore, the report included downward revisions of 42,000 in the prior two months. New home sales measure the number of newly constructed homes with a committed sale during the prior month.
Elsewhere, personal income in November rose by +0.4%, following a rise of +0.3% in October. This was just below the Street's estimate of a +0.5% gain. The wages and salaries component of the report rose +0.3% after a +0.1% increase in October. The report showed that inflation eased last month. The headline PCE price inflation component fell to +0.2% from +0.3% in October. Core PCE inflation was unchanged in November, down from a +0.2% increase in October. On Thursday, stocks edged higher after the US Commerce Department said orders for durable goods, goods meant to last several years, rose in November.
Looking at the market, the action remains healthy. The Dow Jones Industrial Average, small cap Russell 2000 index, S&P 500 and Nasdaq composite have all hit fresh 2009 highs this week. Leaving the NYSE composite just below its 2009 high. Again, the fact that the market managed to rally and hit new highs in the face of disconcerting economic data and a stronger dollar is a very strong sign. Ideally, one would like to see leadership and volume expand over the next few weeks as the major averages continue advancing.
PICTURED: The S&P 500 Index hit a new 52-week high this week!
|
|
|
 |
Semiconductor Index Rallies To 2009 Highs With 5 Straight Gains
Kenneth J. Gruneisen - Passed the CAN SLIM® Master's Exam
The Bank Index ($BKX +1.10%) and Semiconductor Index ($SOX +1.60%) were the best group gainers on Thursday's abbreviated trading session. The Broker/Dealer Index ($XBD +0.32%) also posted a modest gain, and the Biotechnology Index ($BTK +0.37%), Internet Index ($IIX +0.40%) and Networking Index ($NWX +0.55%) each posted modest gains which helped the tech-heavy Nasdaq continue leading its peers higher. Commodity-linked areas also were on the rise as the Oil Services Index ($OSX +0.18%), Integrated Oil Index ($XOI +0.60%), and Gold & Silver Index ($XAU +0.37%) posted modest gains. Meanwhile, the Healthcare Index ($HMO -0.26%) and Retail Index ($RLX -0.10%) edged lower.
Charts courtesy www.stockcharts.com
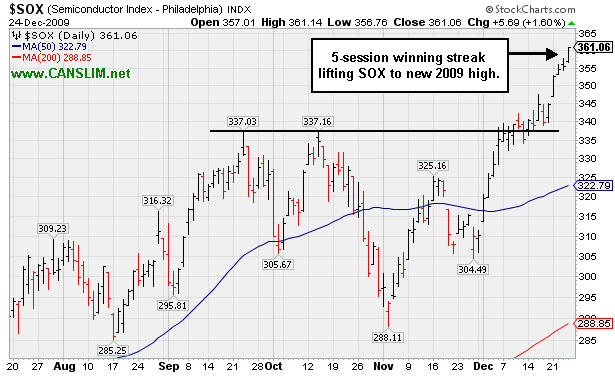
PICTURED: The Semiconductor Index ($SOX +1.60%) continued rallying to new 2009 highs with a 5th consecutive gain.
| Oil Services |
$OSX |
197.25 |
+0.36 |
+0.18% |
+62.49% |
| Healthcare |
$HMO |
1,516.18 |
-4.02 |
-0.26% |
+57.91% |
| Integrated Oil |
$XOI |
1,077.20 |
+6.39 |
+0.60% |
+9.95% |
| Semiconductor |
$SOX |
361.06 |
+5.69 |
+1.60% |
+70.17% |
| Networking |
$NWX |
232.13 |
+1.27 |
+0.55% |
+61.32% |
| Internet |
$IIX |
235.98 |
+0.93 |
+0.40% |
+76.41% |
| Broker/Dealer |
$XBD |
116.34 |
+0.37 |
+0.32% |
+50.17% |
| Retail |
$RLX |
417.54 |
-0.41 |
-0.10% |
+49.52% |
| Gold & Silver |
$XAU |
172.01 |
+0.64 |
+0.37% |
+38.89% |
| Bank |
$BKX |
43.34 |
+0.47 |
+1.10% |
-2.21% |
| Biotech |
$BTK |
942.34 |
+3.52 |
+0.37% |
+45.61% |
|
|
|
 |
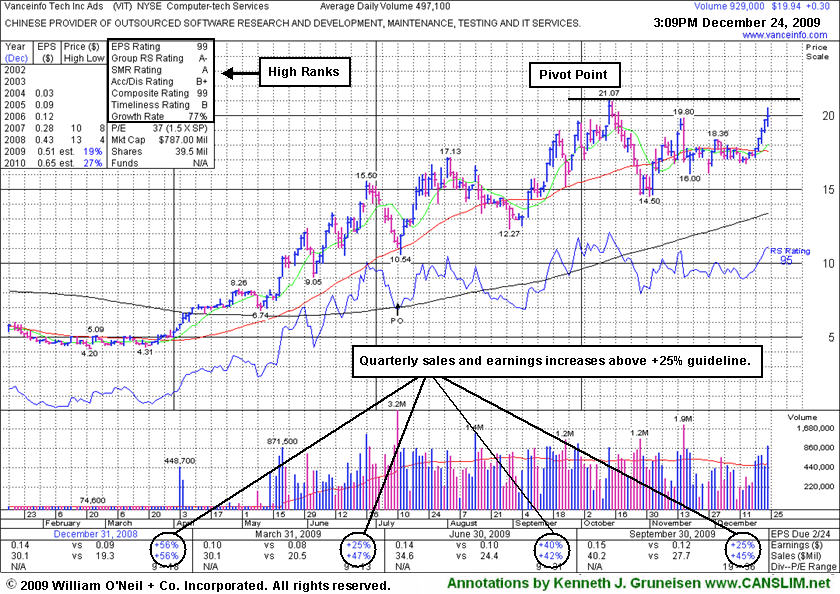
Computer - Tech Services Firm On Winning Streak
Kenneth J. Gruneisen - Passed the CAN SLIM® Master's Exam
Vanceinfo Tech Inc Ads (VIT +$0.30 or +% to $19.94) posted a 5th consecutive gain on ever-increasing volume, and no overhead supply exists to act as resistance. It was featured in yellow in today's mid-day report (read here) while approaching all-time highs on the right side of a choppy 10-week base. The stock has cleared its November high, but it technically did not yet rise above the pivot point cited to trigger a new buy signal. It has come a long way this year, yet it has built a sufficient length base following its steep ascent from its March low ($4.31).
A stock that rises from $20 to $30 must first clear $21, $22, and $23. Disciplined investors would watch for a proper technical buy signal and resist the urge to get in "early" without seeing fresh proof of heavy institutional (I criteria) buying demand driving the stock to new highs (the N criteria). An additional public offering of shares on 7/10/09 coincided with a successful earlier test of 50 DMA support.
Fundamentally, this high-ranked Computer - Tech Services firm's earnings and sales revenues increases have been above or at the +25% minimum guideline. Its small supply of only 11.4 million shares (the S criteria) in the publicly traded float could be a factor leading to greater volatility, especially in the event of mutual funds accumulating or distributing (selling) shares. This heightens the need for caution when buying and the discipline to limit losses, as always, if any stock ever falls more than -7% from your buy price.
|
|
|
Color Codes Explained :
Y - Better candidates highlighted by our
staff of experts.
G - Previously featured
in past reports as yellow but may no longer be buyable under the
guidelines.
***Last / Change / Volume quote data in this table corresponds with the timestamp on the note***
Symbol/Exchange
Company Name
Industry Group |
Last |
Chg. |
Vol
% DAV |
Date Featured |
Price Featured |
Latest Pivot Point
Featured |
Status |
| Latest Max Buy Price |
ARST
-
|
$26.37
|
+0.13
|
140,016
25% DAV
552,800
|
9/1/2009
(Date
Featured) |
$19.91
(Price
Featured) |
PP = $27.20 |
Y |
| MB = $28.56 |
Most Recent Note - 12/24/2009 1:51:42 PM
Y - Quietly perched near all-timem highs, it has been basing for 6 weeks. Color code was changed to yellow with new pivot point and max buy levels noted. ARST was first featured in yellow at $19.91 in the 9/01/09 mid-day report with an annotated daily graph (read here).
>>> The latest Featured Stock Update with an annotated graph appeared on 12/16/2009. click here.
|
|
C
A
S
I |
News |
Chart |
SEC
View all notes Alert
me of new notes
Company
Profile
|
ASIA
-
|
$31.05
|
-0.25
|
238,766
17% DAV
1,370,000
|
12/24/2009
(Date
Featured) |
$31.05
(Price
Featured) |
PP = $32.40 |
G |
| MB = $34.02 |
Most Recent Note - 12/24/2009 1:59:07 PM
G - Perched near all-time highs, it has formed an advanced "3 weeks tight" type pattern. A subsequent breakout with heavy volume is needed to confirm a new technical buy signal. its considerable gap up gain on 12/07/09 with almost 8 times average volume. Traded up as much as +68.13% since first featured in the August 2009 CANSLIM.net News (read here).
>>> The latest Featured Stock Update with an annotated graph appeared on 12/23/2009. click here.
|
|
C
A
S
I |
News |
Chart |
SEC
View all notes Alert
me of new notes
Company
Profile
|
BIDU
- NASDAQ
Baidu Inc Ads
INTERNET - Internet Information Providers
|
$415.99
|
+1.79
|
794,606
42% DAV
1,893,000
|
9/8/2009
(Date
Featured) |
$351.80
(Price
Featured) |
PP = $440.00 |
G |
| MB = $462.00 |
Most Recent Note - 12/24/2009 2:01:31 PM
G - Gains on lighter volume this week continued its consolidation below its 50 DMA line (now $417.57). Weakness has raised concerns, and its color code was changed to green. It would need to rally and close above its 50 DMA for its outlook to improve, and it needs to rise above its latest pivot point with at least +50% above average volume to trigger a new buy signal. Technically, it has built a sloppy base over 8 weeks. Since quietly rallying to new highs in November it has stalled. BIDU traded up as much as +23% from its price when featured in yellow in the 9/08/09 Mid-Day BreakOuts Report (read here).
>>> The latest Featured Stock Update with an annotated graph appeared on 12/21/2009. click here.
|
|
C
A
S
I |
News |
Chart |
SEC
View all notes Alert
me of new notes
Company
Profile
|
CAAS
- NASDAQ
China Automotive Systems
AUTOMOTIVE - Auto Parts
|
$19.86
|
+1.28
|
1,605,427
247% DAV
651,100
|
11/30/2009
(Date
Featured) |
$18.84
(Price
Featured) |
PP = $17.62 |
G |
| MB = $18.50 |
Most Recent Note - 12/24/2009 2:05:39 PM
G - Considerable gain today with above average volume indicates accumulation after finding prompt support near its short-term average line. On the prior session it positively reversed after a gap down and pullback near support at its 50 DMA line. The Chinese maker of power steering systems had negated most of its bullish action since featured in the 11/30/09 mid-day report (read here).
>>> The latest Featured Stock Update with an annotated graph appeared on 12/11/2009. click here.
|
|
C
A
S
I |
News |
Chart |
SEC
View all notes Alert
me of new notes
Company
Profile
|
CACC
- NASDAQ
Credit Acceptance Corp
FINANCIAL SERVICES - Credit Services
|
$43.11
|
+1.06
|
13,106
33% DAV
39,400
|
9/29/2009
(Date
Featured) |
$33.48
(Price
Featured) |
PP = $37.10 |
G |
| MB = $38.96 |
Most Recent Note - 12/24/2009 2:06:15 PM
G - Hit a new all-time high today with another gain on light volume. Prior chart highs in the $35-37 area are an important support level to watch now. The Finance - Consumer/Commercial Loans firm has maintained a great track record of annual and quarterly sales revenues and earnings increases. It was featured on 9/29/09 in yellow in the mid-day report (read here).
>>> The latest Featured Stock Update with an annotated graph appeared on 12/22/2009. click here.
|
|
C
A
S
I |
News |
Chart |
SEC
View all notes Alert
me of new notes
Company
Profile
|
CRM
- NYSE
Salesforce.com Inc
INTERNET - Internet Software & Services
|
$72.66
|
+0.06
|
768,212
47% DAV
1,640,700
|
12/18/2009
(Date
Featured) |
$67.32
(Price
Featured) |
PP = $67.82 |
G |
| MB = $71.21 |
Most Recent Note - 12/24/2009 2:13:43 PM
G - Perched at 2009 highs after 5 consecutive gains, it is now extended from its prior base after rising from a 5-week flat base above important support at its 50 DMA line. Its 12/18/09 gain with more than +50% above average volume triggered a technical buy signal.
>>> The latest Featured Stock Update with an annotated graph appeared on 12/18/2009. click here.
|
|
C
A
S
I |
News |
Chart |
SEC
View all notes Alert
me of new notes
Company
Profile
|
CTRP
- NASDAQ
Ctrip.com Intl Ltd Adr
LEISURE - Resorts & Casinos
|
$73.18
|
+0.59
|
193,171
17% DAV
1,119,300
|
12/1/2009
(Date
Featured) |
$75.38
(Price
Featured) |
PP = $73.91 |
G |
| MB = $77.61 |
Most Recent Note - 12/24/2009 2:15:29 PM
G - Posted quiet gains this week following a slump under its pivot point that raised more concerns while falling on higher volume toward its 50 DMA line - its next important chart support level. Color code was changed to green based on the deterioration more than -7% below its latest pivot point. Featured on 12/01/09 in yellow in the mid-day report (read here). Fundamentally, its sales revenues and earnings increases have shown acceleration in the 3 most recent quarterly comparisons and rose above the +25% guideline. Based on weak technical action it was dropped from the Featured Stocks list on 6/10/08, when it closed at $49.84, yet it has rebounded very impressively from subsequent lows in the $16 area.
>>> The latest Featured Stock Update with an annotated graph appeared on 12/14/2009. click here.
|
|
C
A
S
I |
News |
Chart |
SEC
View all notes Alert
me of new notes
Company
Profile
|
HEAT
-
|
$14.82
|
+0.13
|
577,551
61% DAV
943,300
|
11/17/2009
(Date
Featured) |
$12.00
(Price
Featured) |
PP = $12.61 |
G |
| MB = $13.24 |
Most Recent Note - 12/24/2009 2:18:01 PM
G - A loss for this holiday-shortened week on light volume followed 3 weekly gains on above average volume in the prior 4 weeks. The investment system rules say a stock should be held a minimum of 8 weeks after rising more than +20% in the first 2-3 weeks from being bought. First featured in yellow in the 11/17/09 mid-day report (read here) when technically rising from a "double bottom" base, reaching a new all-time high.
>>> The latest Featured Stock Update with an annotated graph appeared on 12/15/2009. click here.
|
|
C
A
S
I |
News |
Chart |
SEC
View all notes Alert
me of new notes
Company
Profile
|
LFT
-
|
$37.30
|
+0.25
|
69,359
16% DAV
445,300
|
11/17/2009
(Date
Featured) |
$31.77
(Price
Featured) |
PP = $33.04 |
G |
| MB = $34.69 |
Most Recent Note - 12/24/2009 2:20:57 PM
G - Quietly hovering near all-time highs, extended from a sound buy point now after recently rising from a choppy 14-week base. Its 50 DMA line coincides with prior chart highs in the $32 area are an initial support level to watch. A proposed offering of additional shares on 11/16/09 seems well received by the market. Its fundamentals remain strong.
>>> The latest Featured Stock Update with an annotated graph appeared on 12/17/2009. click here.
|
|
C
A
S
I |
News |
Chart |
SEC
View all notes Alert
me of new notes
Company
Profile
|
VIT
-
|
$19.94
|
+0.30
|
929,080
188% DAV
493,800
|
12/24/2009
(Date
Featured) |
$20.07
(Price
Featured) |
PP = $21.17 |
Y |
| MB = $22.23 |
Most Recent Note - 12/24/2009 2:32:18 PM
Y - It was featured in yellow in today's mid-day report (read here) while approaching all-time highs on the right side of a choppy 10-week base. It posted a 5th consecutive gain on ever-increasing volume, and no overhead supply exists to act as resistance, however it did not yet rise above the pivot point cited. Following its steep ascent from its March low ($4.31), an additional public offering of shares on 7/10/09 coincided with a successful earlier test of 50 DMA support. Fundamentally, this high-ranked Computer - Tech Services firm's earnings and sales revenues increases have been above or at the +25% minimum guideline.
>>> The latest Featured Stock Update with an annotated graph appeared on 12/24/2009. click here.
|
|
C
A
S
I |
News |
Chart |
SEC
View all notes Alert
me of new notes
Company
Profile
|
|
|
|
THESE ARE NOT BUY RECOMMENDATIONS!
Comments contained in the body of this report are technical
opinions only. The material herein has been obtained
from sources believed to be reliable and accurate, however,
its accuracy and completeness cannot be guaranteed.
This site is not an investment advisor, hence it does
not endorse or recommend any securities or other investments.
Any recommendation contained in this report may not
be suitable for all investors and it is not to be deemed
an offer or solicitation on our part with respect to
the purchase or sale of any securities. All trademarks,
service marks and trade names appearing in this report
are the property of their respective owners, and are
likewise used for identification purposes only.
This report is a service available
only to active Paid Premium Members.
You may opt-out of receiving report notifications
at any time. Questions or comments may be submitted
by writing to Premium Membership Services 665 S.E. 10 Street, Suite 201 Deerfield Beach, FL 33441-5634 or by calling 1-800-965-8307
or 954-785-1121.
|
|
|


