***Last / Change / Volume data in this table is the closing quote data***
Symbol/Exchange
Company Name
Industry Group |
PRICE |
CHANGE
(%Change) |
Day High |
Volume
(% DAV)
(% 50 day avg vol) |
52 Wk Hi
% From Hi |
Featured
Date |
Price
Featured |
Pivot Featured |
|
Max Buy |
ABV
-
NYSE
Comp De Bebidas Adr
FOOD and BEVERAGE - Beverages - Brewers
|
$151.92
|
-0.04
-0.03% |
$153.12
|
296,375
48.64% of 50 DAV
50 DAV is 609,300
|
$153.79
-1.22%
|
12/10/2010
|
$139.87
|
PP = $145.46
|
|
MB = $152.73
|
Most Recent Note - 12/21/2010 2:28:00 PM
Y - Gapped up today for a considerable gain and new all-time high, yet volume is not particularly heavy. As previously noted - "A gain into new high territory with great volume conviction may trigger a new (or add-on) buy signal. Recent lows in the $133 area define important chart support to watch."
>>> The latest Featured Stock Update with an annotated graph appeared on 12/3/2010. Click here.
View all notes |
Alert me of new notes |
CANSLIM.net Company Profile |
SEC |
Zacks Reports |
StockTalk |
News |
Chart |
Request a new note
C
A N
S L
I M


|
ARUN
-
NASDAQ
Aruba Networks Inc
COMPUTER HARDWARE - Networking andamp; Communication Dev
|
$21.74
|
-0.41
-1.85% |
$22.26
|
1,259,348
51.50% of 50 DAV
50 DAV is 2,445,400
|
$24.28
-10.46%
|
8/30/2010
|
$18.12
|
PP = $18.51
|
|
MB = $19.44
|
 Most Recent Note - 12/23/2010 3:12:34 PM
G - Today's loss on light volume has quietly violated its 50 DMA line and a previously noted upward trendline, raising some concerns. More damaging losses below recent chart lows in the $20.60 area could raise more serious concerns and trigger a technical sell signal. See the latest FSU analysis for more details and an annotated graph.
>>> The latest Featured Stock Update with an annotated graph appeared on 12/14/2010. Click here.
View all notes |
Alert me of new notes |
CANSLIM.net Company Profile |
SEC |
Zacks Reports |
StockTalk |
News |
Chart |
Request a new note
C
A N
S L
I M
|
BIDU
-
NASDAQ
Baidu Inc Ads
INTERNET - Internet Information Providers
|
$100.16
|
-0.34
-0.34% |
$100.46
|
3,536,700
32.03% of 50 DAV
50 DAV is 11,041,300
|
$115.04
-12.93%
|
12/10/2010
|
$108.00
|
PP = $115.14
|
|
MB = $120.90
|
Most Recent Note - 12/21/2010 6:43:20 PM
G - Small gain on lighter volume today after a positive reversal on the prior session. A rebound above its 50 DMA line and prior low ($103.11 on 11/16/10) could help its outlook improve, but meanwhile it faces resistance due to months of overhead supply and the path of least resistance may lead to a deeper consolidation toward its 200 DMA line.
>>> The latest Featured Stock Update with an annotated graph appeared on 11/30/2010. Click here.
View all notes |
Alert me of new notes |
CANSLIM.net Company Profile |
SEC |
Zacks Reports |
StockTalk |
News |
Chart |
Request a new note
C
A N
S L
I M
|
CACC
-
NASDAQ
Credit Acceptance Corp
FINANCIAL SERVICES - Credit Services
|
$61.98
|
+0.51
0.83% |
$62.39
|
7,567
33.48% of 50 DAV
50 DAV is 22,600
|
$63.45
-2.32%
|
11/22/2010
|
$59.97
|
PP = $62.00
|
|
MB = $65.10
|
Most Recent Note - 12/20/2010 6:17:50 PM
Y - Still hovering in a very tight range only -3.3% off its 52-week high. See the latest FSU analysis for details and an annotated graph..
>>> The latest Featured Stock Update with an annotated graph appeared on 12/20/2010. Click here.
View all notes |
Alert me of new notes |
CANSLIM.net Company Profile |
SEC |
Zacks Reports |
StockTalk |
News |
Chart |
Request a new note
C
A N
S L
I M
|
CIS
-
NYSE
Camelot Info Systems Ads
COMPUTER SOFTWARE andamp; SERVICES - Information Technology Service
|
$23.53
|
-0.92
-3.76% |
$24.65
|
371,782
92.23% of 50 DAV
50 DAV is 403,100
|
$24.89
-5.46%
|
11/26/2010
|
$18.93
|
PP = $19.72
|
|
MB = $20.71
|
Most Recent Note - 12/23/2010 2:25:22 PM
G - Consolidating near its all-time high, with no resistance remaining due to overhead supply. Recently completed a Secondary Offering and found support near prior highs in the $19.50 area, but it has not formed a sound new base following its 11/29/10 breakout.
>>> The latest Featured Stock Update with an annotated graph appeared on 11/26/2010. Click here.
View all notes |
Alert me of new notes |
CANSLIM.net Company Profile |
SEC |
Zacks Reports |
StockTalk |
News |
Chart |
Request a new note
C
A N
S L
I M
|
Symbol/Exchange
Company Name
Industry Group |
PRICE |
CHANGE
(%Change) |
Day High |
Volume
(% DAV)
(% 50 day avg vol) |
52 Wk Hi
% From Hi |
Featured
Date |
Price
Featured |
Pivot Featured |
|
Max Buy |
CMG
-
NYSE
Chipotle Mexican Grill
LEISURE - Restaurants
|
$228.29
|
-3.49
-1.51% |
$233.96
|
520,624
48.43% of 50 DAV
50 DAV is 1,075,000
|
$262.78
-13.12%
|
9/1/2010
|
$158.31
|
PP = $155.52
|
|
MB = $163.30
|
Most Recent Note - 12/22/2010 5:53:45 PM
Y - Consolidating above its 50 DMA line which defines important near-term support along with its recent chart low ($221.41 on 12/14/10). Color code was changed to yellow after its pullback to its 10-week moving average, but a new pivot point was not cited as it has not formed a sound new base. See the latest FSU section analysis for details and an annotated graph.
>>> The latest Featured Stock Update with an annotated graph appeared on 12/17/2010. Click here.
View all notes |
Alert me of new notes |
CANSLIM.net Company Profile |
SEC |
Zacks Reports |
StockTalk |
News |
Chart |
Request a new note
C
A N
S L
I M
|
DECK
-
NASDAQ
Deckers Outdoor Corp
CONSUMER NON-DURABLES - Textile - Apparel Footwear
|
$83.69
|
-0.62
-0.74% |
$84.11
|
1,292,475
69.54% of 50 DAV
50 DAV is 1,858,600
|
$87.88
-4.77%
|
10/27/2010
|
$54.16
|
PP = $54.86
|
|
MB = $57.60
|
Most Recent Note - 12/22/2010 1:38:32 PM
G - Not near any sound base, yet stubbornly holding its ground near all-time highs. See the latest FSU analysis for details and an annotated graph.
>>> The latest Featured Stock Update with an annotated graph appeared on 12/16/2010. Click here.
View all notes |
Alert me of new notes |
CANSLIM.net Company Profile |
SEC |
Zacks Reports |
StockTalk |
News |
Chart |
Request a new note
C
A N
S L
I M
|
EZCH
-
NASDAQ
Ezchip Semiconductor Ltd
ELECTRONICS - Semiconductor - Specialized
|
$28.46
|
+0.16
0.57% |
$28.52
|
137,509
49.32% of 50 DAV
50 DAV is 278,800
|
$29.73
-4.27%
|
12/2/2010
|
$27.53
|
PP = $26.00
|
|
MB = $27.30
|
Most Recent Note - 12/17/2010 5:40:21 PM
G - This week it spent some time dipping under its "max buy" level while consolidating above prior chart highs in the $26 area that define an important technical support level to watch.
>>> The latest Featured Stock Update with an annotated graph appeared on 12/2/2010. Click here.
View all notes |
Alert me of new notes |
CANSLIM.net Company Profile |
SEC |
Zacks Reports |
StockTalk |
News |
Chart |
Request a new note
C
A N
S L
I M
|
EZPW
-
NASDAQ
Ezcorp Inc Cl A
SPECIALTY RETAIL - Specialty Retail, Other
|
$28.09
|
+0.08
0.29% |
$28.43
|
234,952
67.30% of 50 DAV
50 DAV is 349,100
|
$28.75
-2.30%
|
11/5/2010
|
$24.02
|
PP = $23.85
|
|
MB = $25.04
|
Most Recent Note - 12/21/2010 4:45:34 PM
G - Hit and closed at a new 52-week high today with a solid gain on average volume. Recently noted - "Stubbornly holding its ground after recent volume-driven gains, extended from a sound base pattern. Its 50 DMA line defines important support."
>>> The latest Featured Stock Update with an annotated graph appeared on 11/6/2010. Click here.
View all notes |
Alert me of new notes |
CANSLIM.net Company Profile |
SEC |
Zacks Reports |
StockTalk |
News |
Chart |
Request a new note
C
A N
S L
I M
|
FFIV
-
NASDAQ
F 5 Networks Inc
INTERNET - Internet Software and Services
|
$135.60
|
-0.57
-0.42% |
$136.25
|
811,736
27.13% of 50 DAV
50 DAV is 2,992,400
|
$143.75
-5.67%
|
6/16/2010
|
$74.50
|
PP = $74.10
|
|
MB = $77.81
|
Most Recent Note - 12/17/2010 5:43:11 PM
G - Gain today with heavier volume after halting its slide on the prior session. Repeatedly noted as extended from any sound base pattern. Its 50 DMA line defines chart support to watch.
>>> The latest Featured Stock Update with an annotated graph appeared on 11/15/2010. Click here.
View all notes |
Alert me of new notes |
CANSLIM.net Company Profile |
SEC |
Zacks Reports |
StockTalk |
News |
Chart |
Request a new note
C
A N
S L
I M
|
Symbol/Exchange
Company Name
Industry Group |
PRICE |
CHANGE
(%Change) |
Day High |
Volume
(% DAV)
(% 50 day avg vol) |
52 Wk Hi
% From Hi |
Featured
Date |
Price
Featured |
Pivot Featured |
|
Max Buy |
FOSL
-
NASDAQ
Fossil Inc
CONSUMER DURABLES - Recreational Goods, Other
|
$72.53
|
+0.64
0.89% |
$73.09
|
420,113
51.96% of 50 DAV
50 DAV is 808,500
|
$74.34
-2.43%
|
11/26/2010
|
$69.10
|
PP = $70.17
|
|
MB = $73.68
|
Most Recent Note - 12/22/2010 5:43:10 PM
Y - Still consolidating above prior highs, only -3.3% off its all-time high. Volume totals have been cooling since its technical breakout on 12/02/10 from an advanced "3-weeks tight" pattern.
>>> The latest Featured Stock Update with an annotated graph appeared on 11/29/2010. Click here.
View all notes |
Alert me of new notes |
CANSLIM.net Company Profile |
SEC |
Zacks Reports |
StockTalk |
News |
Chart |
Request a new note
C
A N
S L
I M
|
HMSY
-
NASDAQ
H M S Holdings Corp
COMPUTER SOFTWARE and SERVICES - Healthcare Information Service
|
$65.65
|
+0.01
0.02% |
$66.04
|
51,110
24.88% of 50 DAV
50 DAV is 205,400
|
$67.10
-2.16%
|
11/19/2010
|
$61.89
|
PP = $63.01
|
|
MB = $66.16
|
Most Recent Note - 12/22/2010 5:45:27 PM
G - Touched a new high after a strong start today, but it reversed into the red for the close for a small loss on light volume. Prior highs in the $62 define initial chart support to watch above its 50 DMA line. Its Relative Strength rank has slumped to 74, below the 80+ guideline.
>>> The latest Featured Stock Update with an annotated graph appeared on 11/19/2010. Click here.
View all notes |
Alert me of new notes |
CANSLIM.net Company Profile |
SEC |
Zacks Reports |
StockTalk |
News |
Chart |
Request a new note
C
A N
S L
I M
|
JOBS
-
NASDAQ
Fifty One Job Inc Ads
DIVERSIFIED SERVICES - Staffing and; Outsourcing Service
|
$50.00
|
-0.70
-1.38% |
$50.95
|
30,574
15.02% of 50 DAV
50 DAV is 203,500
|
$55.50
-9.91%
|
10/13/2010
|
$42.07
|
PP = $40.60
|
|
MB = $42.63
|
Most Recent Note - 12/21/2010 6:46:05 PM
G - Posted a small gain today with average volume. Recent losses violated a steep upward trendline defining initial support to watch, yet it remains above its 50 DMA line while it is extended from any sound base. It recently appeared ready to challenge its all-time high near $55 from 2004.
>>> The latest Featured Stock Update with an annotated graph appeared on 11/16/2010. Click here.
View all notes |
Alert me of new notes |
CANSLIM.net Company Profile |
SEC |
Zacks Reports |
StockTalk |
News |
Chart |
Request a new note
C
A N
S L
I M
|
LULU
-
NASDAQ
Lululemon Athletica
MANUFACTURING - Textile Manufacturing
|
$71.19
|
-0.51
-0.71% |
$72.49
|
903,833
54.95% of 50 DAV
50 DAV is 1,644,800
|
$74.60
-4.57%
|
10/8/2010
|
$47.66
|
PP = $46.67
|
|
MB = $49.00
|
Most Recent Note - 12/22/2010 1:46:15 PM
G - Pulling back today without great volume conviction, still perched near its all-time high. There is no near-term chart support while it is extended from its 50 DMA line (now $52.81).
>>> The latest Featured Stock Update with an annotated graph appeared on 12/1/2010. Click here.
View all notes |
Alert me of new notes |
CANSLIM.net Company Profile |
SEC |
Zacks Reports |
StockTalk |
News |
Chart |
Request a new note
C
A N
S L
I M
|
MWIV
-
NASDAQ
M W I Veterinary Supply
HEALTH SERVICES - Medical Instruments and; Supplies
|
$64.54
|
+0.26
0.40% |
$64.91
|
24,024
39.51% of 50 DAV
50 DAV is 60,800
|
$65.28
-1.13%
|
11/4/2010
|
$61.79
|
PP = $59.60
|
|
MB = $62.58
|
Most Recent Note - 12/21/2010 6:36:26 PM
G - Recent gain with above average volume reconfirmed bullish action it showed earlier. See the latest FSU section analysis for details and an annotated graph.
>>> The latest Featured Stock Update with an annotated graph appeared on 12/21/2010. Click here.
View all notes |
Alert me of new notes |
CANSLIM.net Company Profile |
SEC |
Zacks Reports |
StockTalk |
News |
Chart |
Request a new note
C
A N
S L
I M
|
Symbol/Exchange
Company Name
Industry Group |
PRICE |
CHANGE
(%Change) |
Day High |
Volume
(% DAV)
(% 50 day avg vol) |
52 Wk Hi
% From Hi |
Featured
Date |
Price
Featured |
Pivot Featured |
|
Max Buy |
NEOG
-
NASDAQ
Neogen Corp
DRUGS - Diagnostic Substances
|
$41.88
|
+0.31
0.75% |
$42.00
|
84,355
104.01% of 50 DAV
50 DAV is 81,100
|
$41.96
-0.19%
|
9/1/2010
|
$30.79
|
PP = $30.49
|
|
MB = $32.01
|
Most Recent Note - 12/23/2010 1:18:44 PM
G - Touched another new high today with a small gain, and it may go on to produce more climactic gains while unhindered by resistance due to overhead supply. Higher volume without meaningful price progress in the past week was noted as a sign of distributional pressure while hovering near all-time highs, stubbornly holding its ground. It has been noted repeatedly as extended from any sound base after steadily advancing. Its 50 DMA line has been a reliable support level.
>>> The latest Featured Stock Update with an annotated graph appeared on 12/6/2010. Click here.
View all notes |
Alert me of new notes |
CANSLIM.net Company Profile |
SEC |
Zacks Reports |
StockTalk |
News |
Chart |
Request a new note
C
A N
S L
I M
|
NFLX
-
NASDAQ
Netflix Inc
SPECIALTY RETAIL - Music and Video Stores
|
$184.58
|
-0.77
-0.42% |
$185.39
|
3,002,567
48.22% of 50 DAV
50 DAV is 6,226,600
|
$206.80
-10.74%
|
11/9/2010
|
$173.10
|
PP = $184.84
|
|
MB = $194.08
|
Most Recent Note - 12/21/2010 2:31:35 PM
G - Gain today without great volume conviction while consolidating just above its 50 DMA line. Concerns were raised after recent negative reversals and noted distributional pressure, and it violated an upward trendline connecting its July - November lows.
>>> The latest Featured Stock Update with an annotated graph appeared on 11/24/2010. Click here.
View all notes |
Alert me of new notes |
CANSLIM.net Company Profile |
SEC |
Zacks Reports |
StockTalk |
News |
Chart |
Request a new note
C
A N
S L
I M
|
NTAP
-
NASDAQ
Netapp Inc
COMPUTER HARDWARE - Data Storage Devices
|
$54.79
|
-0.26
-0.47% |
$55.10
|
1,875,503
29.90% of 50 DAV
50 DAV is 6,272,700
|
$57.96
-5.47%
|
9/8/2010
|
$46.98
|
PP = $44.99
|
|
MB = $47.24
|
Most Recent Note - 12/20/2010 3:13:43 PM
G - Gapped up today after an analyst upgrade, still consolidating above its 50 DMA line and working on a new base. Recent chart lows define support to watch below that important short-term average line.
>>> The latest Featured Stock Update with an annotated graph appeared on 11/3/2010. Click here.
View all notes |
Alert me of new notes |
CANSLIM.net Company Profile |
SEC |
Zacks Reports |
StockTalk |
News |
Chart |
Request a new note
C
A N
S L
I M
|
ORCL
-
NASDAQ
Oracle Corp
COMPUTER SOFTWARE and SERVICES - Application Software
|
$31.54
|
-0.12
-0.38% |
$31.70
|
13,047,648
40.36% of 50 DAV
50 DAV is 32,327,500
|
$32.27
-2.26%
|
12/7/2010
|
$29.05
|
PP = $29.92
|
|
MB = $31.42
|
Most Recent Note - 12/20/2010 3:19:38 PM
G - Rising its "max buy" level and poised today for its best close of 2010. After its prior gain with volume nearly 3 times average its color code was changed to green. On 12/17/10 it gapped up after reporting earnings +31% on +47% sales revenues for the quarter ended November 30, 2010 versus the year ago period.
>>> The latest Featured Stock Update with an annotated graph appeared on 11/18/2010. Click here.
View all notes |
Alert me of new notes |
CANSLIM.net Company Profile |
SEC |
Zacks Reports |
StockTalk |
News |
Chart |
Request a new note
C
A N
S L
I M
|
PAY
-
NYSE
Verifone Systems Inc
COMPUTER HARDWARE - Transaction Automation Systems
|
$39.21
|
+0.53
1.37% |
$39.37
|
1,073,612
70.42% of 50 DAV
50 DAV is 1,524,500
|
$41.47
-5.45%
|
11/29/2010
|
$33.96
|
PP = $36.04
|
|
MB = $37.84
|
Most Recent Note - 12/22/2010 4:49:58 PM
G - Consolidating -6.7% off its all-time high, extended from its prior base. The old high in the $36 area nearly coincides with its 50 DMA line, defining important support to watch.
>>> The latest Featured Stock Update with an annotated graph appeared on 12/15/2010. Click here.
View all notes |
Alert me of new notes |
CANSLIM.net Company Profile |
SEC |
Zacks Reports |
StockTalk |
News |
Chart |
Request a new note
C
A N
S L
I M
|
Symbol/Exchange
Company Name
Industry Group |
PRICE |
CHANGE
(%Change) |
Day High |
Volume
(% DAV)
(% 50 day avg vol) |
52 Wk Hi
% From Hi |
Featured
Date |
Price
Featured |
Pivot Featured |
|
Max Buy |
RAX
-
NYSE
Rackspace Hosting Inc
INTERNET - Internet Software and; Services
|
$30.73
|
+0.06
0.20% |
$31.00
|
486,233
25.16% of 50 DAV
50 DAV is 1,932,300
|
$32.69
-6.00%
|
9/21/2010
|
$22.84
|
PP = $23.61
|
|
MB = $24.79
|
Most Recent Note - 12/22/2010 4:53:17 PM
G - Volume totals have been cooling while stubbornly holding its ground since hitting its 12/10/10 all-time high. No resistance remains due to overhead supply, but it is extended from any sound base.
>>> The latest Featured Stock Update with an annotated graph appeared on 11/17/2010. Click here.
View all notes |
Alert me of new notes |
CANSLIM.net Company Profile |
SEC |
Zacks Reports |
StockTalk |
News |
Chart |
Request a new note
C
A N
S L
I M
|
ROVI
-
NASDAQ
Rovi Corp
COMPUTER SOFTWARE andamp; SERVICES - Security Software andamp; Services
|
$57.26
|
-1.10
-1.88% |
$59.06
|
3,234,509
304.28% of 50 DAV
50 DAV is 1,063,000
|
$58.68
-2.42%
|
10/29/2010
|
$49.99
|
PP = $53.10
|
|
MB = $55.76
|
Most Recent Note - 12/23/2010 1:26:32 PM
G - Down today with above average volume after reporting plans to acquire Sonic Solutions (SNIC) in a $720 Million deal. It is extended from its latest base after wedging to highs without great volume conviction. Prior chart highs and its 50 DMA line define important support to watch.
>>> The latest Featured Stock Update with an annotated graph appeared on 12/13/2010. Click here.
View all notes |
Alert me of new notes |
CANSLIM.net Company Profile |
SEC |
Zacks Reports |
StockTalk |
News |
Chart |
Request a new note
C
A N
S L
I M
|
SHOO
-
NASDAQ
Steven Madden Limited
CONSUMER NON-DURABLES - Textile - Apparel Footwear
|
$44.35
|
-0.02
-0.05% |
$44.72
|
136,161
37.46% of 50 DAV
50 DAV is 363,500
|
$47.69
-7.00%
|
11/23/2010
|
$44.61
|
PP = $44.95
|
|
MB = $47.20
|
Most Recent Note - 12/22/2010 5:25:50 PM
G - Closed near the session low today, slumping amid widespread weakness Retail/Apparel stocks. The slump back below its old high closes raised concerns, and its 50 DMA line and recent lows define important support to watch, where violations would raise more serious concerns and trigger technical sell signals.
>>> The latest Featured Stock Update with an annotated graph appeared on 11/23/2010. Click here.
View all notes |
Alert me of new notes |
CANSLIM.net Company Profile |
SEC |
Zacks Reports |
StockTalk |
News |
Chart |
Request a new note
C
A N
S L
I M
|
SLW
-
NYSE
Silver Wheaton Corp
METALS and; MINING - Silver
|
$36.74
|
+0.31
0.85% |
$37.00
|
6,759,757
64.80% of 50 DAV
50 DAV is 10,432,200
|
$42.34
-13.23%
|
8/25/2010
|
$21.40
|
PP = $21.99
|
|
MB = $23.09
|
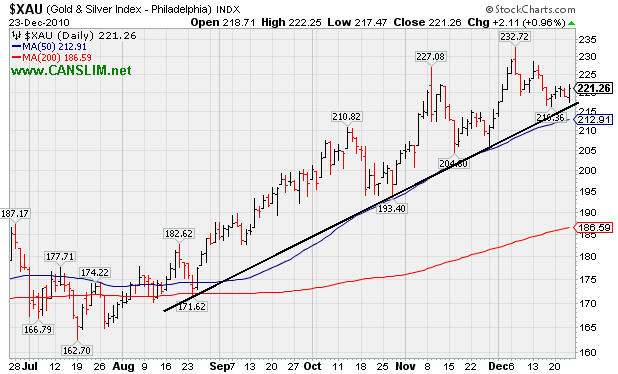
Most Recent Note - 12/22/2010 5:30:40 PM
G - Loss today on light volume led to its lowest close since 11/29/10, testing prior chart highs in the $36-37 area previously noted as initial support above its 50 DMA line. Gains in recent weeks lacked volume conviction while distributional pressure has been an ongoing concern since its negative reversal at an all-time high on 12/07/10.
>>> The latest Featured Stock Update with an annotated graph appeared on 12/8/2010. Click here.
View all notes |
Alert me of new notes |
CANSLIM.net Company Profile |
SEC |
Zacks Reports |
StockTalk |
News |
Chart |
Request a new note
C
A N
S L
I M
|
UA
-
NYSE
Under Armour Inc Cl A
CONSUMER NON-DURABLES - Textile - Apparel Clothing
|
$54.85
|
+0.36
0.66% |
$55.39
|
383,797
52.03% of 50 DAV
50 DAV is 737,600
|
$60.14
-8.80%
|
9/9/2010
|
$39.99
|
PP = $40.10
|
|
MB = $42.11
|
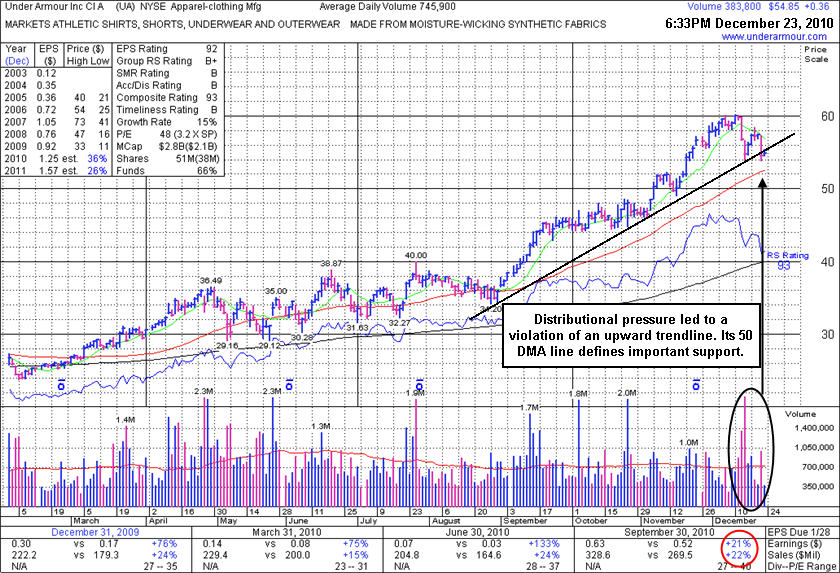
Most Recent Note - 12/22/2010 1:35:48 PM
G - Down today for a considerable loss with volume increasing while slumping toward last week's low. The recent chart low ($53.60) and its 50 DMA line ($52.37 now) define important support levels to watch.
>>> The latest Featured Stock Update with an annotated graph appeared on 12/23/2010. Click here.
View all notes |
Alert me of new notes |
CANSLIM.net Company Profile |
SEC |
Zacks Reports |
StockTalk |
News |
Chart |
Request a new note
C
A N
S L
I M
|
Symbol/Exchange
Company Name
Industry Group |
PRICE |
CHANGE
(%Change) |
Day High |
Volume
(% DAV)
(% 50 day avg vol) |
52 Wk Hi
% From Hi |
Featured
Date |
Price
Featured |
Pivot Featured |
|
Max Buy |
ULTA
-
NASDAQ
Ulta Salon Cosm & Frag
SPECIALTY RETAIL - Specialty Retail, Other
|
$34.74
|
+0.25
0.72% |
$34.97
|
356,790
61.42% of 50 DAV
50 DAV is 580,900
|
$37.24
-6.71%
|
9/3/2010
|
$26.36
|
PP = $25.89
|
|
MB = $27.18
|
Most Recent Note - 12/22/2010 5:03:45 PM
G - Solid gain today with above average volume, rallying up from its 50 DMA line -which is a classic support level chart readers always watch closely. Subsequent deterioration below it or the most recent chart low ($32.01 on 12/15/10) would raise concerns and trigger technical sell signals.
>>> The latest Featured Stock Update with an annotated graph appeared on 12/22/2010. Click here.
View all notes |
Alert me of new notes |
CANSLIM.net Company Profile |
SEC |
Zacks Reports |
StockTalk |
News |
Chart |
Request a new note
C
A N
S L
I M
|
VIT
-
NYSE
Vanceinfo Tech Inc Ads
COMPUTER SOFTWARE and SERVICES - Business Software and Services
|
$34.45
|
-0.37
-1.06% |
$34.83
|
268,289
40.41% of 50 DAV
50 DAV is 663,900
|
$41.06
-16.10%
|
7/8/2010
|
$25.20
|
PP = $26.58
|
|
MB = $27.91
|
Most Recent Note - 12/22/2010 5:35:43 PM
G - The longer it remains below its 50 DMA line, the worse the outlook gets, and any violation of its recent low ($33.71 on 12/15/10) would raise greater concerns and trigger additional sell signals. It has been enduring worrisome distributional pressure and its Relative Strength has slumped since it completed a Public Offering on 11/23/10.
>>> The latest Featured Stock Update with an annotated graph appeared on 12/9/2010. Click here.
View all notes |
Alert me of new notes |
CANSLIM.net Company Profile |
SEC |
Zacks Reports |
StockTalk |
News |
Chart |
Request a new note
C
A N
S L
I M
|