You are not logged in.
This means you
CAN ONLY VIEW reports that were published prior to Monday, April 14, 2025.
You
MUST UPGRADE YOUR MEMBERSHIP if you want to see any current reports.
AFTER MARKET UPDATE - TUESDAY, DECEMBER 18TH, 2012
Previous After Market Report Next After Market Report >>>
|
|
|
|
DOW |
+115.57 |
13,350.96 |
+0.87% |
|
Volume |
820,570,910 |
+17% |
|
Volume |
1,951,676,750 |
+5% |
|
NASDAQ |
+43.93 |
3,054.53 |
+1.46% |
|
Advancers |
2,276 |
72% |
|
Advancers |
1,795 |
69% |
|
S&P 500 |
+16.43 |
1,446.79 |
+1.15% |
|
Decliners |
795 |
25% |
|
Decliners |
708 |
27% |
|
Russell 2000 |
+12.69 |
847.69 |
+1.52% |
|
52 Wk Highs |
176 |
|
|
52 Wk Highs |
97 |
|
|
S&P 600 |
+7.43 |
475.28 |
+1.59% |
|
52 Wk Lows |
19 |
|
|
52 Wk Lows |
22 |
|
|
 |
Breadth Positive as Major Averages Rise With Better Volume Again
Kenneth J. Gruneisen - Passed the CAN SLIM® Master's Exam
The market extended its gains on Tuesday after Standard & Poor's raised its credit rating and outlook for Greece's sovereign debt. The major averages rallied while the volume totals were reported higher than the prior session totals on both the NYSE and the Nasdaq exchange, indicating even heartier buying demand from the institutional crowd. Breadth was positive as advancers led decliners by more than an 11-4 margin on the NYSE and on the Nasdaq exchange. The total number of stocks hitting new 52-week highs solidly outnumbered new 52-week lows on the NYSE and on the Nasdaq exchange. There were 75 high-ranked companies from the CANSLIM.net Leaders List making new 52-week highs and appearing on the CANSLIM.net BreakOuts Page, more than doubling the prior session total of 36 stocks. Any sustainable rally requires a healthy crop of companies hitting new 52-week highs, so it was an encouraging sign to see a meaningful expansion in leadership. There were gains for 10 of the 12 high-ranked companies currently included on the Featured Stocks Page.
The major averages advanced for a second day as investors remained hopeful for a deal in Washington to avoid the fiscal cliff. House Speaker Boehner proposed a tax increase on those earning more than $1 million and deferring a plan on spending cuts. Homebuilders rallied, with PulteGroup Inc (PHM +3.16%) trading up after the NAHB sentiment survey rose for an eighth consecutive month to 47 in December.
Energy was one of the best performing sectors as shares of Chevron Corp (CVX +1.31%) and Schlumberger Ltd (SLB +2.40%) rose as the price of oil advanced. Bank of America Corp (BAC +3.27%) paced gains in the financials. Tech also outperformed with Apple Inc (AAPL +2.90%) rising following a report Samsung will withdraw an injunction against the company in Europe.
Treasuries declined with the 10-year note falling 7/16 to yield 1.82%.
Technically, the market direction (M criteria) remains in a confirmed uptrend. The Nasdaq Composite Index, benchmark S&P 500 Index, and the Dow Jones Industrial Average are again collectively rallying above their respective 50-day moving average (DMA) lines. New buying efforts may be justified only in worthy high-ranked leaders. See the noteworthy companies included on the Featured Stocks Page.
Watch for an announcement via email concerning the next WEBCAST. The webcast will also be available via an updated link highlighted at the top of the Premium Member Homepage.
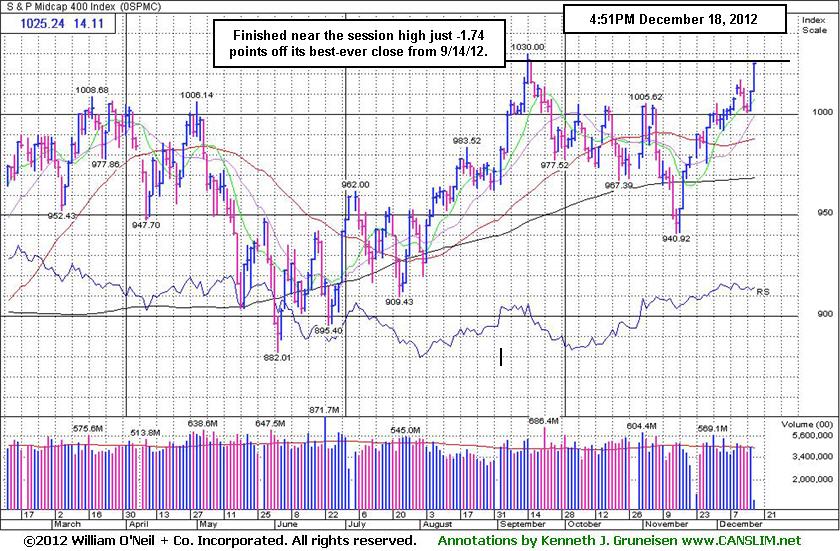
PICTURED: The S&P Mid-Cap 400 Index is rallying well above its 50-day and 200-day moving average (DMA) lines, finishing only -1.74 points off its best-ever close and all-time high hit on 9/14/12.
|
 Kenneth J. Gruneisen started out as a licensed stockbroker in August 1987, a couple of months prior to the historic stock market crash that took the Dow Jones Industrial Average down -22.6% in a single day. He has published daily fact-based fundamental and technical analysis on high-ranked stocks online for two decades. Through FACTBASEDINVESTING.COM, Kenneth provides educational articles, news, market commentary, and other information regarding proven investment systems that work in good times and bad.
Comments contained in the body of this report are technical opinions only and are not necessarily those of Gruneisen Growth Corp. The material herein has been obtained from sources believed to be reliable and accurate, however, its accuracy and completeness cannot be guaranteed. Our firm, employees, and customers may effect transactions, including transactions contrary to any recommendation herein, or have positions in the securities mentioned herein or options with respect thereto. Any recommendation contained in this report may not be suitable for all investors and it is not to be deemed an offer or solicitation on our part with respect to the purchase or sale of any securities. |
|
 |
Financial, Tech, and Energy Groups Led Gainers
Kenneth J. Gruneisen - Passed the CAN SLIM® Master's Exam
Gains in the financial group continued to underpin the market's rally on Tuesday as the Bank Index ($BKX +1.94%) and Broker/Dealer Index ($XBD +2.43%) posted solid gains. The Networking Index ($NWX +2.56%) led the tech sector higher while the Semiconductor Index ($SOX +1.60%), Internet Index ($IIX +1.61%), and the Biotechnology Index ($BTK +1.07%) posted unanimous gains. The Retail Index ($RLX +0.90%) ended modestly higher, and strength in energy-related shares gave the Oil Services Index ($OSX +3.13%) and the Integrated Oil Index ($XOI +1.36%) a boost. Defensive groups lagged as the Healthcare Index ($HMO +0.66%) posted a small gain and the Gold & Silver Index ($XAU -1.52%) sputtered for a loss.
Charts courtesy www.stockcharts.com
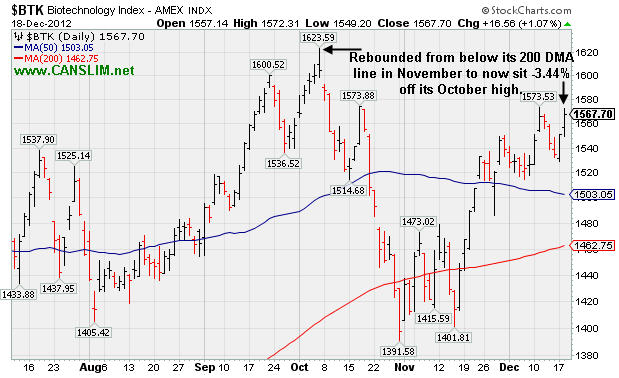
PICTURED: The Biotechnology Index ($BTK +1.07%) rebounded from below its 200-day moving average (DMA) line in November to now sit -3.44% off its October high.
| Oil Services |
$OSX |
223.67 |
+6.79 |
+3.13% |
+3.42% |
| Healthcare |
$HMO |
2,541.53 |
+16.72 |
+0.66% |
+11.39% |
| Integrated Oil |
$XOI |
1,262.78 |
+16.92 |
+1.36% |
+2.74% |
| Semiconductor |
$SOX |
388.73 |
+6.11 |
+1.60% |
+6.67% |
| Networking |
$NWX |
228.16 |
+5.70 |
+2.56% |
+6.04% |
| Internet |
$IIX |
334.55 |
+5.31 |
+1.61% |
+18.74% |
| Broker/Dealer |
$XBD |
92.12 |
+2.18 |
+2.43% |
+10.63% |
| Retail |
$RLX |
668.94 |
+5.95 |
+0.90% |
+27.86% |
| Gold & Silver |
$XAU |
162.54 |
-2.51 |
-1.52% |
-10.02% |
| Bank |
$BKX |
51.60 |
+0.98 |
+1.94% |
+31.03% |
| Biotech |
$BTK |
1,567.70 |
+16.56 |
+1.07% |
+43.64% |
|
|
|
 |
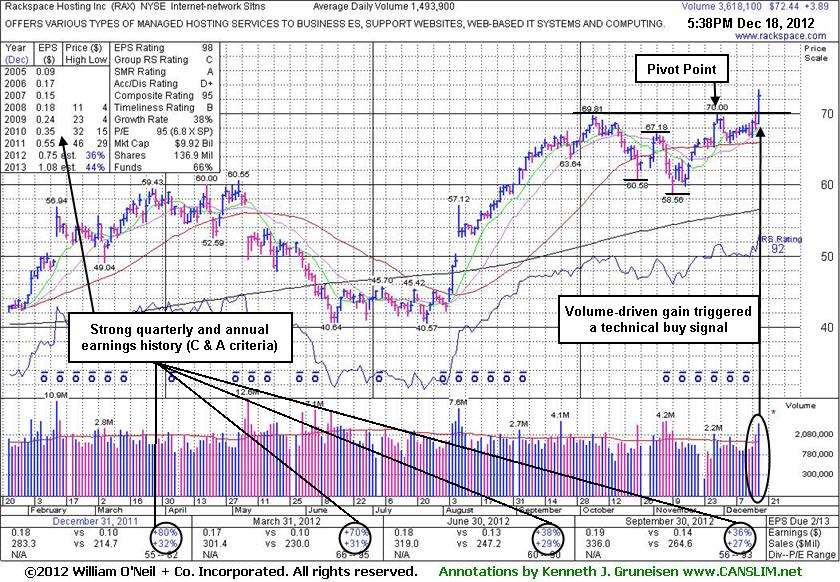
Volume-Driven Gain Above New Pivot Point Triggered Technical Buy Signal
Kenneth J. Gruneisen - Passed the CAN SLIM® Master's Exam
Rackspace Hosting Inc (RAX +$3.89 or +5.67% to $72.44) hit a new 52-week high today with a solid gain backed by +142% above average volume. Its strong close above the new pivot point cited based on its 11/29/12 high plus 10 cents clinched a new (or add-on) technical buy signal. It made little progress from the previously noted "double bottom" base, even with no resistance due to overhead supply. There is no assurance that it will go on to produce great gains now, but the volume-driven gain above the latest pivot is a convincing sign that it may be capable of a more substantial rally in the weeks and months ahead.
It was last shown in this FSU section on 11/27/12 with an annotated graph under the headline, "Set-Up Awaiting Confirming Gains Above New Pivot Point", while quietly consolidating after rebounding just above its 50-day moving average (DMA) line and working on a "double bottom" base. A recent streak of 10 consecutive weekly gains had helped it rebound impressively from below its 200 DMA line following a deep consolidation since dropped from the Featured Stocks list on 5/14/12. Subsequent gains above its pivot point did not have the necessary volume to trigger a new technical buy signal, however, as prior coverage cautioned members - "It makes sense to wait and watch for proof of fresh institutional buying demand to trigger a proper technical buy signal rather than jumping in early."
It reported earnings +36% on +27% sales revenues for the quarter ended September 30, 2012 versus the year ago period and its fundamentals remain strong. The past 11 quarterly earnings comparisons have shown better than +25% increases. Its annual earnings history (A criteria) since trading began in 2008 has been good. Increasing institutional ownership (I criteria) is a reassuring sign, as the number of top-rated funds owning its shares rose from 408 in Dec '10 to 652 in Sep '12.
 |
|
|
Color Codes Explained :
Y - Better candidates highlighted by our
staff of experts.
G - Previously featured
in past reports as yellow but may no longer be buyable under the
guidelines.
***Last / Change / Volume data in this table is the closing quote data***
Symbol/Exchange
Company Name
Industry Group |
PRICE |
CHANGE
(%Change) |
Day High |
Volume
(% DAV)
(% 50 day avg vol) |
52 Wk Hi
% From Hi |
Featured
Date |
Price
Featured |
Pivot Featured |
|
Max Buy |
CELG
-
NASDAQ
Celgene Corp
DRUGS - Drug Manufacturers - Major
|
$80.03
|
-0.41
-0.51% |
$80.95
|
3,346,248
119.79% of 50 DAV
50 DAV is 2,793,400
|
$82.78
-3.32%
|
12/11/2012
|
$82.24
|
PP = $81.34
|
|
MB = $85.41
|
Most Recent Note - 12/17/2012 5:42:05 PM
Y - Halted its slide with a gain today. Slumped below its pivot point following a technical buy signal on 12/11/12, however its small losses lacked great volume conviction. Disciplined investors always limit losses if any stock falls -7% from their purchase price.
>>> The latest Featured Stock Update with an annotated graph appeared on 12/12/2012. Click here.
View all notes |
Alert me of new notes |
CANSLIM.net Company Profile |
SEC |
Zacks Reports |
StockTalk |
News |
Chart |
Request a new note
C
A N
S L
I M


|
CFNL
-
NASDAQ
Cardinal Financial Corp
BANKING - Regional - Southeast Banks
|
$16.16
|
+0.38
2.41% |
$16.32
|
293,523
145.45% of 50 DAV
50 DAV is 201,800
|
$16.21
-0.31%
|
12/3/2012
|
$15.20
|
PP = $16.31
|
|
MB = $17.13
|
 Most Recent Note - 12/18/2012 4:04:26 PM
Y - A 2nd consecutive volume-driven gain today led to a best-ever close. A rally above its pivot point backed by at least +40% above average volume is still needed to trigger a proper new (or add-on) technical buy signal.
>>> The latest Featured Stock Update with an annotated graph appeared on 12/10/2012. Click here.
View all notes |
Alert me of new notes |
CANSLIM.net Company Profile |
SEC |
Zacks Reports |
StockTalk |
News |
Chart |
Request a new note
C
A N
S L
I M
|
CMCSA
-
NASDAQ
Comcast Corp Cl A
MEDIA - CATV Systems
|
$38.05
|
+0.52
1.37% |
$38.15
|
13,814,764
117.02% of 50 DAV
50 DAV is 11,805,100
|
$37.96
0.24%
|
12/3/2012
|
$37.08
|
PP = $38.06
|
|
MB = $39.96
|
Most Recent Note - 12/17/2012 5:36:01 PM
Y - Rallied up from its 50 DMA line with a volume-driven gain today, finishing only -1.1% off its 52-week high. Disciplined investors will watch for gains above the pivot point backed by at least the bare minimum +40% above average volume threshold to trigger a proper new (or add-on) technical buy signal before taking action.
>>> The latest Featured Stock Update with an annotated graph appeared on 12/7/2012. Click here.
View all notes |
Alert me of new notes |
CANSLIM.net Company Profile |
SEC |
Zacks Reports |
StockTalk |
News |
Chart |
Request a new note
C
A N
S L
I M
|
MIDD
-
NASDAQ
Middleby Corp
MANUFACTURING - Diversified Machinery
|
$132.39
|
+3.04
2.35% |
$133.14
|
264,745
342.05% of 50 DAV
50 DAV is 77,400
|
$129.99
1.85%
|
10/8/2012
|
$118.46
|
PP = $122.67
|
|
MB = $128.80
|
Most Recent Note - 12/18/2012 12:21:10 PM
G - Hitting new 52-week and all-time highs with today's volume-driven gain, getting more extended beyond its "max buy" level. Earnings +23% on +18% sales for the Sep '12 quarter, below the +25% minimum earnings guideline (C criteria), raised concerns.
>>> The latest Featured Stock Update with an annotated graph appeared on 12/6/2012. Click here.
View all notes |
Alert me of new notes |
CANSLIM.net Company Profile |
SEC |
Zacks Reports |
StockTalk |
News |
Chart |
Request a new note
C
A N
S L
I M
|
N
-
NYSE
Netsuite Inc
DIVERSIFIED SERVICES - Business/Management Services
|
$66.26
|
+1.36
2.10% |
$66.71
|
425,998
91.10% of 50 DAV
50 DAV is 467,600
|
$67.02
-1.13%
|
12/12/2012
|
$64.75
|
PP = $67.12
|
|
MB = $70.48
|
Most Recent Note - 12/18/2012 4:06:00 PM
Y - Its 3rd consecutive gain on light volume today led to a best-ever close. Fundamentals (C and A criteria) remain strong and it was highlighted in yellow with new pivot point cited based on its 10/26/12 high plus 10 cents. Disciplined investors will watch for subsequent volume-driven gains above the pivot point which may trigger a technical buy signal before taking action.
>>> The latest Featured Stock Update with an annotated graph appeared on 12/13/2012. Click here.
View all notes |
Alert me of new notes |
CANSLIM.net Company Profile |
SEC |
Zacks Reports |
StockTalk |
News |
Chart |
Request a new note
C
A N
S L
I M
|
Symbol/Exchange
Company Name
Industry Group |
PRICE |
CHANGE
(%Change) |
Day High |
Volume
(% DAV)
(% 50 day avg vol) |
52 Wk Hi
% From Hi |
Featured
Date |
Price
Featured |
Pivot Featured |
|
Max Buy |
NSR
-
NYSE
Neustar Inc
TELECOMMUNICATIONS - Diversified Communication Serv
|
$43.20
|
+0.66
1.55% |
$43.85
|
584,379
169.63% of 50 DAV
50 DAV is 344,500
|
$43.29
-0.21%
|
12/11/2012
|
$41.85
|
PP = $41.41
|
|
MB = $43.48
|
Most Recent Note - 12/17/2012 12:25:48 PM
Y - Trading up today with higher volume, yet it remains below its "max buy" level. Clinched a technical buy signal on 12/11/12 as it rallied from a 10-week base. Quarterly comparisons through Sep '12 showed 3 consecutive increases of more than the +25% minimum earnings guideline (C criteria). Prior highs near $41 define initial support to watch on pullbacks.
>>> The latest Featured Stock Update with an annotated graph appeared on 12/11/2012. Click here.
View all notes |
Alert me of new notes |
CANSLIM.net Company Profile |
SEC |
Zacks Reports |
StockTalk |
News |
Chart |
Request a new note
C
A N
S L
I M
|
RAX
-
NYSE
Rackspace Hosting Inc
INTERNET - Internet Software and; Services
|
$72.44
|
+3.89
5.67% |
$73.37
|
3,621,128
242.39% of 50 DAV
50 DAV is 1,493,900
|
$70.37
2.94%
|
12/18/2012
|
$71.88
|
PP = $70.10
|
|
MB = $73.61
|
Most Recent Note - 12/18/2012 5:49:46 PM
Y - Rallied and closed above a new pivot point cited based on its 11/29/12 high plus 10 cents clinching a new (or add-on) technical buy signal. See the latest FSU analysis for more details and a new annotated graph.
>>> The latest Featured Stock Update with an annotated graph appeared on 12/18/2012. Click here.
View all notes |
Alert me of new notes |
CANSLIM.net Company Profile |
SEC |
Zacks Reports |
StockTalk |
News |
Chart |
Request a new note
C
A N
S L
I M
|
RGR
-
NYSE
Sturm Ruger & Co Inc
CONSUMER DURABLES - Sporting Goods
|
$40.60
|
-3.40
-7.73% |
$42.90
|
3,015,933
540.97% of 50 DAV
50 DAV is 557,500
|
$55.66
-27.05%
|
11/20/2012
|
$52.23
|
PP = $52.65
|
|
MB = $55.28
|
Most Recent Note - 12/18/2012 4:26:11 PM
Finished in the lower half of its intra-day range after a gap down today violated its 200 DMA line. It may find support near its August - November lows however it will be dropped from the Featured Stocks list tonight after damaging distributional action left it -26.9% off its 11/30/12 high. Firearms-makers have endured heavy selling following recent tragedies.
>>> The latest Featured Stock Update with an annotated graph appeared on 12/14/2012. Click here.
View all notes |
Alert me of new notes |
CANSLIM.net Company Profile |
SEC |
Zacks Reports |
StockTalk |
News |
Chart |
Request a new note
C
A N
S L
I M
|
RNF
-
NYSE
Rentech Nitrogen Ptnr Lp
CHEMICALS - Agricultural Chemicals
|
$37.84
|
+1.12
3.05% |
$38.25
|
404,529
130.12% of 50 DAV
50 DAV is 310,900
|
$41.15
-8.04%
|
11/1/2012
|
$39.11
|
PP = $40.15
|
|
MB = $42.16
|
Most Recent Note - 12/18/2012 4:08:04 PM
Y - Rebounded above its 50 DMA line with a volume-driven gain today and its color code is changed to yellow. Disciplined investors may watch for volume-driven gains for a new high close to trigger a technical buy signal.
>>> The latest Featured Stock Update with an annotated graph appeared on 11/26/2012. Click here.
View all notes |
Alert me of new notes |
CANSLIM.net Company Profile |
SEC |
Zacks Reports |
StockTalk |
News |
Chart |
Request a new note
C
A N
S L
I M
|
ULTA
-
NASDAQ
Ulta Salon Cosm & Frag
SPECIALTY RETAIL - Specialty Retail, Other
|
$97.92
|
+0.68
0.70% |
$98.67
|
673,985
84.53% of 50 DAV
50 DAV is 797,300
|
$103.52
-5.41%
|
12/4/2012
|
$100.29
|
PP = $103.62
|
|
MB = $108.80
|
Most Recent Note - 12/17/2012 5:39:08 PM
Y - Found support at its 50 DMA line last week and tallied a 2nd consecutive gain today on near average volume. Disciplined investors will watch for volume-driven gains above the pivot point to trigger a new technical buy signal.
>>> The latest Featured Stock Update with an annotated graph appeared on 12/4/2012. Click here.
View all notes |
Alert me of new notes |
CANSLIM.net Company Profile |
SEC |
Zacks Reports |
StockTalk |
News |
Chart |
Request a new note
C
A N
S L
I M
|
Symbol/Exchange
Company Name
Industry Group |
PRICE |
CHANGE
(%Change) |
Day High |
Volume
(% DAV)
(% 50 day avg vol) |
52 Wk Hi
% From Hi |
Featured
Date |
Price
Featured |
Pivot Featured |
|
Max Buy |
VSI
-
NYSE
Vitamin Shoppe Inc
SPECIALTY RETAIL - Specialty Retail, Other
|
$58.76
|
+2.31
4.09% |
$58.84
|
310,803
127.69% of 50 DAV
50 DAV is 243,400
|
$61.89
-5.06%
|
12/3/2012
|
$59.06
|
PP = $61.99
|
|
MB = $65.09
|
Most Recent Note - 12/18/2012 4:01:11 PM
Y - Solid gain on above average volume and strong close near the session high today helped it rally back above its 50 DMA line and its color code is changed to yellow. The $61 area has been a stubborn resistance level in recent months.
>>> The latest Featured Stock Update with an annotated graph appeared on 12/3/2012. Click here.
View all notes |
Alert me of new notes |
CANSLIM.net Company Profile |
SEC |
Zacks Reports |
StockTalk |
News |
Chart |
Request a new note
C
A N
S L
I M
|
WPI
-
NYSE
Watson Pharmaceuticals
DRUGS - Drugs - Generic
|
$89.81
|
+1.82
2.07% |
$89.89
|
743,665
97.21% of 50 DAV
50 DAV is 765,000
|
$90.39
-0.64%
|
12/17/2012
|
$87.99
|
PP = $90.49
|
|
MB = $95.01
|
Most Recent Note - 12/18/2012 4:20:47 PM
Y - Up today with average volume for a best-ever close. Perched within close striking distance of its 52-week high today and no resistance remains due to overhead supply. Color code was changed to yellow with new pivot point cited based on its 12/12/12 high plus 10 cents.
>>> The latest Featured Stock Update with an annotated graph appeared on 12/17/2012. Click here.
View all notes |
Alert me of new notes |
CANSLIM.net Company Profile |
SEC |
Zacks Reports |
StockTalk |
News |
Chart |
Request a new note
C
A N
S L
I M
|
|
|
|
THESE ARE NOT BUY RECOMMENDATIONS!
Comments contained in the body of this report are technical
opinions only. The material herein has been obtained
from sources believed to be reliable and accurate, however,
its accuracy and completeness cannot be guaranteed.
This site is not an investment advisor, hence it does
not endorse or recommend any securities or other investments.
Any recommendation contained in this report may not
be suitable for all investors and it is not to be deemed
an offer or solicitation on our part with respect to
the purchase or sale of any securities. All trademarks,
service marks and trade names appearing in this report
are the property of their respective owners, and are
likewise used for identification purposes only.
This report is a service available
only to active Paid Premium Members.
You may opt-out of receiving report notifications
at any time. Questions or comments may be submitted
by writing to Premium Membership Services 665 S.E. 10 Street, Suite 201 Deerfield Beach, FL 33441-5634 or by calling 1-800-965-8307
or 954-785-1121.
|
|
|

