You are not logged in.
This means you
CAN ONLY VIEW reports that were published prior to Monday, April 14, 2025.
You
MUST UPGRADE YOUR MEMBERSHIP if you want to see any current reports.
AFTER MARKET UPDATE - TUESDAY, DECEMBER 16TH, 2014
Previous After Market Report Next After Market Report >>>
|
|
|
|
DOW |
-111.97 |
17,068.87 |
-0.65% |
|
Volume |
996,380,780 |
+5% |
|
Volume |
2,120,807,930 |
+6% |
|
NASDAQ |
-57.33 |
4,547.83 |
-1.24% |
|
Advancers |
1,289 |
40% |
|
Advancers |
1,305 |
43% |
|
S&P 500 |
-16.89 |
1,972.74 |
-0.85% |
|
Decliners |
1,807 |
57% |
|
Decliners |
1,640 |
54% |
|
Russell 2000 |
-0.92 |
1,139.37 |
-0.08% |
|
52 Wk Highs |
23 |
|
|
52 Wk Highs |
28 |
|
|
S&P 600 |
-0.93 |
657.55 |
-0.14% |
|
52 Wk Lows |
426 |
|
|
52 Wk Lows |
215 |
|
|
 |
Bearish Action Continues With Weak Finish After Early Gains Were Erased
Kenneth J. Gruneisen - Passed the CAN SLIM® Master's Exam
Stocks finished lower in a volatile trading session. The Dow fell 112 points to 17,068, erasing an early advance of as many as 254 points. The S&P 500 was up as many as 30 points but finished with a loss of 16 points to 1,972. The NASDAQ Composite declined 57 points to 4,547. Volume was reported higher on the NYSE and on the Nasdaq exchange, a sign of more distributional pressure from the institutional crowd. Breadth was negative as decliners led advancers by a 3-2 margin on the NYSE and 4-3 on the Nasdaq exchange. There were 10 high-ranked companies from the CANSLIM.net Leaders List that made new 52-week highs and appeared on the CANSLIM.net BreakOuts Page, down from the prior session total of 13 stocks. The new 52-week lows totals swelled again and easily outnumbered new 52-week highs on the NYSE and on the Nasdaq exchange. There were 3 gainers among the 12 high-ranked companies currently on the Featured Stocks Page. Recent weakness was noted as the uptrend came under pressure and the major averages, technically, slumped below their respective 50-day moving average (DMA) lines. Meanwhile, leadership (new highs) has waned since Friday's poor action as the broader market (M criteria) earned the label of a "correction". Disciplined investors should be especially watchful for technical sell signals in individual issues. The fact-based investment system suggests for investors to shift their bias toward selling and reducing market exposure until fresh strength appears in the broader market.
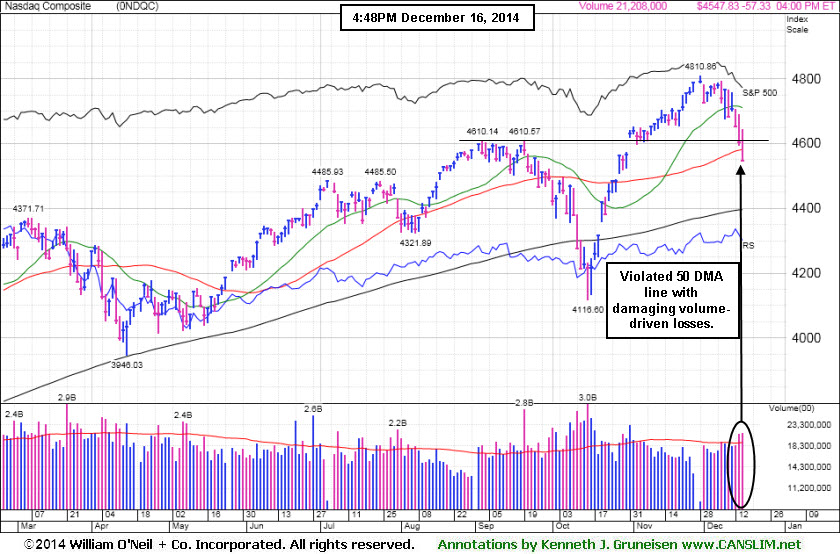
PICTURED: The Nasdaq Composite Index violated its 50-day moving average (DMA) line with volume-driven losses.
The major averages retreated as investors grew cautious ahead of tomorrow’s FOMC statement. The Fed is widely expected to leave interest rates unchanged but may remove its "considerable time" forward guidance language. Disappointing economic data added to investor hesitation. Housing starts unexpectedly declined last month for the first time since August, while building permits fell by the most since January. A separate report showed the U.S. manufacturing sector continued to expand this month but edged lower to an 11-month low.
Eight of the 10 sectors in the S&P 500 declined. Consumer discretionary and tech were the worst performing groups. Amazon (AMZN -3.60%) and Microsoft (MSFT -3.24%) fell. Losses in health care and financials also weighed on the market. Gilead Sciences (GILD -2.62%) sank and Citigroup (C -3.07%) declined. Gains in energy helped limit the market's retreat as WTI crude rebounded after sliding below $55 a barrel for the first time in more than five years. Chevron (CVX +0.83%) rose.
Treasuries extended their recent gains. The 10-year note rose 18/32 to yield 2.05%.
Disciplined investors know that new buying efforts may be made under the fact-based investment system only in stocks meeting all key criteria. The Featured Stocks Page shows the most action-worthy candidates and their latest notes and a Headline Link directs members to the latest detailed analysis with data-packed graphs annotated by a Certified expert along with links to additional resources. The Premium Member Homepage includes "dynamic archives" to all prior pay reports published.
|
 Kenneth J. Gruneisen started out as a licensed stockbroker in August 1987, a couple of months prior to the historic stock market crash that took the Dow Jones Industrial Average down -22.6% in a single day. He has published daily fact-based fundamental and technical analysis on high-ranked stocks online for two decades. Through FACTBASEDINVESTING.COM, Kenneth provides educational articles, news, market commentary, and other information regarding proven investment systems that work in good times and bad.
Comments contained in the body of this report are technical opinions only and are not necessarily those of Gruneisen Growth Corp. The material herein has been obtained from sources believed to be reliable and accurate, however, its accuracy and completeness cannot be guaranteed. Our firm, employees, and customers may effect transactions, including transactions contrary to any recommendation herein, or have positions in the securities mentioned herein or options with respect thereto. Any recommendation contained in this report may not be suitable for all investors and it is not to be deemed an offer or solicitation on our part with respect to the purchase or sale of any securities. |
|
 |
Energy-Related Groups Rose Against Mostly Negative Backdrop
Kenneth J. Gruneisen - Passed the CAN SLIM® Master's Exam
Energy-related shares posted gains as the Oil Services Index ($OSX +1.33%) and the Integrated Oil Index ($XOI +1.54%) bounced on Tuesday making them standout gainers. Meanwhile the Retail Index ($RLX -2.22%) slumped and modest losses in the financial groups created a drag on the major averages while the Bank Index ($BKX -0.87%) and the Broker/Dealer Index ($XBD -0.73%) ended lower. The Gold & Silver Index ($XAU -1.47%) and Biotechnology Index ($BTK -1.27%) lost more than -1% each while the Semiconductor Index ($SOX -0.66%) suffered a smaller loss and the Networking Index ($NWX -0.13%) finished with a tiny loss.
Charts courtesy www.stockcharts.com
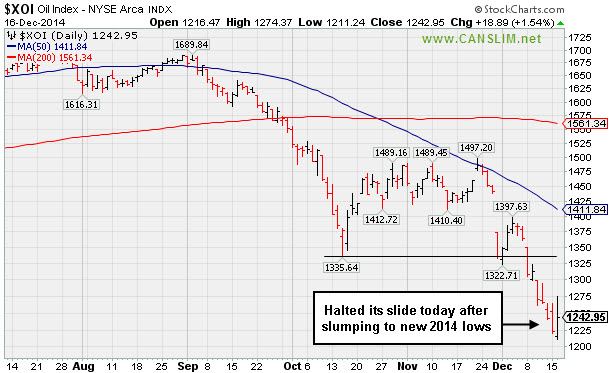
PICTURED: The Integrated Oil Index ($XOI +1.54%) halted its slide after recently slumping to new 2014 lows.
| Oil Services |
$OSX |
198.29 |
+2.60 |
+1.33% |
-29.44% |
| Integrated Oil |
$XOI |
1,242.95 |
+18.89 |
+1.54% |
-17.31% |
| Semiconductor |
$SOX |
661.30 |
-4.41 |
-0.66% |
+23.60% |
| Networking |
$NWX |
339.78 |
-0.43 |
-0.13% |
+4.89% |
| Broker/Dealer |
$XBD |
175.40 |
-1.28 |
-0.73% |
+9.25% |
| Retail |
$RLX |
973.11 |
-22.14 |
-2.22% |
+3.54% |
| Gold & Silver |
$XAU |
63.15 |
-0.94 |
-1.47% |
-24.96% |
| Bank |
$BKX |
70.51 |
-0.62 |
-0.87% |
+1.80% |
| Biotech |
$BTK |
3,280.93 |
-42.04 |
-1.27% |
+40.79% |
|
|
|
 |
Violated 50-Day Moving Average Triggering Technical Sell Signal
Kenneth J. Gruneisen - Passed the CAN SLIM® Master's Exam
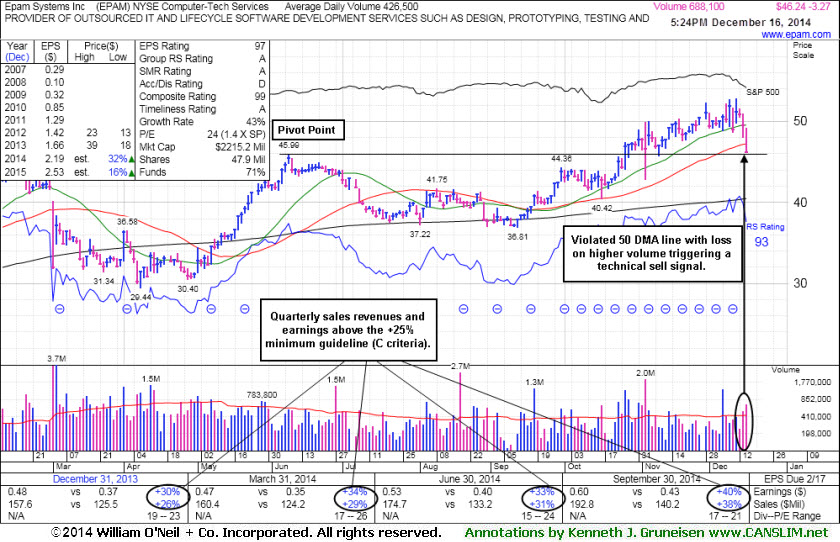
Epam Systems Inc (EPAM -$3.27 or -6.60% to $46.24) endured more distributional pressure and violated its 50-day moving average (DMA) line with a volume-driven loss today raising concerns and triggering a technical sell signal. It is testing prior highs in the $45-46 area which define the next important near-term support to watch. More damaging losses would raise serious concerns, meanwhile, only a prompt rebound above the 50 DMA line may help its outlook improve.
It was last shown in this FSU section on 11/26/14 with annotated graphs under the headline, "Quiet Gain For New High Close". The high-ranked Computer - Tech Services firm reported earnings +40% on +38% sales revenues for the Sep '14 quarter and also gave upbeat sales guidance. It had previously reported earnings +33% on +31% sales revenues for the Jun '14 quarter. Its 4 consecutive quarters with earnings above the +25% guideline makes it a solid match concerning the C criteria. Annual earnings growth (A criteria) has been strong.
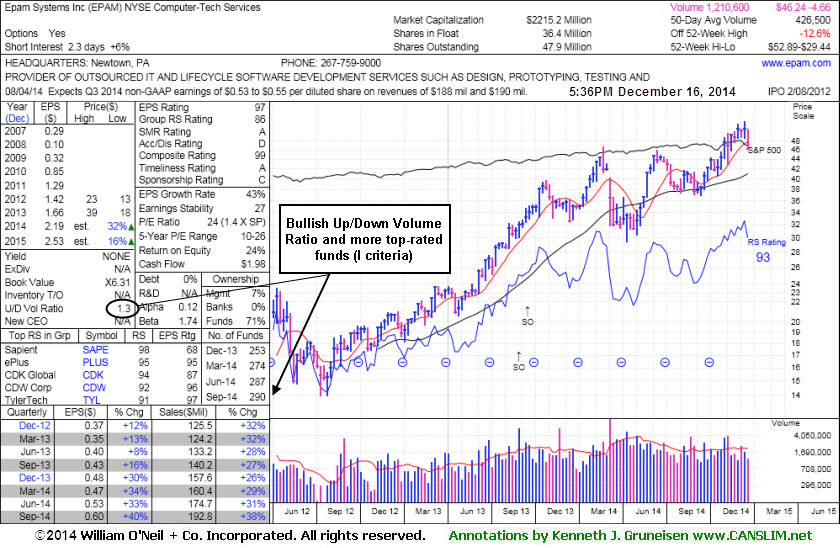
It completed Secondary Offerings 8/30/13 and 9/17/13. Its current Up/Down Volume Ratio of 1.3 is an unbiased indication its shares have been under accumulation in the past 50 days. The number of top-rated funds owning its shares rose from 254 in Dec '13 to 290 in Sep '14, a reassuring sign concerning the I criteria. Its small supply of only 36.4 million shares (S criteria) can contribute to greater volatility in the event of institutional buying or selling.
|
|
|
Color Codes Explained :
Y - Better candidates highlighted by our
staff of experts.
G - Previously featured
in past reports as yellow but may no longer be buyable under the
guidelines.
***Last / Change / Volume data in this table is the closing quote data***
Symbol/Exchange
Company Name
Industry Group |
PRICE |
CHANGE
(%Change) |
Day High |
Volume
(% DAV)
(% 50 day avg vol) |
52 Wk Hi
% From Hi |
Featured
Date |
Price
Featured |
Pivot Featured |
|
Max Buy |
ACT
-
NYSE
Actavis plc
Medical-Generic Drugs
|
$256.52
|
-6.48
-2.46% |
$263.61
|
3,322,971
104.83% of 50 DAV
50 DAV is 3,170,000
|
$272.75
-5.95%
|
6/20/2014
|
$216.53
|
PP = $230.87
|
|
MB = $242.41
|
 Most Recent Note - 12/16/2014 5:54:54 PM
G - Consolidating following recent volume-driven gains on news it plans to acquire Allergan (AGN) for $66 Billion. Extended from prior highs in the $249 area defining near-term support.
>>> FEATURED STOCK ARTICLE : Consolidating After Rally on Acquisition Plans - 12/12/2014
View all notes |
Set NEW NOTE alert |
CANSLIM.net Company Profile |
SEC
News |
Chart |
Request a new note
C
A N
S L
I M


|
AFSI
-
NASDAQ
Amtrust Financial Svcs
INSURANCE - Property and; Casualty Insurance
|
$56.72
|
-0.58
-1.01% |
$57.83
|
644,034
60.13% of 50 DAV
50 DAV is 1,071,000
|
$59.31
-4.37%
|
10/17/2014
|
$45.24
|
PP = $46.02
|
|
MB = $48.32
|
Most Recent Note - 12/16/2014 2:41:06 PM
G - Hit a new 52-week high on the prior session. Recently rising from a brief consolidation, not a sound base. Its 50 DMA line defines important near-term support.
>>> FEATURED STOCK ARTICLE : Extended From Sound Base Pattern Identified Earlier - 12/10/2014
View all notes |
Set NEW NOTE alert |
CANSLIM.net Company Profile |
SEC
News |
Chart |
Request a new note
C
A N
S L
I M
|
ALXN
-
NASDAQ
Alexion Pharmaceuticals
DRUGS - Drug Manufacturers - Other
|
$177.73
|
-5.48
-2.99% |
$184.44
|
1,930,766
174.57% of 50 DAV
50 DAV is 1,106,000
|
$203.30
-12.58%
|
10/23/2014
|
$184.01
|
PP = $185.53
|
|
MB = $194.81
|
Most Recent Note - 12/16/2014 12:07:28 PM
G - Rebounded from earlier lows today following a damaging volume-driven loss and violation of its 50 DMA line on the prior session which triggered a technical sell signal. Only a rebound above its 50 DMA line would help its outlook improve.
>>> FEATURED STOCK ARTICLE : Quietly Consolidating Near All-Time High - 11/28/2014
View all notes |
Set NEW NOTE alert |
CANSLIM.net Company Profile |
SEC
News |
Chart |
Request a new note
C
A N
S L
I M
|
BIDU
-
NASDAQ
Baidu Inc Ads
INTERNET - Internet Information Providers
|
$219.96
|
-5.85
-2.59% |
$226.34
|
3,983,457
109.23% of 50 DAV
50 DAV is 3,647,000
|
$251.99
-12.71%
|
10/30/2014
|
$234.08
|
PP = $231.51
|
|
MB = $243.09
|
Most Recent Note - 12/16/2014 2:44:34 PM
G - Still sputtering below its 50 DMA line. Previously noted - "Additional damaging losses would trigger more worrisome technical sell signals."
>>> FEATURED STOCK ARTICLE : Consolidating Near Prior Highs and Above 50-Day Average - 12/3/2014
View all notes |
Set NEW NOTE alert |
CANSLIM.net Company Profile |
SEC
News |
Chart |
Request a new note
C
A N
S L
I M
|
EPAM
-
NYSE
Epam Systems Inc
COMPUTER SOFTWARE and SERVICES - Information Technology Service
|
$46.24
|
-3.27
-6.60% |
$49.19
|
688,195
161.55% of 50 DAV
50 DAV is 426,000
|
$52.89
-12.57%
|
10/23/2014
|
$45.21
|
PP = $46.09
|
|
MB = $48.39
|
Most Recent Note - 12/16/2014 5:50:40 PM
G - Violated its 50 DMA line with today's volume-driven loss triggering a technical sell signal. Testing prior highs in the $45-46 area defining the next important near-term support to watch. See the latest FSU analysis for more details and new annotated graphs.
>>> FEATURED STOCK ARTICLE : Violated 50-Day Moving Average Triggering Technical Sell Signal - 12/16/2014
View all notes |
Set NEW NOTE alert |
CANSLIM.net Company Profile |
SEC
News |
Chart |
Request a new note
C
A N
S L
I M
|
Symbol/Exchange
Company Name
Industry Group |
PRICE |
CHANGE
(%Change) |
Day High |
Volume
(% DAV)
(% 50 day avg vol) |
52 Wk Hi
% From Hi |
Featured
Date |
Price
Featured |
Pivot Featured |
|
Max Buy |
FB
-
NASDAQ
Facebook Inc Cl A
INTERNET
|
$74.69
|
-2.30
-2.99% |
$77.39
|
31,457,521
90.50% of 50 DAV
50 DAV is 34,759,000
|
$81.16
-7.97%
|
9/9/2014
|
$76.67
|
PP = $76.84
|
|
MB = $80.68
|
Most Recent Note - 12/16/2014 2:56:03 PM
Y - Quietly consolidating near its 50 DMA line ($75.80). Recent lows in the $72 area define the next chart support level above its 200 DMA line.
>>> FEATURED STOCK ARTICLE : Gains Above 50-Day Moving Average Needed for Outlook to Improve - 12/4/2014
View all notes |
Set NEW NOTE alert |
CANSLIM.net Company Profile |
SEC
News |
Chart |
Request a new note
C
A N
S L
I M
|
FLT
-
NYSE
Fleetcor Technologies
DIVERSIFIED SERVICES - Business/Management Services
|
$138.66
|
+0.18
0.13% |
$139.71
|
970,291
127.64% of 50 DAV
50 DAV is 760,200
|
$160.40
-13.55%
|
10/31/2014
|
$148.50
|
PP = $146.29
|
|
MB = $153.60
|
Most Recent Note - 12/16/2014 5:58:12 PM
Its Relative Strength rating has slumped to 76, below the 80+ minimum guideline for buy candidates. Violated its 50 DMA line as a damaging volume-driven loss triggered a worrisome technical sell signal last week. It will be dropped from the Featured Stocks list tonight.
>>> FEATURED STOCK ARTICLE : Testing Support While Encountering Recent Distributional Pressure - 12/8/2014
View all notes |
Set NEW NOTE alert |
CANSLIM.net Company Profile |
SEC
News |
Chart |
Request a new note
C
A N
S L
I M
|
ILMN
-
NASDAQ
Illumina Inc
DRUGS - Biotechnology
|
$175.18
|
-3.13
-1.76% |
$181.01
|
1,242,252
101.24% of 50 DAV
50 DAV is 1,227,000
|
$197.37
-11.24%
|
10/22/2014
|
$188.77
|
PP = $182.27
|
|
MB = $191.38
|
Most Recent Note - 12/16/2014 6:03:24 PM
G - Fell again today on average volume after violating its 50 DMA line with a loss on higher volume on the prior session raising concerns and triggering a technical sell signal. Only a prompt rebound above the 50 DMA line would help its outlook improve. See the latest FSU analysis for more details and annotated graphs.
>>> FEATURED STOCK ARTICLE : Violation of 50-Day Average Triggered Technical Sell Signal - 12/15/2014
View all notes |
Set NEW NOTE alert |
CANSLIM.net Company Profile |
SEC
News |
Chart |
Request a new note
C
A N
S L
I M
|
PANW
-
NYSE
Palo Alto Networks
Computer Sftwr-Security
|
$116.64
|
-1.44
-1.22% |
$118.00
|
1,191,095
64.52% of 50 DAV
50 DAV is 1,846,000
|
$123.22
-5.34%
|
7/30/2014
|
$84.21
|
PP = $85.88
|
|
MB = $90.17
|
Most Recent Note - 12/15/2014 1:45:02 PM
G - Quietly consolidating near all-time highs, it has not formed a sound base, and the 50 DMA line ($108.47) defines near-term support to watch. Reported earnings +88% on +50% sales revenues for the Oct '14 quarter.
>>> FEATURED STOCK ARTICLE : Under Accumulation But Extended From Sound Base - 12/1/2014
View all notes |
Set NEW NOTE alert |
CANSLIM.net Company Profile |
SEC
News |
Chart |
Request a new note
C
A N
S L
I M
|
RH
-
NYSE
Restoration Hardware Hld
RETAIL - Home Furnishing Stores
|
$95.09
|
+0.09
0.09% |
$96.30
|
1,489,914
160.38% of 50 DAV
50 DAV is 929,000
|
$99.44
-4.37%
|
12/11/2014
|
$98.66
|
PP = $94.60
|
|
MB = $99.33
|
Most Recent Note - 12/16/2014 6:01:42 PM
Y - Stubbornly holding its ground following a gap up gain when highlighted in the 12/11/14 mid-day report (read here). Subsequent losses leading to a close below its old high close ($93.05 on 6/30/14) would completely negate the recent breakout and raise concerns.
>>> FEATURED STOCK ARTICLE : Close in Lower Third of Intra-day Range Indicates Disributional Pressure - 12/11/2014
View all notes |
Set NEW NOTE alert |
CANSLIM.net Company Profile |
SEC
News |
Chart |
Request a new note
C
A N
S L
I M
|
Symbol/Exchange
Company Name
Industry Group |
PRICE |
CHANGE
(%Change) |
Day High |
Volume
(% DAV)
(% 50 day avg vol) |
52 Wk Hi
% From Hi |
Featured
Date |
Price
Featured |
Pivot Featured |
|
Max Buy |
STRT
-
NASDAQ
Strattec Security Corp
AUTOMOTIVE - Auto Parts
|
$84.16
|
-2.14
-2.48% |
$88.63
|
35,290
135.73% of 50 DAV
50 DAV is 26,000
|
$110.96
-24.15%
|
11/20/2014
|
$105.76
|
PP = $109.54
|
|
MB = $115.02
|
Most Recent Note - 12/16/2014 5:53:28 PM
Sank further below its 50 DMA line with above average volume behind today's loss after triggering a technical sell signal on the prior session. Only a prompt rebound above its 50 DMA line would help its outlook improve. It will be dropped from the Featured Stocks list tonight.
>>> FEATURED STOCK ARTICLE : Little Overhead Supply in Thinly Traded Company - 12/9/2014
View all notes |
Set NEW NOTE alert |
CANSLIM.net Company Profile |
SEC
News |
Chart |
Request a new note
C
A N
S L
I M
|
UIHC
-
NASDAQ
United Insurance Holding
Insurance-Prop/Cas/Titl
|
$20.28
|
+0.25
1.25% |
$20.62
|
310,471
131.56% of 50 DAV
50 DAV is 236,000
|
$22.32
-9.14%
|
12/5/2014
|
$20.64
|
PP = $20.31
|
|
MB = $21.33
|
Most Recent Note - 12/16/2014 1:34:33 PM
Y - Color code is changed to yellow while consolidating above prior highs near $20 defining initial support to watch on pullbacks. Disciplined investors avoid chasing stocks more than +5% above prior highs and always limit losses by selling any stock that falls more than -7% from its purchase price. Keep in mind that deterioration in the broader market (M criteria) has raised a caution flag.
>>> FEATURED STOCK ARTICLE : Technical Breakout Indicative of Institutional Demand - 12/5/2014
View all notes |
Set NEW NOTE alert |
CANSLIM.net Company Profile |
SEC
News |
Chart |
Request a new note
C
A N
S L
I M
|
|
|
|
THESE ARE NOT BUY RECOMMENDATIONS!
Comments contained in the body of this report are technical
opinions only. The material herein has been obtained
from sources believed to be reliable and accurate, however,
its accuracy and completeness cannot be guaranteed.
This site is not an investment advisor, hence it does
not endorse or recommend any securities or other investments.
Any recommendation contained in this report may not
be suitable for all investors and it is not to be deemed
an offer or solicitation on our part with respect to
the purchase or sale of any securities. All trademarks,
service marks and trade names appearing in this report
are the property of their respective owners, and are
likewise used for identification purposes only.
This report is a service available
only to active Paid Premium Members.
You may opt-out of receiving report notifications
at any time. Questions or comments may be submitted
by writing to Premium Membership Services 665 S.E. 10 Street, Suite 201 Deerfield Beach, FL 33441-5634 or by calling 1-800-965-8307
or 954-785-1121.
|
|
|

