You are not logged in.
This means you
CAN ONLY VIEW reports that were published prior to Monday, April 7, 2025.
You
MUST UPGRADE YOUR MEMBERSHIP if you want to see any current reports.
AFTER MARKET UPDATE - WEDNESDAY, DECEMBER 17TH, 2014
Previous After Market Report Next After Market Report >>>
|
|
|
|
DOW |
+288.00 |
17,356.87 |
+1.69% |
|
Volume |
1,022,195,430 |
+3% |
|
Volume |
2,190,262,740 |
+3% |
|
NASDAQ |
+96.48 |
4,644.31 |
+2.12% |
|
Advancers |
2,794 |
87% |
|
Advancers |
2,512 |
80% |
|
S&P 500 |
+40.15 |
2,012.89 |
+2.04% |
|
Decliners |
361 |
11% |
|
Decliners |
559 |
18% |
|
Russell 2000 |
+35.46 |
1,174.83 |
+3.11% |
|
52 Wk Highs |
63 |
|
|
52 Wk Highs |
52 |
|
|
S&P 600 |
+18.01 |
675.56 |
+2.74% |
|
52 Wk Lows |
109 |
|
|
52 Wk Lows |
100 |
|
|
 |
Major Averages Rebounded Above 50-Day Moving Average Lines
Kenneth J. Gruneisen - Passed the CAN SLIM® Master's Exam
Behind Wednesday's big gains the volume was reported higher on the NYSE and on the Nasdaq exchange, a sign of buying from the institutional crowd. Breadth was positive as advancers led decliners by almost a 7-1 margin on the NYSE and 5-1 on the Nasdaq exchange. There were 15 high-ranked companies from the CANSLIM.net Leaders List that made new 52-week highs and appeared on the CANSLIM.net BreakOuts Page, up from the prior session total of 4 stocks. Despite the improved leadership new 52-week lows outnumbered new 52-week highs on the NYSE and on the Nasdaq exchange. There gains for all 10 high-ranked companies currently on the Featured Stocks Page, a list that has recently been getting trimmed. Weakness was noted as the uptrend came under pressure and the major averages, technically, slumped below their respective 50-day moving average (DMA) lines. Leadership (new highs) has waned since Friday's poor action as the broader market (M criteria) earned the label of a "correction". Disciplined investors should be especially watchful for technical sell signals in individual issues. The fact-based investment system suggests for investors to shift their bias toward selling and reducing market exposure until fresh strength appears in the broader market.
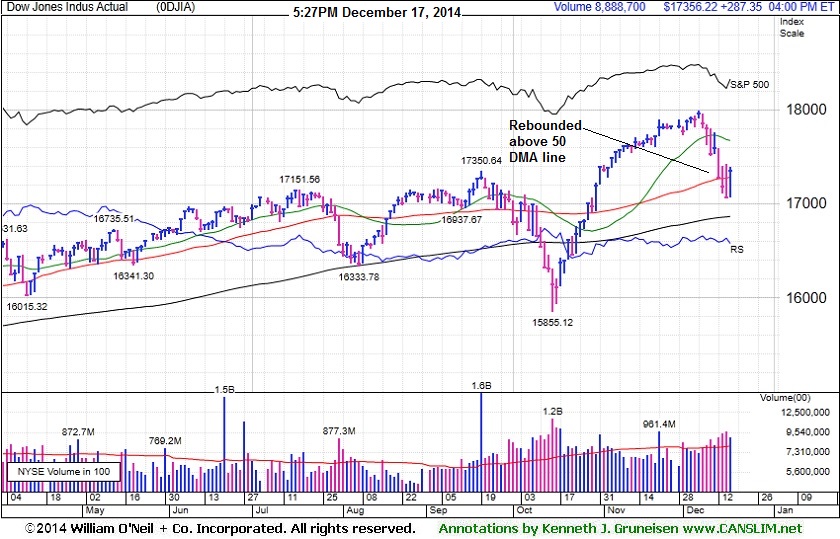
PICTURED: The Dow jumped 288 points to 17,356, rebounding above its 50-day moving average (DMA) line.
The major averages rallied on Wednesday helping the S&P 500 rebound from its lowest level since October as it gained 40 points to 2,012. The NASDAQ Composite rose 96 points to 4,644. Both indexes also rebounded above their respective 50 DMA line.
Stocks advanced as investors focused on monetary policy. The FOMC statement revealed the Fed will be "patient" in determining when to raise interest rates, replacing its previous pledge to hold rates low for a "considerable time". Policy makers also see the economy reaching full employment later next year, while inflation remains below their target of 2%. In addition, the central bank lowered its year-end 2015 fed funds rate target to 1.125% from 1.375% in September.
The spotlight was also on WTI crude’s rebound from a five-year low as it gained 0.4% to $56.17 per barrel. As a result, energy was the best performing sector in the S&P 500. Noble Energy (NBE +9.9%) and Exxon (XOM +3.2%) rose. Materials and financials also helped lift the market. LyondellBasell (LYB +5.7%) and JP Morgan Chase & Co (JPM +2.2%) rose. On the downside, FedEx (FDX -3.7%) fell after delivering a disappointing full year outlook.
Economic data was on the back burner. The consumer price index fell last month by the most since December 2008, while the U.S. current account deficit widened slightly in the third quarter to $100.3 billion.
Treasuries retreated. The 10-year note fell 23/32 to yield 2.14%..
Disciplined investors know that new buying efforts should not be made until a new uptrend is confirmed with a solid follow-through day. The Featured Stocks Page shows recent notes and Headline Links directing members to detailed analysis with data-packed graphs annotated by a Certified expert. See the Premium Member Homepage for archives to all prior pay reports published.
|
 Kenneth J. Gruneisen started out as a licensed stockbroker in August 1987, a couple of months prior to the historic stock market crash that took the Dow Jones Industrial Average down -22.6% in a single day. He has published daily fact-based fundamental and technical analysis on high-ranked stocks online for two decades. Through FACTBASEDINVESTING.COM, Kenneth provides educational articles, news, market commentary, and other information regarding proven investment systems that work in good times and bad.
Comments contained in the body of this report are technical opinions only and are not necessarily those of Gruneisen Growth Corp. The material herein has been obtained from sources believed to be reliable and accurate, however, its accuracy and completeness cannot be guaranteed. Our firm, employees, and customers may effect transactions, including transactions contrary to any recommendation herein, or have positions in the securities mentioned herein or options with respect thereto. Any recommendation contained in this report may not be suitable for all investors and it is not to be deemed an offer or solicitation on our part with respect to the purchase or sale of any securities. |
|
 |
Commodity-Linked Groups Led Widespread Gains
Kenneth J. Gruneisen - Passed the CAN SLIM® Master's Exam
The Retail Index ($RLX +1.85%) rallied and financial shares helped underpin the major averages' big gains on Wednesday. The Bank Index ($BKX +2.23%) and the Broker/Dealer Index ($XBD +2.91%) posted big gains. The tech sector saw unanimous gains from the Networking Index ($NWX +1.97%), Semiconductor Index ($SOX +2.16%) and the Biotechnology Index ($BTK +3.59%). There were large gains from energy-related shares as the Oil Services Index ($OSX +4.05%) and Integrated Oil Index ($XOI +4.82%) rebounded from multi-year lows. The Gold & Silver Index ($XAU +5.32%) also was a standout gainer.
Charts courtesy www.stockcharts.com
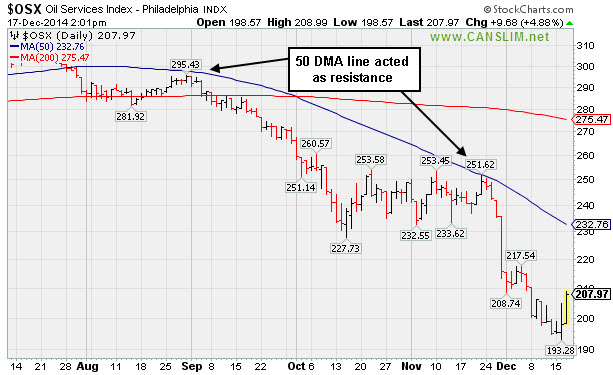
PICTURED: The Oil Services Index ($OSX +4.05%) is rebounding from multi-year lows. Its 50-day moving average (DMA) line acted as resistance when attempting to rally in prior months during its ongoing descent.
| Oil Services |
$OSX |
206.33 |
+8.04 |
+4.05% |
-26.58% |
| Integrated Oil |
$XOI |
1,302.92 |
+59.96 |
+4.82% |
-13.32% |
| Semiconductor |
$SOX |
675.58 |
+14.28 |
+2.16% |
+26.27% |
| Networking |
$NWX |
346.49 |
+6.71 |
+1.97% |
+6.96% |
| Broker/Dealer |
$XBD |
180.51 |
+5.10 |
+2.91% |
+12.42% |
| Retail |
$RLX |
991.71 |
+18.06 |
+1.85% |
+5.52% |
| Gold & Silver |
$XAU |
66.51 |
+3.36 |
+5.32% |
-20.96% |
| Bank |
$BKX |
72.08 |
+1.57 |
+2.23% |
+4.07% |
| Biotech |
$BTK |
3,398.66 |
+117.72 |
+3.59% |
+45.84% |
|
|
|
 |
Recent 50-Day Moving Average Violation Triggered Sell Signal
Kenneth J. Gruneisen - Passed the CAN SLIM® Master's Exam
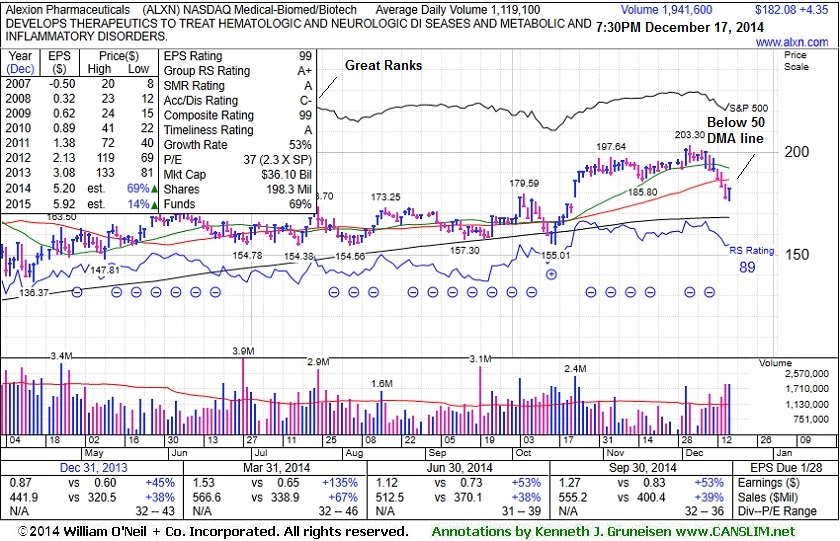
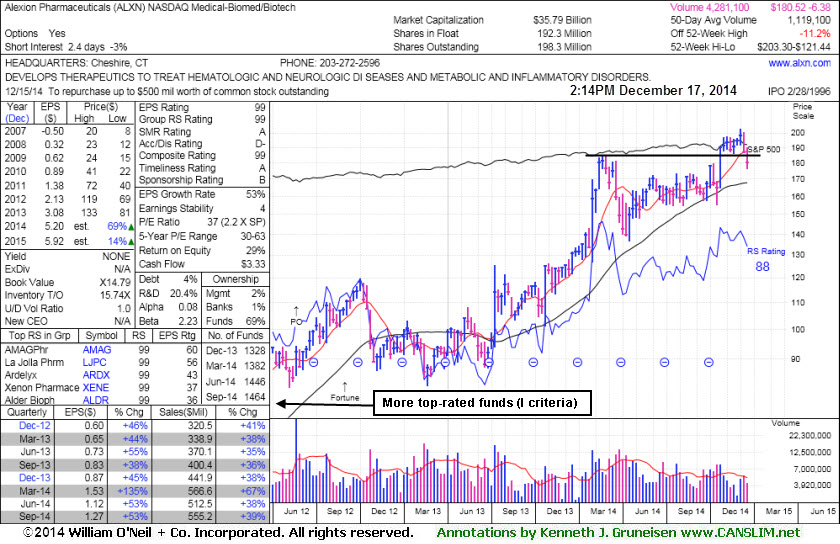
Alexion Pharmaceuticals Inc (ALXN +$4.35 or +2.45% to $182.08) rebounded from earlier lows following a damaging volume-driven loss. The recent violation of its 50-day moving average (DMA) line triggered a technical sell signal. Prior highs in the $180 area may serve as support, but a subsequent rebound above its 50 DMA line is needed to help its outlook improve. It was last shown in this FSU section on 11/28/14 with annotated graphs under the headline, "Quietly Consolidating Near All-Time High", hovering just above its "max buy" level. Disciplined investors avoid chasing stocks more than +5% above prior highs and always limit losses by selling any stock which falls more than -7% from its purchase price.
ALXN was highlighted in yellow with a pivot point based on its 2/25/14 high plus 10 cents in the 10/23/14 mid-day report (read here). The Medical - Biomed/Biotech industry group has demonstrated leadership and earned a 99 for its Group Relative Strength Rating, a reassuring sign concerning the L criteria. It reported earnings +53% on +39% sales revenues for the Sep '14 quarter, continuing its strong earnings history. Its Relative Strength Rank (88) remains high. It easily satisfies the C and A criteria with a very strong quarterly and annual earnings history which has earned it a highest possible 99 Earnings Per Share rank. The number of top-rated funds owning its shares rose from 1,325 in Dec '13 to 1,464 in Sep '14, a reassuring sign concerning the I criteria of the fact-based investment system. ALXN completed a new Public Offering on 5/25/12.
|
|
|
Color Codes Explained :
Y - Better candidates highlighted by our
staff of experts.
G - Previously featured
in past reports as yellow but may no longer be buyable under the
guidelines.
***Last / Change / Volume data in this table is the closing quote data***
Symbol/Exchange
Company Name
Industry Group |
PRICE |
CHANGE
(%Change) |
Day High |
Volume
(% DAV)
(% 50 day avg vol) |
52 Wk Hi
% From Hi |
Featured
Date |
Price
Featured |
Pivot Featured |
|
Max Buy |
ACT
-
NYSE
Actavis plc
Medical-Generic Drugs
|
$260.90
|
+4.38
1.71% |
$261.20
|
2,861,143
89.38% of 50 DAV
50 DAV is 3,201,000
|
$272.75
-4.34%
|
6/20/2014
|
$216.53
|
PP = $230.87
|
|
MB = $242.41
|
Most Recent Note - 12/16/2014 5:54:54 PM
G - Consolidating following recent volume-driven gains on news it plans to acquire Allergan (AGN) for $66 Billion. Extended from prior highs in the $249 area defining near-term support.
>>> FEATURED STOCK ARTICLE : Consolidating After Rally on Acquisition Plans - 12/12/2014
View all notes |
Set NEW NOTE alert |
CANSLIM.net Company Profile |
SEC
News |
Chart |
Request a new note
C
A N
S L
I M


|
AFSI
-
NASDAQ
Amtrust Financial Svcs
INSURANCE - Property and; Casualty Insurance
|
$57.74
|
+1.02
1.79% |
$57.95
|
548,880
51.15% of 50 DAV
50 DAV is 1,073,000
|
$59.31
-2.66%
|
10/17/2014
|
$45.24
|
PP = $46.02
|
|
MB = $48.32
|
Most Recent Note - 12/16/2014 2:41:06 PM
G - Hit a new 52-week high on the prior session. Recently rising from a brief consolidation, not a sound base. Its 50 DMA line defines important near-term support.
>>> FEATURED STOCK ARTICLE : Extended From Sound Base Pattern Identified Earlier - 12/10/2014
View all notes |
Set NEW NOTE alert |
CANSLIM.net Company Profile |
SEC
News |
Chart |
Request a new note
C
A N
S L
I M
|
ALXN
-
NASDAQ
Alexion Pharmaceuticals
DRUGS - Drug Manufacturers - Other
|
$182.08
|
+4.35
2.45% |
$182.82
|
1,953,673
174.59% of 50 DAV
50 DAV is 1,119,000
|
$203.30
-10.44%
|
10/23/2014
|
$184.01
|
PP = $185.53
|
|
MB = $194.81
|
 Most Recent Note - 12/17/2014 7:54:08 PM
G - Recent violation of its 50 DMA line triggered a technical sell signal. Only a rebound above its 50 DMA line would help its outlook improve. See the latest FSU analysis for more details with new annotated graphs.
>>> FEATURED STOCK ARTICLE : Recent 50-Day Moving Average Violation Triggered Sell Signal - 12/17/2014
View all notes |
Set NEW NOTE alert |
CANSLIM.net Company Profile |
SEC
News |
Chart |
Request a new note
C
A N
S L
I M
|
BIDU
-
NASDAQ
Baidu Inc Ads
INTERNET - Internet Information Providers
|
$223.85
|
+3.89
1.77% |
$225.42
|
3,007,933
81.65% of 50 DAV
50 DAV is 3,684,000
|
$251.99
-11.17%
|
10/30/2014
|
$234.08
|
PP = $231.51
|
|
MB = $243.09
|
Most Recent Note - 12/16/2014 2:44:34 PM
G - Still sputtering below its 50 DMA line. Previously noted - "Additional damaging losses would trigger more worrisome technical sell signals."
>>> FEATURED STOCK ARTICLE : Consolidating Near Prior Highs and Above 50-Day Average - 12/3/2014
View all notes |
Set NEW NOTE alert |
CANSLIM.net Company Profile |
SEC
News |
Chart |
Request a new note
C
A N
S L
I M
|
EPAM
-
NYSE
Epam Systems Inc
COMPUTER SOFTWARE and SERVICES - Information Technology Service
|
$48.37
|
+2.13
4.61% |
$48.50
|
508,703
117.21% of 50 DAV
50 DAV is 434,000
|
$52.89
-8.55%
|
10/23/2014
|
$45.21
|
PP = $46.09
|
|
MB = $48.39
|
Most Recent Note - 12/16/2014 5:50:40 PM
G - Violated its 50 DMA line with today's volume-driven loss triggering a technical sell signal. Testing prior highs in the $45-46 area defining the next important near-term support to watch. See the latest FSU analysis for more details and new annotated graphs.
>>> FEATURED STOCK ARTICLE : Violated 50-Day Moving Average Triggering Technical Sell Signal - 12/16/2014
View all notes |
Set NEW NOTE alert |
CANSLIM.net Company Profile |
SEC
News |
Chart |
Request a new note
C
A N
S L
I M
|
Symbol/Exchange
Company Name
Industry Group |
PRICE |
CHANGE
(%Change) |
Day High |
Volume
(% DAV)
(% 50 day avg vol) |
52 Wk Hi
% From Hi |
Featured
Date |
Price
Featured |
Pivot Featured |
|
Max Buy |
FB
-
NASDAQ
Facebook Inc Cl A
INTERNET
|
$76.11
|
+1.42
1.90% |
$76.41
|
29,193,198
83.71% of 50 DAV
50 DAV is 34,876,000
|
$81.16
-6.22%
|
9/9/2014
|
$76.67
|
PP = $76.84
|
|
MB = $80.68
|
Most Recent Note - 12/16/2014 2:56:03 PM
Y - Quietly consolidating near its 50 DMA line ($75.80). Recent lows in the $72 area define the next chart support level above its 200 DMA line.
>>> FEATURED STOCK ARTICLE : Gains Above 50-Day Moving Average Needed for Outlook to Improve - 12/4/2014
View all notes |
Set NEW NOTE alert |
CANSLIM.net Company Profile |
SEC
News |
Chart |
Request a new note
C
A N
S L
I M
|
ILMN
-
NASDAQ
Illumina Inc
DRUGS - Biotechnology
|
$181.21
|
+6.03
3.44% |
$181.37
|
1,271,965
102.58% of 50 DAV
50 DAV is 1,240,000
|
$197.37
-8.19%
|
10/22/2014
|
$188.77
|
PP = $182.27
|
|
MB = $191.38
|
Most Recent Note - 12/16/2014 6:03:24 PM
G - Fell again today on average volume after violating its 50 DMA line with a loss on higher volume on the prior session raising concerns and triggering a technical sell signal. Only a prompt rebound above the 50 DMA line would help its outlook improve. See the latest FSU analysis for more details and annotated graphs.
>>> FEATURED STOCK ARTICLE : Violation of 50-Day Average Triggered Technical Sell Signal - 12/15/2014
View all notes |
Set NEW NOTE alert |
CANSLIM.net Company Profile |
SEC
News |
Chart |
Request a new note
C
A N
S L
I M
|
PANW
-
NYSE
Palo Alto Networks
Computer Sftwr-Security
|
$120.03
|
+3.39
2.91% |
$120.27
|
995,577
54.64% of 50 DAV
50 DAV is 1,822,000
|
$123.22
-2.59%
|
7/30/2014
|
$84.21
|
PP = $85.88
|
|
MB = $90.17
|
Most Recent Note - 12/15/2014 1:45:02 PM
G - Quietly consolidating near all-time highs, it has not formed a sound base, and the 50 DMA line ($108.47) defines near-term support to watch. Reported earnings +88% on +50% sales revenues for the Oct '14 quarter.
>>> FEATURED STOCK ARTICLE : Under Accumulation But Extended From Sound Base - 12/1/2014
View all notes |
Set NEW NOTE alert |
CANSLIM.net Company Profile |
SEC
News |
Chart |
Request a new note
C
A N
S L
I M
|
RH
-
NYSE
Restoration Hardware Hld
RETAIL - Home Furnishing Stores
|
$96.57
|
+1.48
1.56% |
$97.00
|
1,250,425
132.04% of 50 DAV
50 DAV is 947,000
|
$99.44
-2.89%
|
12/11/2014
|
$98.66
|
PP = $94.60
|
|
MB = $99.33
|
Most Recent Note - 12/16/2014 6:01:42 PM
Y - Stubbornly holding its ground following a gap up gain when highlighted in the 12/11/14 mid-day report (read here). Subsequent losses leading to a close below its old high close ($93.05 on 6/30/14) would completely negate the recent breakout and raise concerns.
>>> FEATURED STOCK ARTICLE : Close in Lower Third of Intra-day Range Indicates Disributional Pressure - 12/11/2014
View all notes |
Set NEW NOTE alert |
CANSLIM.net Company Profile |
SEC
News |
Chart |
Request a new note
C
A N
S L
I M
|
UIHC
-
NASDAQ
United Insurance Holding
Insurance-Prop/Cas/Titl
|
$20.78
|
+0.50
2.47% |
$20.80
|
164,255
68.44% of 50 DAV
50 DAV is 240,000
|
$22.32
-6.90%
|
12/5/2014
|
$20.64
|
PP = $20.31
|
|
MB = $21.33
|
Most Recent Note - 12/16/2014 1:34:33 PM
Y - Color code is changed to yellow while consolidating above prior highs near $20 defining initial support to watch on pullbacks. Disciplined investors avoid chasing stocks more than +5% above prior highs and always limit losses by selling any stock that falls more than -7% from its purchase price. Keep in mind that deterioration in the broader market (M criteria) has raised a caution flag.
>>> FEATURED STOCK ARTICLE : Technical Breakout Indicative of Institutional Demand - 12/5/2014
View all notes |
Set NEW NOTE alert |
CANSLIM.net Company Profile |
SEC
News |
Chart |
Request a new note
C
A N
S L
I M
|
Symbol/Exchange
Company Name
Industry Group |
PRICE |
CHANGE
(%Change) |
Day High |
Volume
(% DAV)
(% 50 day avg vol) |
52 Wk Hi
% From Hi |
Featured
Date |
Price
Featured |
Pivot Featured |
|
Max Buy |
|
|
|
THESE ARE NOT BUY RECOMMENDATIONS!
Comments contained in the body of this report are technical
opinions only. The material herein has been obtained
from sources believed to be reliable and accurate, however,
its accuracy and completeness cannot be guaranteed.
This site is not an investment advisor, hence it does
not endorse or recommend any securities or other investments.
Any recommendation contained in this report may not
be suitable for all investors and it is not to be deemed
an offer or solicitation on our part with respect to
the purchase or sale of any securities. All trademarks,
service marks and trade names appearing in this report
are the property of their respective owners, and are
likewise used for identification purposes only.
This report is a service available
only to active Paid Premium Members.
You may opt-out of receiving report notifications
at any time. Questions or comments may be submitted
by writing to Premium Membership Services 665 S.E. 10 Street, Suite 201 Deerfield Beach, FL 33441-5634 or by calling 1-800-965-8307
or 954-785-1121.
|
|
|

