You are not logged in.
This means you
CAN ONLY VIEW reports that were published prior to Monday, April 14, 2025.
You
MUST UPGRADE YOUR MEMBERSHIP if you want to see any current reports.
AFTER MARKET UPDATE - MONDAY, DECEMBER 14TH, 2009
Previous After Market Report Next After Market Report >>>
|
|
|
|
DOW |
+29.55 |
10,501.05 |
+0.28% |
|
Volume |
1,073,070,280 |
+6% |
|
Volume |
1,880,561,210 |
+5% |
|
NASDAQ |
+21.79 |
2,212.10 |
+0.99% |
|
Advancers |
2,264 |
72% |
|
Advancers |
1,864 |
65% |
|
S&P 500 |
+7.70 |
1,114.11 |
+0.70% |
|
Decliners |
780 |
25% |
|
Decliners |
892 |
31% |
|
Russell 2000 |
+9.42 |
609.79 |
+1.57% |
|
52 Wk Highs |
297 |
|
|
52 Wk Highs |
111 |
|
|
S&P 600 |
+5.48 |
322.70 |
+1.73% |
|
52 Wk Lows |
3 |
|
|
52 Wk Lows |
10 |
|
|
 |
Major Indices Rise With Higher Volume And Positive Breadth
Adam Sarhan, Contributing Writer,
The major averages edged higher on Monday after Abu Dhabi announced it would bail out Dubai World and Exxon Mobil Corp (XOM -4.31%) announced plans to buy XTO Energy Inc. (XTO +15.35%) for $31 billion. Volume, an important indicator of institutional sponsorship, was reported higher than Friday's totals on the NYSE and on the Nasdaq exchange which was a healthy sign. Advancers led decliners by nearly a 3-to-1 ratio on the NYSE and by about a 2-to-1 ratio on the Nasdaq exchange. There were 51 high-ranked companies from the CANSLIM.net Leaders List that made a new 52-week high and appeared on the CANSLIM.net BreakOuts Page, higher than the total of 25 issues that appeared on the prior session. New 52-week highs substantially outnumbered new 52-week lows on the NYSE and on the Nasdaq exchange.
Overnight, Abu Dhabi reassured investors and said it will not let state-owned Dubai World go under. On November 25, 2009 Dubai World, parent of Nakheel, said that it would have trouble meeting its debt obligations. This sent world markets tumbling as investors were concerned that other entities may default which will add to the $1.7 trillion of credit losses and asset write-downs posted since the financial crisis began in 2007. Last week, several credit agencies downgraded and cited their dismay regarding much of the developed world's credit ratings. The rating agencies are concerned that lackluster economic growth coupled with massive deficit spending will lead to future defaults.
Exxon Mobil gapped down and closed below its 200-day moving average (DMA) line, falling on monstrous volume after the company announced plans to buy XTO Energy. Exxon's sales and earnings have steadily plunged over the past four quarters as oil prices continue trading significantly below their record highs of over $140 a barrel. The XTO buyout was a way for the company to grow even as oil prices continue trading nearly -50% below their record highs. Elsewhere, Citigroup Inc. (C -6.33%) gapped down after striking a deal with regulators to repay $20 billion in bailout funds.
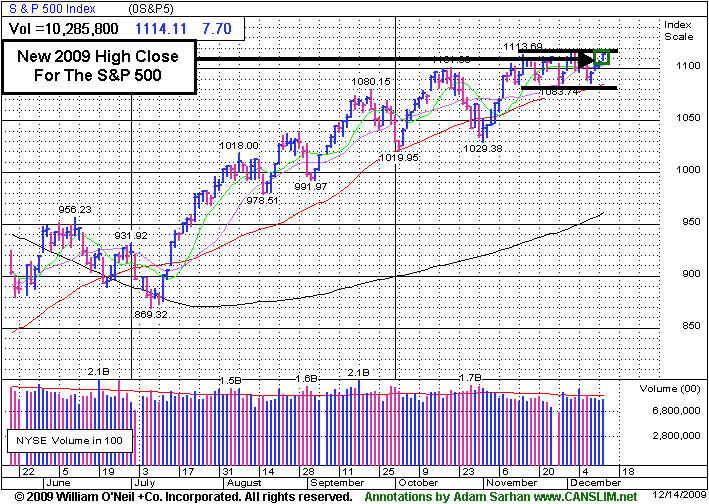
Looking at the recent action in the market, the Dow Jones Industrial Average and benchmark S&P 500 Index enjoyed their best close of the year as they continue flirting with important resistance levels (10,500 and 1,115 respectively.). The major averages continue acting well as they remain perched just below resistance (their respective 2009 highs) and above their respective 50-day moving average lines. Both these factors are considered healthy and bodes well for this 8-month (41-week) rally. It was also encouraging to see the Nasdaq Composite Index close above the 2,200 threshold which has served as resistance for the past few months. A slew of economic data is slated to be released this week and, as always, it will be very important to see how the market reacts to the news.
PICTURED: The benchmark S&P 500 Index closed at its highest level this year.
|
|
|
 |
Tech Sector And Defensive Groups Rise
Kenneth J. Gruneisen - Passed the CAN SLIM® Master's Exam
The tech sector's strength helped the small cap indexes and the tech-heavy Nasdaq Composite Index outpace the other indices on Monday. The Semiconductor Index ($SOX +1.50%), Biotechnology Index ($BTK +1.52%), and Internet Index ($IIX +0.73%) posted gains while only the Networking Index ($NWX -0.02%) failed to make headway. Defensive groups also rose as the Healthcare Index ($HMO +1.41%), Gold & Silver Index ($XAU +1.13%), and Oil Services Index ($OSX +1.49%), and Integrated Oil Index ($XOI +0.42%) rose. The Bank Index's ($BKX +0.48%) modest gain helped it out pace the Broker/Dealer Index ($XBD +0.08%), but both financial indexes remain below their 50-day moving average lines.
Charts courtesy www.stockcharts.com
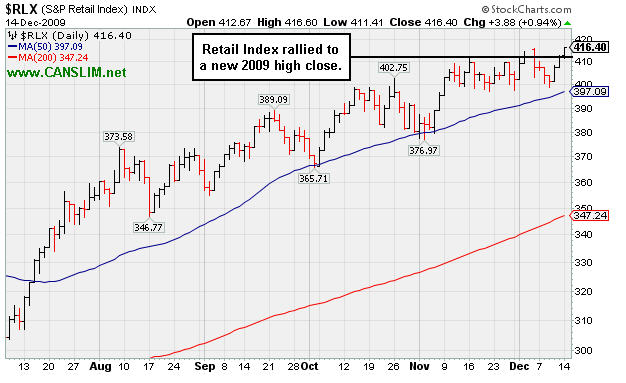
PICTURED: The Retail Index ($RLX +0.94%) rallied to a new 2009 high close.
| Oil Services |
$OSX |
188.33 |
+2.76 |
+1.49% |
+55.14% |
| Healthcare |
$HMO |
1,447.57 |
+20.08 |
+1.41% |
+50.76% |
| Integrated Oil |
$XOI |
1,052.89 |
+4.39 |
+0.42% |
+7.47% |
| Semiconductor |
$SOX |
340.28 |
+5.04 |
+1.50% |
+60.38% |
| Networking |
$NWX |
227.33 |
-0.04 |
-0.02% |
+57.99% |
| Internet |
$IIX |
229.06 |
+1.66 |
+0.73% |
+71.23% |
| Broker/Dealer |
$XBD |
112.59 |
+0.09 |
+0.08% |
+45.33% |
| Retail |
$RLX |
416.40 |
+3.88 |
+0.94% |
+49.11% |
| Gold & Silver |
$XAU |
174.38 |
+1.94 |
+1.13% |
+40.80% |
| Bank |
$BKX |
43.80 |
+0.21 |
+0.48% |
-1.17% |
| Biotech |
$BTK |
924.16 |
+13.86 |
+1.52% |
+42.80% |
|
|
|
 |
High-Ranked Leader Holding Ground Near Highs
Kenneth J. Gruneisen - Passed the CAN SLIM® Master's Exam
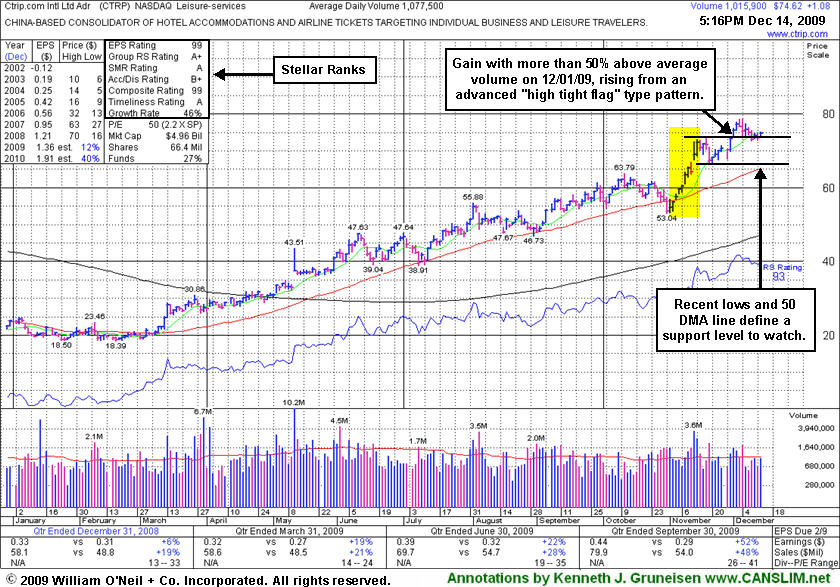
Ctrip.com International (CTRP +$1.08 or +1.47% to $74.62) posted a gain today on average volume. Near its pivot point now, it encountered some distributional pressure when recently rallying above its "max buy" price of $77.60. Featured on 12/01/09 in yellow in the mid-day report (read here). It triggered a technical buy signal as it rose with more than +50% above average volume from a brief consolidation resembling a "high-tight-flag" pattern which it formed after repairing a late-October breach of its 50 DMA line and sprinting considerably higher. Fundamentally, its sales revenues and earnings increases have shown acceleration in the 3 most recent quarterly comparisons and rose solidly above the +25% guideline in the latest period ended September 30, 2009.
A follow-up study on 12/29/08 included an annotated graph under the headline "Disciplined Investors Avoided This Trip To The House Of Pain." That was well after if was dropped from the Featured Stocks list on 6/10/09 based on weak technical action when it closed at $49.84. Technically, it has rebounded very impressively from subsequent lows in the $16 area. It has maintained a strong and steady annual; earnings (A criteria) history. Fundamentals have shown greater sales revenues and earnings increases in the most current quarterly comparisons (C criteria), which is a very encouraging sign. The number of top-rated funds owning its shares increased from 52 in Mar '09 to 114 in Dec '09, which helps satisfy the I criteria.
|
|
|
Color Codes Explained :
Y - Better candidates highlighted by our
staff of experts.
G - Previously featured
in past reports as yellow but may no longer be buyable under the
guidelines.
***Last / Change / Volume quote data in this table corresponds with the timestamp on the note***
Symbol/Exchange
Company Name
Industry Group |
Last |
Chg. |
Vol
% DAV |
Date Featured |
Price Featured |
Latest Pivot Point
Featured |
Status |
| Latest Max Buy Price |
ARST
-
|
$24.11
|
+0.53
|
288,909
52% DAV
556,200
|
9/1/2009
(Date
Featured) |
$19.91
(Price
Featured) |
PP = $20.90 |
G |
| MB = $21.95 |
Most Recent Note - 12/14/2009 4:51:19 PM
G - Third consecutive small gain today on light volume, rising toward its 50 DMA line. Deterioration below its recent chart lows ($22.15) would raise more serious concerns, while its outlook is increasingly questionable the longer it continues to struggle below its 50 DMA line. ARST was first featured in yellow at $19.91 in the 9/01/09 mid-day report with an annotated daily graph (read here).
>>> The latest Featured Stock Update with an annotated graph appeared on 12/3/2009. click here.
|
|
C
A
S
I |
News |
Chart |
SEC
View all notes Alert
me of new notes
Company
Profile
|
ASIA
-
|
$32.16
|
+1.10
|
1,352,512
102% DAV
1,328,700
|
10/14/2009
(Date
Featured) |
$23.05
(Price
Featured) |
PP = $22.19 |
G |
| MB = $23.30 |
Most Recent Note - 12/14/2009 4:52:15 PM
G - Small gap up gain on average volume today for a new high. Held its ground following a gap up for a considerable gain on 12/07/09 with almost 8 times average volume on news it will merge with Linkage Technologies International Holdings Limited, leading providers of software solutions and IT services for the telecommunications industry in China. Featured 10/14/09 in the mid-day report (read here) as it gapped up for a new 52-week high with 5 times average volume, triggering a technical buy signal by blasting above its pivot point. First featured in the August 2009 CANSLIM.net News (read here).
>>> The latest Featured Stock Update with an annotated graph appeared on 12/7/2009. click here.
|
|
C
A
S
I |
News |
Chart |
SEC
View all notes Alert
me of new notes
Company
Profile
|
BIDU
- NASDAQ
Baidu Inc Ads
INTERNET - Internet Information Providers
|
$424.51
|
+6.41
|
773,546
38% DAV
2,056,200
|
9/8/2009
(Date
Featured) |
$351.80
(Price
Featured) |
PP = $440.00 |
Y |
| MB = $462.00 |
Most Recent Note - 12/14/2009 4:52:58 PM
Y - Small gain on light volume today. Volume has been drying up while consolidating in a tight trading range near all-time highs and just above its 50 DMA line. Color code was changed to yellow with new pivot point cited. Technically, it has built a sloppy base over 7 weeks. Since quietly rallying to new highs in November it has stalled. BIDU traded up as much as +23% from its price when featured in yellow in the 9/08/09 Mid-Day BreakOuts Report (read here).
>>> The latest Featured Stock Update with an annotated graph appeared on 12/9/2009. click here.
|
|
C
A
S
I |
News |
Chart |
SEC
View all notes Alert
me of new notes
Company
Profile
|
CAAS
- NASDAQ
China Automotive Systems
AUTOMOTIVE - Auto Parts
|
$20.91
|
+0.45
|
506,742
88% DAV
577,800
|
11/30/2009
(Date
Featured) |
$18.84
(Price
Featured) |
PP = $17.62 |
G |
| MB = $18.50 |
Most Recent Note - 12/14/2009 4:55:05 PM
G - Gain today for its 3rd highest close ever. Volume has been drying up while it has been hovering near all-time highs, yet it is still extended from a sound base under the investment system rules. The Chinese maker of power steering systems was rising from an advanced "3-weeks tight" type of chart pattern as it showed up in yellow in the 11/30/09 mid-day report (read here). Recent quarters show accelerating sales revenues and earnings increases, and it has a good annual earnings history.
>>> The latest Featured Stock Update with an annotated graph appeared on 12/11/2009. click here.
|
|
C
A
S
I |
News |
Chart |
SEC
View all notes Alert
me of new notes
Company
Profile
|
CACC
- NASDAQ
Credit Acceptance Corp
FINANCIAL SERVICES - Credit Services
|
$35.23
|
+0.23
|
67,543
208% DAV
32,500
|
9/29/2009
(Date
Featured) |
$33.48
(Price
Featured) |
PP = $37.10 |
Y |
| MB = $38.96 |
Most Recent Note - 12/14/2009 4:59:47 PM
Y - Gain today with 2 times average volume for its best close since October. Near its 50 DMA line, and showing resilience near that important short-term average line after recently encountering distributional pressure. After an 8-week flat base it is continuing its consolidation above prior chart highs in the $32 area. The Finance - Consumer/Commercial Loans firm has maintained a great track record of annual and quarterly sales revenues and earnings increases. It was featured on 9/29/09 in yellow in the mid-day report (read here).
>>> The latest Featured Stock Update with an annotated graph appeared on 12/10/2009. click here.
|
|
C
A
S
I |
News |
Chart |
SEC
View all notes Alert
me of new notes
Company
Profile
|
CRM
- NYSE
Salesforce.com Inc
INTERNET - Internet Software & Services
|
$64.92
|
+1.66
|
1,348,646
83% DAV
1,618,900
|
8/16/2009
(Date
Featured) |
$47.12
(Price
Featured) |
PP = $45.59 |
G |
| MB = $47.87 |
Most Recent Note - 12/14/2009 5:01:34 PM
G - Gain today on below average volume. Last week it tested support at its 50 DMA line. It has been consolidating for the past 4 weeks above important support at that short-term average line, yet hovering within close striking distance of its 52 week high.
>>> The latest Featured Stock Update with an annotated graph appeared on 12/8/2009. click here.
|
|
C
A
S
I |
News |
Chart |
SEC
View all notes Alert
me of new notes
Company
Profile
|
CTRP
- NASDAQ
Ctrip.com Intl Ltd Adr
LEISURE - Resorts & Casinos
|
$74.62
|
+1.08
|
1,016,337
94% DAV
1,077,500
|
12/1/2009
(Date
Featured) |
$75.38
(Price
Featured) |
PP = $73.91 |
Y |
| MB = $77.61 |
Most Recent Note - 12/14/2009 5:03:54 PM
Y - Gain on average volume today. Near its pivot point now, it encountered some distributional pressure when recently rallying above its "max buy" price of $77.60. Featured on 12/01/09 in yellow in the mid-day report (read here). It triggered a technical buy signal as it rose with more than +50% above average volume from a brief consolidation resembling a "high-tight-flag" pattern which it formed after repairing a late-October breach of its 50 DMA line. Fundamentally, its sales revenues and earnings increases have shown acceleration in the 3 most recent quarterly comparisons and rose above the +25% guideline. Based on weak technical action it was dropped from the Featured Stocks list on 6/10/08, when it closed at $49.84, yet it has rebounded very impressively from subsequent lows in the $16 area.
>>> The latest Featured Stock Update with an annotated graph appeared on 12/14/2009. click here.
|
|
C
A
S
I |
News |
Chart |
SEC
View all notes Alert
me of new notes
Company
Profile
|
HEAT
-
|
$16.52
|
+1.23
|
2,701,959
329% DAV
821,200
|
11/17/2009
(Date
Featured) |
$12.00
(Price
Featured) |
PP = $12.61 |
G |
| MB = $13.24 |
Most Recent Note - 12/14/2009 5:05:24 PM
G - Gapped up today for a considerable gain on heavy volume more than 3 times average as it hit a new 52-week high. Extended from its prior base after 3 weekly gains on above average volume in the past 4 weeks. The investment system rules say a stock should be held a minimum of 8 weeks after rising more than +20% in the first 2-3 weeks from being bought. First featured in yellow in the 11/17/09 mid-day report (read here) when technically rising from a "double bottom" base, reaching a new all-time high.
>>> The latest Featured Stock Update with an annotated graph appeared on 12/2/2009. click here.
|
|
C
A
S
I |
News |
Chart |
SEC
View all notes Alert
me of new notes
Company
Profile
|
LFT
-
|
$36.04
|
+0.09
|
161,542
36% DAV
445,400
|
11/17/2009
(Date
Featured) |
$31.77
(Price
Featured) |
PP = $33.04 |
G |
| MB = $34.69 |
Most Recent Note - 12/14/2009 5:07:01 PM
G - Small gain today on very light volume leaves it perched near all-time highs, extended after recently rising from a choppy 14-week base. Prior chart highs in the $31 area are an initial support level to watch. A proposed offering of additional shares on 11/16/09 seems well received by the market. Its fundamentals remain strong.
>>> The latest Featured Stock Update with an annotated graph appeared on 12/4/2009. click here.
|
|
C
A
S
I |
News |
Chart |
SEC
View all notes Alert
me of new notes
Company
Profile
|
|
|
|
THESE ARE NOT BUY RECOMMENDATIONS!
Comments contained in the body of this report are technical
opinions only. The material herein has been obtained
from sources believed to be reliable and accurate, however,
its accuracy and completeness cannot be guaranteed.
This site is not an investment advisor, hence it does
not endorse or recommend any securities or other investments.
Any recommendation contained in this report may not
be suitable for all investors and it is not to be deemed
an offer or solicitation on our part with respect to
the purchase or sale of any securities. All trademarks,
service marks and trade names appearing in this report
are the property of their respective owners, and are
likewise used for identification purposes only.
This report is a service available
only to active Paid Premium Members.
You may opt-out of receiving report notifications
at any time. Questions or comments may be submitted
by writing to Premium Membership Services 665 S.E. 10 Street, Suite 201 Deerfield Beach, FL 33441-5634 or by calling 1-800-965-8307
or 954-785-1121.
|
|
|


