You are not logged in.
This means you
CAN ONLY VIEW reports that were published prior to Tuesday, April 15, 2025.
You
MUST UPGRADE YOUR MEMBERSHIP if you want to see any current reports.
AFTER MARKET UPDATE - FRIDAY, DECEMBER 11TH, 2009
Previous After Market Report Next After Market Report >>>
|
|
|
|
DOW |
+65.67 |
10,471.50 |
+0.63% |
|
Volume |
1,015,391,170 |
-4% |
|
Volume |
1,792,859,200 |
-10% |
|
NASDAQ |
-0.55 |
2,190.31 |
-0.03% |
|
Advancers |
2,014 |
64% |
|
Advancers |
1,590 |
56% |
|
S&P 500 |
+4.06 |
1,106.41 |
+0.37% |
|
Decliners |
1,030 |
33% |
|
Decliners |
1,108 |
39% |
|
Russell 2000 |
+4.99 |
600.37 |
+0.84% |
|
52 Wk Highs |
219 |
|
|
52 Wk Highs |
56 |
|
|
S&P 600 |
+2.99 |
317.22 |
+0.95% |
|
52 Wk Lows |
6 |
|
|
52 Wk Lows |
15 |
|
|
 |
Mixed Session Brings Week To A Quiet Close
Adam Sarhan, Contributing Writer,
On Friday the major averages ended mixed as investors digested a slew of economic data from the past week. Volume, an important indicator of institutional sponsorship, was reported lighter than Thursday's totals on the NYSE and on the Nasdaq exchange. Advancers led decliners by about a 2-to-1 ratio on the NYSE and by about a 3-to-2 ratio on the Nasdaq exchange. There were 25 high-ranked companies from the CANSLIM.net Leaders List that made a new 52-week high and appeared on the CANSLIM.net BreakOuts Page, one better than the total of 24 issues that appeared on the prior session. New 52-week highs substantially outnumbered new 52-week lows on the NYSE, yet the leadership was less substantial on the Nasdaq exchange.
Stocks ended mixed on Monday as the dollar edged higher and commodities pulled back. This theme prevailed for most of the week and began on Friday December 4, 2009 when the Labor Department smashed estimates and said November's nonfarm payrolls slid by only -11,000 as the unemployment rate eased to 10%, down from a 26-year high of 10.2%. Gold and crude oil got smacked this week both pulling back sharply. After rallying for several weeks, on Thursday December 3, 2009 gold negatively reversed after hitting a new all time high of $1,226.40 and hasn't looked back since. Crude oil slid as below $70 a barrel in New York as demand waned and the supply rose.
Federal Reserve Chairman Ben Bernanke gave a speech at the Economic Club of Washington D.C. and said it was too early to determine the sustainability of this recovery. Bernanke also said that he sees modest economic growth in 2010 and does not believe inflation is a threat at this point. He also said that tight credit markets and a 10% unemployment rate could hinder future economic growth.
Stocks slid on Tuesday after a series of negative headlines hit the wires: tepid economic data was released from Germany, several credit-rating companies highlighted the risk of huge government deficits in the developed world, Greece's credit rating was downgraded, and Dubai World's Nakheel PJSC said it lost $3.65 billion. Stocks advanced on Wednesday thank in part to a late day decline in the US dollar. Japan's government said that the world's second largest economy grew at a +1.3% annualized rate last quarter which was way below the +4.8% reported last month. The sharp downward revision caught nearly everyone off guard and sparked concern that a double dip recession is likely. In Europe, Standard & Poor's lowered Spain's credit outlook to "negative" and said they were concerned with the country's slow economy and massive deficit spending.
Stocks edged higher on Thursday after positive trade data offset concerns about an increase in weekly unemployment claims. Before Thursday's opening bell, the Labor Department said jobless claims topped expectations and rose last week to 474,000 after falling for five straight weeks. However, the bulls found comfort in the fact that the four-week average, which smooths out the data and is less volatile, slid to its lowest level since September 2008. Elsewhere, the Commerce Department said the trade deficit narrowed to $32.9 billion in October. The report showed that exports surged in October thanks in part to a weaker dollar. Furthermore, this was the sixth consecutive month that exports rose which bodes well for the US economy. On Friday, investors cheered after two better-than-expected reports were released: retail sales and consumer confidence. However, stocks came under a little pressure in the afternoon when the House of Representatives passed legislation to create a Consumer Financial Protection agency which will monitor risk at large financial firms.
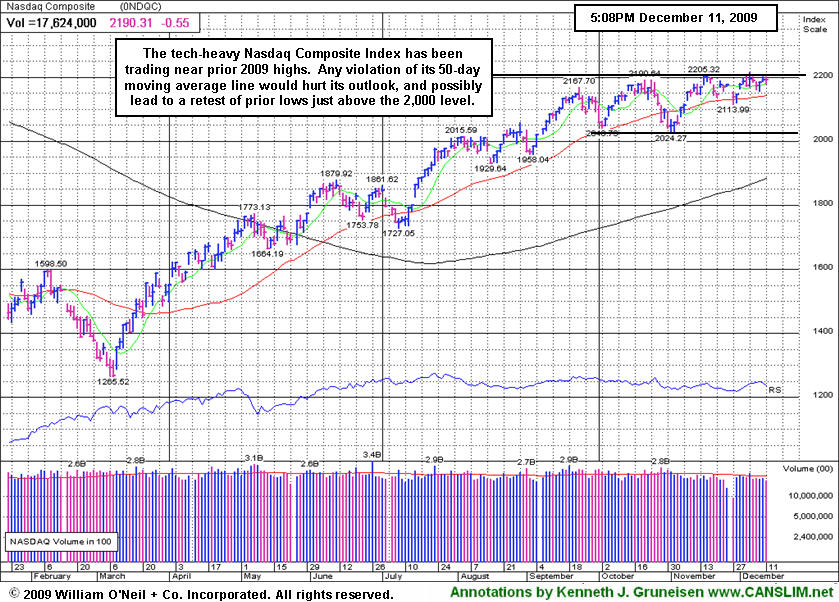
Important Support & Resistance Levels: Looking at the recent action in the market, the major averages continue acting well as they remain perched just below resistance (their respective 2009 highs) and above their respective 50-day moving average (DMA) lines. Both these factors are considered healthy and bodes well for this 8-month rally. The Nasdaq continues to experience formidable resistance just above 2,200 while the benchmark S&P 500 Index faces resistance just above 1,115. The blue chip Dow Jones Industrial Average remains the strongest of it peers and currently faces resistance just above 10,500. Until the major averages close above or below support or resistance, expect the bracketed (sideways) action to continue.
PICTURED: The tech-heavy Nasdaq Composite Index has been encountering resistance near prior chart highs. Any violation of its 50-day moving average line would hurt its outlook and possibly lead to a retest of prior chart lows just above the 2,000 level.
|
|
|
 |
Retail and Financial Group Gains Offset By Weakness
Kenneth J. Gruneisen - Passed the CAN SLIM® Master's Exam
Gains from influential groups helped the major averages on Friday as the Retail Index ($RLX +1.29%) posted a gain and the Bank Index ($BKX +1.02%) and Broker/Dealer Index ($XBD +0.31%) rose. However, weakness in most other groups largely offset the impact of their positive bias. The Gold & Silver Index ($XAU -2.10%) was among the worst laggards as the defensive group continued consolidating after its prior winning streak. The Biotechnology Index ($BTK +0.20%) posted a modest gain, but weakness in the Semiconductor Index ($SOX -1.00%), Internet Index ($IIX -0.49%), and Networking Index ($NWX -0.35%) pressured the tech sector lower and dragged the tech-heavy Nasdaq Composite Index into the red. The energy group had a quiet day as the Integrated Oil Index ($XOI -0.07%) and Oil Services Index ($OSX -0.02%) finished virtually unchanged.
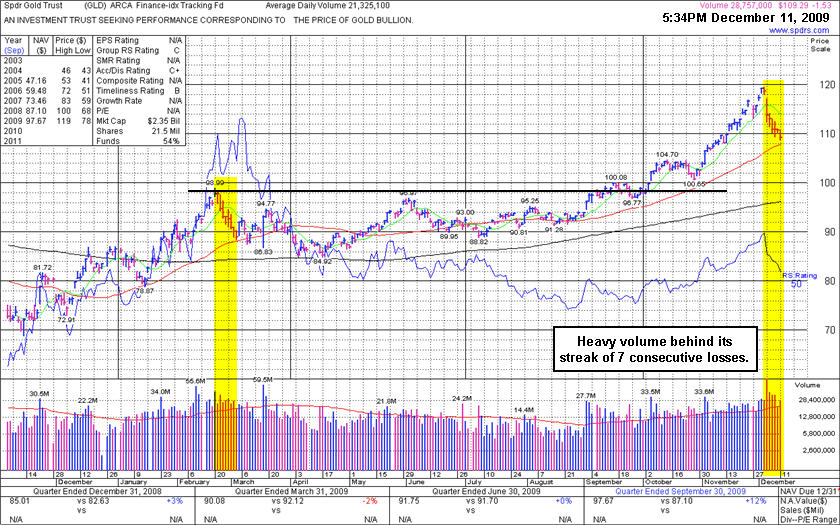
PICTURED: The ticker symbol GLD stands for a tracking fund from S&P that closely tracks the price of gold bullion. Following a prior run up, a wave of distribution was followed by nearly 8 months of base building before the next leg up began. Massive volume indicates heavy distributional pressure during the present 7-session losing streak, which is a sign that smart money is locking in gains after another great run up.
| Oil Services |
$OSX |
185.57 |
-0.03 |
-0.02% |
+52.87% |
| Healthcare |
$HMO |
1,427.49 |
-11.58 |
-0.80% |
+48.67% |
| Integrated Oil |
$XOI |
1,048.50 |
-0.78 |
-0.07% |
+7.02% |
| Semiconductor |
$SOX |
335.24 |
-3.37 |
-1.00% |
+58.01% |
| Networking |
$NWX |
227.37 |
-0.81 |
-0.35% |
+58.02% |
| Internet |
$IIX |
227.40 |
-1.12 |
-0.49% |
+69.99% |
| Broker/Dealer |
$XBD |
112.50 |
+0.35 |
+0.31% |
+45.22% |
| Retail |
$RLX |
412.52 |
+5.25 |
+1.29% |
+47.72% |
| Gold & Silver |
$XAU |
172.44 |
-3.70 |
-2.10% |
+39.23% |
| Bank |
$BKX |
43.59 |
+0.44 |
+1.02% |
-1.65% |
| Biotech |
$BTK |
910.30 |
+1.86 |
+0.20% |
+40.66% |
|
|
|
 |
Volume Drying Up While Hovering Near All-Time Highs
Kenneth J. Gruneisen - Passed the CAN SLIM® Master's Exam
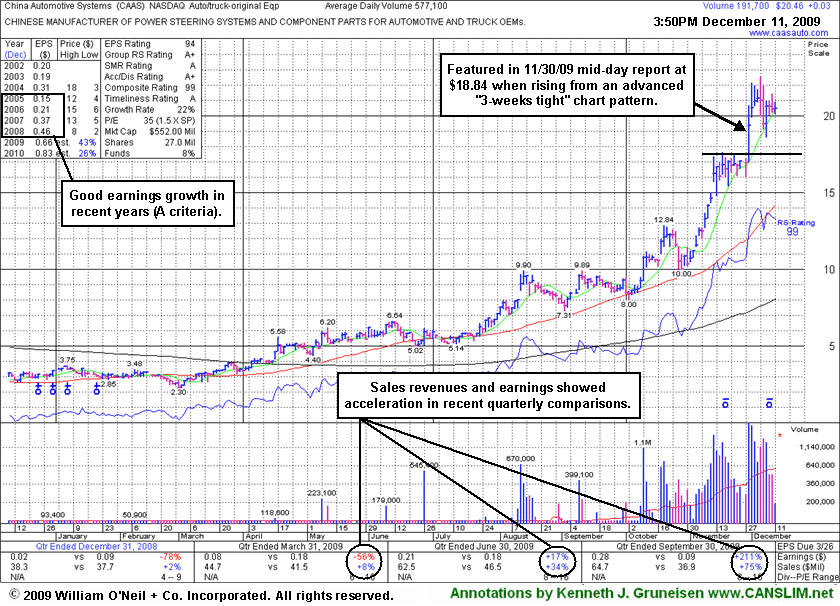
China Automotive Systems (CAAS +$0.03 or +0.15% to $20.46) finished the session with a small gain on light volume. Volume totals have dried up in recent days while it has been consolidating near all-time highs. The Chinese maker of power steering systems was rising from an advanced "3-weeks tight" type of chart pattern as it showed up in yellow in the 11/30/09 mid-day report (read here) while it also cleared its 2004 all-time high and quickly traded more than +5% above its prior highs. It is now more than +16% above its pivot point, so it may be risky and unwise to be undisciplined about buying and chase it, yet the high-ranked leader may go on to produce more climactic gains. Caution and discipline are especially critical for investors since this stock is already up more than 8-fold from its March lows.
The daily chart below shows recent quarters with sales revenues accelerating greatly and earnings increases getting bigger, and it has a good annual earnings history (A criteria). Increasing ownership from a handful top-rated funds is encouraging news concerning the I criteria of the investment system, as the number of top-rated funds rose from 4 in Dec '09 to 10 in Sept '09. Meanwhile, the small supply of shares (S criteria) in its publicly traded float could contribute to great volatility in the event of more abrupt maneuvering by large and highly influential fund managers.
|
|
|
Color Codes Explained :
Y - Better candidates highlighted by our
staff of experts.
G - Previously featured
in past reports as yellow but may no longer be buyable under the
guidelines.
***Last / Change / Volume quote data in this table corresponds with the timestamp on the note***
Symbol/Exchange
Company Name
Industry Group |
Last |
Chg. |
Vol
% DAV |
Date Featured |
Price Featured |
Latest Pivot Point
Featured |
Status |
| Latest Max Buy Price |
ARST
-
|
$23.58
|
+0.45
|
399,359
71% DAV
563,100
|
9/1/2009
(Date
Featured) |
$19.91
(Price
Featured) |
PP = $20.90 |
G |
| MB = $21.95 |
Most Recent Note - 12/11/2009 4:51:09 PM
G - Second consecutive small gain today on light volume. Deterioration below its recent chart lows ($22.15) would raise more serious concerns, while its outlook is increasingly questionable the longer it continues to struggle below its 50 DMA line. ARST was first featured in yellow at $19.91 in the 9/01/09 mid-day report with an annotated daily graph (read here).
>>> The latest Featured Stock Update with an annotated graph appeared on 12/3/2009. click here.
|
|
C
A
S
I |
News |
Chart |
SEC
View all notes Alert
me of new notes
Company
Profile
|
ASIA
-
|
$31.06
|
+0.51
|
930,880
70% DAV
1,327,500
|
10/14/2009
(Date
Featured) |
$23.05
(Price
Featured) |
PP = $22.19 |
G |
| MB = $23.30 |
Most Recent Note - 12/11/2009 4:52:27 PM
G - Small gain on light volume today for a new high close. Held its ground following a gap up for a considerable gain on 12/07/09 with almost 8 times average volume on news it will merge with Linkage Technologies International Holdings Limited, leading providers of software solutions and IT services for the telecommunications industry in China. Featured 10/14/09 in the mid-day report (read here) as it gapped up for a new 52-week high with 5 times average volume, triggering a technical buy signal by blasting above its pivot point. First featured in the August 2009 CANSLIM.net News (read here).
>>> The latest Featured Stock Update with an annotated graph appeared on 12/7/2009. click here.
|
|
C
A
S
I |
News |
Chart |
SEC
View all notes Alert
me of new notes
Company
Profile
|
BIDU
- NASDAQ
Baidu Inc Ads
INTERNET - Internet Information Providers
|
$418.10
|
-4.22
|
694,927
33% DAV
2,094,800
|
9/8/2009
(Date
Featured) |
$351.80
(Price
Featured) |
PP = $440.00 |
Y |
| MB = $462.00 |
Most Recent Note - 12/11/2009 4:54:44 PM
Y - Small loss on light volume today. Volume has been drying up while consolidating in a tight trading range near all-time highs and just above its 50 DMA line. Color code was changed to yellow with new pivot point cited. Technically, it has built a sloppy base over 7 weeks. Since quietly rallying to new highs in November it has stalled. BIDU traded up as much as +23% from its price when featured in yellow in the 9/08/09 Mid-Day BreakOuts Report (read here).
>>> The latest Featured Stock Update with an annotated graph appeared on 12/9/2009. click here.
|
|
C
A
S
I |
News |
Chart |
SEC
View all notes Alert
me of new notes
Company
Profile
|
CAAS
- NASDAQ
China Automotive Systems
AUTOMOTIVE - Auto Parts
|
$20.46
|
+0.03
|
231,124
40% DAV
577,100
|
11/30/2009
(Date
Featured) |
$18.84
(Price
Featured) |
PP = $17.62 |
G |
| MB = $18.50 |
Most Recent Note - 12/11/2009 4:56:22 PM
G - Volume has been drying up while it has been hovering near all-time highs, yet it is still extended from a sound base under the investment system rules. The Chinese maker of power steering systems was rising from an advanced "3-weeks tight" type of chart pattern as it showed up in yellow in the 11/30/09 mid-day report (read here). Recent quarters show accelerating sales revenues and earnings increases, and it has a good annual earnings history.
>>> The latest Featured Stock Update with an annotated graph appeared on 12/11/2009. click here.
|
|
C
A
S
I |
News |
Chart |
SEC
View all notes Alert
me of new notes
Company
Profile
|
CACC
- NASDAQ
Credit Acceptance Corp
FINANCIAL SERVICES - Credit Services
|
$35.00
|
+0.74
|
41,494
126% DAV
32,900
|
9/29/2009
(Date
Featured) |
$33.48
(Price
Featured) |
PP = $37.10 |
Y |
| MB = $38.96 |
Most Recent Note - 12/11/2009 4:58:02 PM
Y - Posted a gain today and closed just above its 50 DMA line. It has been showing some resilience near that important short-term average line after recently encountering distributional pressure. After an 8-week flat base it is continuing its consolidation above prior chart highs in the $32 area. The Finance - Consumer/Commercial Loans firm has maintained a great track record of annual and quarterly sales revenues and earnings increases. It was featured on 9/29/09 in yellow in the mid-day report (read here).
>>> The latest Featured Stock Update with an annotated graph appeared on 12/10/2009. click here.
|
|
C
A
S
I |
News |
Chart |
SEC
View all notes Alert
me of new notes
Company
Profile
|
CRM
- NYSE
Salesforce.com Inc
INTERNET - Internet Software & Services
|
$63.26
|
-1.43
|
1,744,772
108% DAV
1,615,000
|
8/16/2009
(Date
Featured) |
$47.12
(Price
Featured) |
PP = $45.59 |
G |
| MB = $47.87 |
Most Recent Note - 12/11/2009 4:59:32 PM
G - Loss today on average volume tested support at its 50 DMA line. It has been consolidating for the past 4 weeks above important support at that short-term average line, yet hovering within close striking distance of its 52 week high.
>>> The latest Featured Stock Update with an annotated graph appeared on 12/8/2009. click here.
|
|
C
A
S
I |
News |
Chart |
SEC
View all notes Alert
me of new notes
Company
Profile
|
CTRP
- NASDAQ
Ctrip.com Intl Ltd Adr
LEISURE - Resorts & Casinos
|
$73.54
|
-0.60
|
664,861
62% DAV
1,080,600
|
12/1/2009
(Date
Featured) |
$75.38
(Price
Featured) |
PP = $73.91 |
Y |
| MB = $77.61 |
Most Recent Note - 12/11/2009 5:00:27 PM
Y - Small loss today on lighter than average volume, closing back below its pivot point. Encountered some distributional pressure last week when briefly trading above its "max buy" price of $77.60. Featured on 12/01/09 in yellow in the mid-day report (read here). It triggered a technical buy signal as it rose with more than +50% above average volume from a brief consolidation resembling a "high-tight-flag" pattern which it formed after repairing a late-October breach of its 50 DMA line. Fundamentally, its sales revenues and earnings increases have shown acceleration in the 3 most recent quarterly comparisons and rose above the +25% guideline. Based on weak technical action it was dropped from the Featured Stocks list on 6/10/08, when it closed at $49.84, yet it has rebounded very impressively from subsequent lows in the $16 area.
>>> The latest Featured Stock Update with an annotated graph appeared on 12/1/2009. click here.
|
|
C
A
S
I |
News |
Chart |
SEC
View all notes Alert
me of new notes
Company
Profile
|
HEAT
-
|
$15.29
|
+0.41
|
1,084,248
132% DAV
819,700
|
11/17/2009
(Date
Featured) |
$12.00
(Price
Featured) |
PP = $12.61 |
G |
| MB = $13.24 |
Most Recent Note - 12/11/2009 5:04:09 PM
G - Gain with above average volume for the week was its 3rd weekly gain on above average volume in 4 weeks. The investment system rules say a stock should be held a minimum of 8 weeks after rising more than +20% in the first 2-3 weeks from being bought. HEAT found support near its pivot point during its recent consolidation, giving investors an opportunity to accumulate shares without chasing it and buying it "extended" from its latest base. First featured in yellow in the 11/17/09 mid-day report (read here) when technically rising from a "double bottom" base, reaching a new all-time high.
>>> The latest Featured Stock Update with an annotated graph appeared on 12/2/2009. click here.
|
|
C
A
S
I |
News |
Chart |
SEC
View all notes Alert
me of new notes
Company
Profile
|
LFT
-
|
$35.95
|
+0.33
|
278,402
62% DAV
449,500
|
11/17/2009
(Date
Featured) |
$31.77
(Price
Featured) |
PP = $33.04 |
G |
| MB = $34.69 |
Most Recent Note - 12/11/2009 5:06:14 PM
G - Small gain today on light volume halted a 4 session slide. It is still quietly perched near all-time highs. It remains a bit extended after recently rising from a choppy 14-week base. Prior chart highs in the $31 area are an initial support level to watch. A proposed offering of additional shares on 11/16/09 seems well received by the market. Its fundamentals remain strong.
>>> The latest Featured Stock Update with an annotated graph appeared on 12/4/2009. click here.
|
|
C
A
S
I |
News |
Chart |
SEC
View all notes Alert
me of new notes
Company
Profile
|
|
|
|
THESE ARE NOT BUY RECOMMENDATIONS!
Comments contained in the body of this report are technical
opinions only. The material herein has been obtained
from sources believed to be reliable and accurate, however,
its accuracy and completeness cannot be guaranteed.
This site is not an investment advisor, hence it does
not endorse or recommend any securities or other investments.
Any recommendation contained in this report may not
be suitable for all investors and it is not to be deemed
an offer or solicitation on our part with respect to
the purchase or sale of any securities. All trademarks,
service marks and trade names appearing in this report
are the property of their respective owners, and are
likewise used for identification purposes only.
This report is a service available
only to active Paid Premium Members.
You may opt-out of receiving report notifications
at any time. Questions or comments may be submitted
by writing to Premium Membership Services 665 S.E. 10 Street, Suite 201 Deerfield Beach, FL 33441-5634 or by calling 1-800-965-8307
or 954-785-1121.
|
|
|


