You are not logged in.
This means you
CAN ONLY VIEW reports that were published prior to Monday, April 14, 2025.
You
MUST UPGRADE YOUR MEMBERSHIP if you want to see any current reports.
AFTER MARKET UPDATE - THURSDAY, DECEMBER 10TH, 2009
Previous After Market Report Next After Market Report >>>
|
|
|
|
DOW |
+68.78 |
10,405.83 |
+0.67% |
|
Volume |
1,062,322,400 |
-2% |
|
Volume |
1,999,342,200 |
+3% |
|
NASDAQ |
+7.13 |
2,190.86 |
+0.33% |
|
Advancers |
1,830 |
58% |
|
Advancers |
1,056 |
37% |
|
S&P 500 |
+6.40 |
1,102.35 |
+0.58% |
|
Decliners |
1,201 |
38% |
|
Decliners |
1,655 |
58% |
|
Russell 2000 |
-2.65 |
595.38 |
-0.44% |
|
52 Wk Highs |
207 |
|
|
52 Wk Highs |
88 |
|
|
S&P 600 |
-1.41 |
314.23 |
-0.45% |
|
52 Wk Lows |
5 |
|
|
52 Wk Lows |
17 |
|
|
 |
Major Indices Post Gains While Small Caps Lag
Adam Sarhan, Contributing Writer,
Stocks rallied on Thursday after trade data helped offset concerns about an increase in weekly unemployment claims. Volume, an important indicator of institutional sponsorship, was slightly lower than Wednesday's total on the NYSE while volume was reported higher on the Nasdaq exchange. Advancers led decliners by about a 3-to-2 ratio on the NYSE, but the breadth was negative by a similar margin on the Nasdaq exchange. There were 24 high-ranked companies from the CANSLIM.net Leaders List that made a new 52-week high and appeared on the CANSLIM.net BreakOuts Page, greater than the total of 13 issues that appeared on the prior session. New 52-week highs outnumbered new 52-week lows on the NYSE and on the Nasdaq exchange.
Before Thursday's opening bell, the Labor Department said jobless claims topped expectations and rose last week to 474,000 after falling for five straight weeks. However, the bulls found comfort in the fact that the four-week average, which smooths out the data and is less volatile, slid to its lowest level since September 2008. Elsewhere, the Commerce Department said the trade deficit narrowed to $32.9 billion in October. The report showed that exports surged in October thanks in part to a weaker dollar. Furthermore, this was the sixth consecutive month that exports rose which bodes well for the US economy. Treasury Secretary Timothy Geithner testified before the Congressional Oversight Panel on Thursday. Geithner wants the government to extend the $700 billion TARP plan as the financial system recovers from last year's crisis. He said that extending the TARP plan will help US banks remain properly capitalized which will help them address potential threats that may arise in the future. He also said that doing this will reduce the need for future intervention if another financial shock occurs.
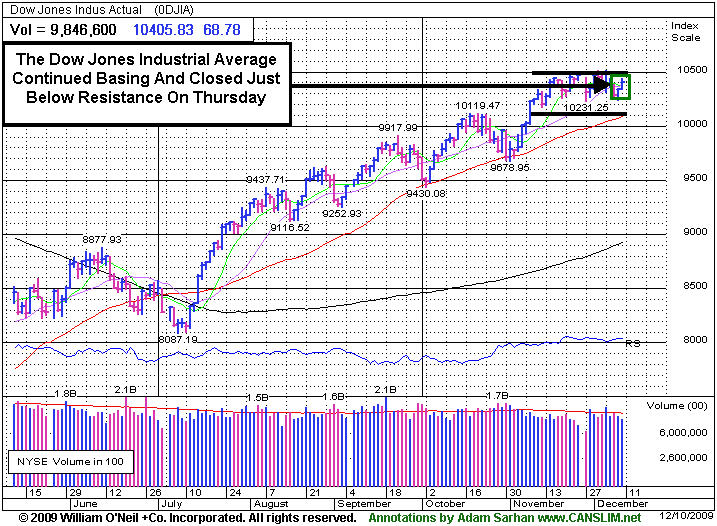
Around 2:30PM EST, the bears showed up and put pressure on the major averages. The small cap Russell 2000 index turned lower and slid into negative territory after being up for most of the day. The small cap index closed just above its 50-day moving average as it continues working on the right side of its current base. It is important to note that since the March low, small caps have outperformed their larger cap brethren. However, since the end of Q3, that relationship reversed and large caps are currently outperforming their peers.
PICTURED: The Dow Jones Industrial Average continued basing and closed just below resistance on Thursday. Volume remains light.
|
|
|
 |
Healthcare Index Rallying As Prospects For Public Option Dim
Kenneth J. Gruneisen - Passed the CAN SLIM® Master's Exam
Retail Index ($RLX +1.52%) Oil Services Index ($OSX +1.62%) Integrated Oil Index ($XOI +0.60%) Financial shares were laggards on Thursday as the Bank Index ($BKX -0.85%) and Broker/Dealer Index ($XBD -0.70%) created a drag that limited the major indices' gains. The Gold & Silver Index ($XAU -0.29%) ended with a small loss. Most tech sector indices edged lower as the Networking Index ($NWX -0.23%), Semiconductor Index ($SOX -0.14%), and Biotechnology Index ($BTK -0.07%) lost ground while the Internet Index ($IIX +0.51%) posted a modest gain.
Charts courtesy www.stockcharts.com
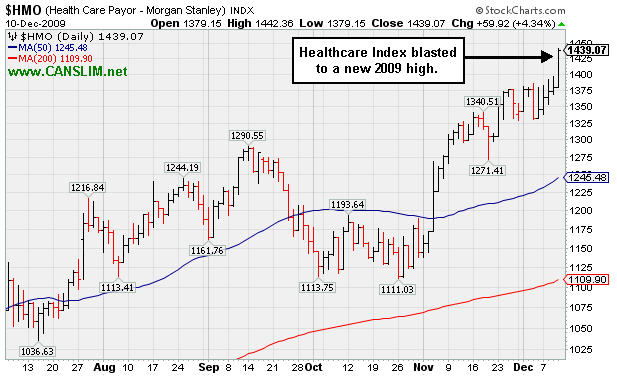
PICTURED: The Healthcare Index ($HMO +4.34%) was a standout gainer as companies including CIGNA Corp. (CI +6.05%) and Unitedhealth Group, Inc. (UNH +6.35%) rallied. The optimism came as the Senate appeared less likely to move forward any time soon with the public option part of current healthcare reform initiatives.
| Oil Services |
$OSX |
185.60 |
+2.95 |
+1.62% |
+52.90% |
| Healthcare |
$HMO |
1,439.07 |
+59.92 |
+4.34% |
+49.88% |
| Integrated Oil |
$XOI |
1,049.28 |
+6.27 |
+0.60% |
+7.10% |
| Semiconductor |
$SOX |
338.61 |
-0.48 |
-0.14% |
+59.59% |
| Networking |
$NWX |
228.18 |
-0.52 |
-0.23% |
+58.58% |
| Internet |
$IIX |
228.52 |
+1.17 |
+0.51% |
+70.83% |
| Broker/Dealer |
$XBD |
112.15 |
-0.79 |
-0.70% |
+44.77% |
| Retail |
$RLX |
407.27 |
+6.08 |
+1.52% |
+45.84% |
| Gold & Silver |
$XAU |
176.14 |
-0.51 |
-0.29% |
+42.22% |
| Bank |
$BKX |
43.15 |
-0.37 |
-0.85% |
-2.64% |
| Biotech |
$BTK |
908.44 |
-0.63 |
-0.07% |
+40.37% |
|
|
|
 |
Base On Base Pattern Is A Sound Chart Formation
Kenneth J. Gruneisen - Passed the CAN SLIM® Master's Exam
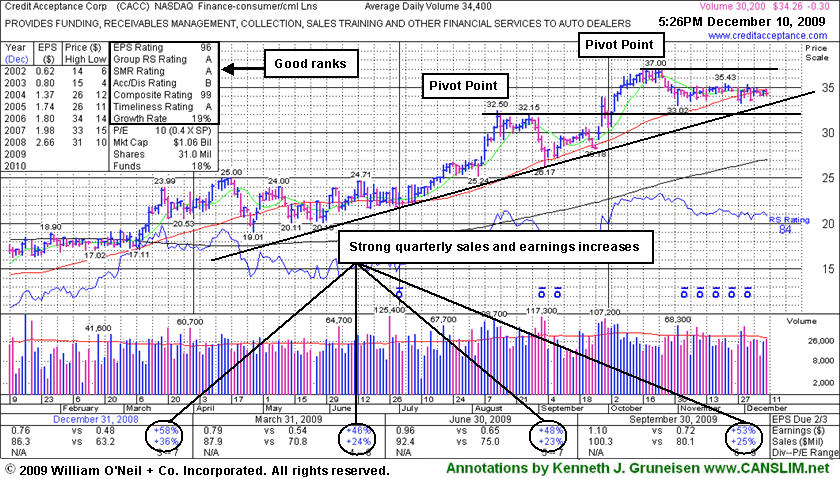
Credit Acceptance Corp (CACC -$0.30 or -0.87% to $34.26) is consolidating just below its 50-day moving average (DMA) line (now $34.77). It has been showing some resilience near that important short-term average line while enduring some distributional pressure. After an 8-week flat base it is continuing its consolidation above prior chart highs in the $32 area, building a base-on-base pattern. The Finance - Consumer/Commercial Loans firm has maintained a great track record of annual and quarterly sales revenues and earnings increases that satisfy the C and A criteria of the investment system. The high-ranked leader's 9/29/09 breakout gain was backed by more than 2 times average volume. Since featured it has also risen above its 2006-2007 highs ($33-34) to new all-time highs, which is a very reassuring sign of strength. CACC was featured in yellow in the 9/29/09 mid-day report (read here).
Investors might be concerned about the weakness and wait for signs of support while considering the current consolidation an opportunity to accumulate shares on the stock's first pullback to its 50 DMA line since its bullish breakout. However, it has met the definition of a new "flat base" which could eventually be followed by a fresh technical buy signal. In fact, a base-on-base pattern is considered to be a very solid set-up pattern. Patience may allow investors to see more proof of institutional buying demand (the I criteria), and make initial buys or add-on buying efforts in the event of a powerful breakout above its $37 high with volume. Meanwhile, further weakness would raise more serious concerns, especially if volume expands behind more damaging losses under its recent lows.
|
|
|
Color Codes Explained :
Y - Better candidates highlighted by our
staff of experts.
G - Previously featured
in past reports as yellow but may no longer be buyable under the
guidelines.
***Last / Change / Volume quote data in this table corresponds with the timestamp on the note***
Symbol/Exchange
Company Name
Industry Group |
Last |
Chg. |
Vol
% DAV |
Date Featured |
Price Featured |
Latest Pivot Point
Featured |
Status |
| Latest Max Buy Price |
ARST
-
|
$23.13
|
+0.11
|
371,704
66% DAV
565,400
|
9/1/2009
(Date
Featured) |
$19.91
(Price
Featured) |
PP = $20.90 |
G |
| MB = $21.95 |
Most Recent Note - 12/10/2009 5:10:58 PM
G - Held its ground today after 3 consecutive losses on near average or light volume. Its outlook is increasingly questionable the longer it continues to struggle below its 50 DMA line. ARST was first featured in yellow at $19.91 in the 9/01/09 mid-day report with an annotated daily graph (read here).
>>> The latest Featured Stock Update with an annotated graph appeared on 12/3/2009. click here.
|
|
C
A
S
I |
News |
Chart |
SEC
View all notes Alert
me of new notes
Company
Profile
|
ASIA
-
|
$30.55
|
+0.00
|
1,311,643
99% DAV
1,318,900
|
10/14/2009
(Date
Featured) |
$23.05
(Price
Featured) |
PP = $22.19 |
G |
| MB = $23.30 |
Most Recent Note - 12/10/2009 5:15:40 PM
G - Held its ground again today while perched near its 52 week high after a gap up for a considerable gain on 12/07/09 with almost 8 times average volume on news it will merge with Linkage Technologies International Holdings Limited, leading providers of software solutions and IT services for the telecommunications industry in China. Featured 10/14/09 in the mid-day report (read here) as it gapped up for a new 52-week high with 5 times average volume, triggering a technical buy signal by blasting above its pivot point. First featured in the August 2009 CANSLIM.net News (read here).
>>> The latest Featured Stock Update with an annotated graph appeared on 12/7/2009. click here.
|
|
C
A
S
I |
News |
Chart |
SEC
View all notes Alert
me of new notes
Company
Profile
|
BIDU
- NASDAQ
Baidu Inc Ads
INTERNET - Internet Information Providers
|
$422.32
|
-4.14
|
915,264
43% DAV
2,112,700
|
9/8/2009
(Date
Featured) |
$351.80
(Price
Featured) |
PP = $440.00 |
Y |
| MB = $462.00 |
Most Recent Note - 12/10/2009 5:17:12 PM
Y - Consolidating in a tight trading range near all-time highs and just above its 50 DMA line. Color code was changed to yellow with new pivot point cited. Technically, it has built a sloppy base over nearly 7 weeks while consolidating in a tight trading range near all-time highs as its 50-day moving average (DMA) line has caught up. Since quietly rallying to new highs in November it has stalled. BIDU traded up as much as +23% from its price when featured in yellow in the 9/08/09 Mid-Day BreakOuts Report (read here).
>>> The latest Featured Stock Update with an annotated graph appeared on 12/9/2009. click here.
|
|
C
A
S
I |
News |
Chart |
SEC
View all notes Alert
me of new notes
Company
Profile
|
CAAS
- NASDAQ
China Automotive Systems
AUTOMOTIVE - Auto Parts
|
$20.43
|
-0.18
|
480,573
84% DAV
570,600
|
11/30/2009
(Date
Featured) |
$18.84
(Price
Featured) |
PP = $17.62 |
G |
| MB = $18.50 |
Most Recent Note - 12/10/2009 5:22:44 PM
G - Hovering near its all-time highs, extended from a sound base under the investment system rules. The Chinese maker of power steering systems was rising from an advanced "3-weeks tight" type of chart pattern as it showed up in yellow in the 11/30/09 mid-day report (read here). Recent quarters show accelerating sales revenues and earnings increases, and it has a good annual earnings history.
>>> The latest Featured Stock Update with an annotated graph appeared on 11/30/2009. click here.
|
|
C
A
S
I |
News |
Chart |
SEC
View all notes Alert
me of new notes
Company
Profile
|
CACC
- NASDAQ
Credit Acceptance Corp
FINANCIAL SERVICES - Credit Services
|
$34.26
|
-0.30
|
31,460
91% DAV
34,400
|
9/29/2009
(Date
Featured) |
$33.48
(Price
Featured) |
PP = $37.10 |
Y |
| MB = $38.96 |
Most Recent Note - 12/10/2009 5:25:50 PM
Y - Consolidating quietly just below its 50 DMA line. It has been showing some resilience near that important short-term average line after encountering distributional pressure last week. After an 8-week flat base it is continuing its consolidation above prior chart highs in the $32 area. The Finance - Consumer/Commercial Loans firm has maintained a great track record of annual and quarterly sales revenues and earnings increases. It was featured on 9/29/09 in yellow in the mid-day report (read here).
>>> The latest Featured Stock Update with an annotated graph appeared on 12/10/2009. click here.
|
|
C
A
S
I |
News |
Chart |
SEC
View all notes Alert
me of new notes
Company
Profile
|
CRM
- NYSE
Salesforce.com Inc
INTERNET - Internet Software & Services
|
$64.69
|
+0.92
|
996,961
61% DAV
1,630,500
|
8/16/2009
(Date
Featured) |
$47.12
(Price
Featured) |
PP = $45.59 |
G |
| MB = $47.87 |
Most Recent Note - 12/10/2009 5:44:33 PM
G - Consolidating for the past 4 weeks above important support at its 50 DMA line and within close striking distance of its 52 week high.
>>> The latest Featured Stock Update with an annotated graph appeared on 12/8/2009. click here.
|
|
C
A
S
I |
News |
Chart |
SEC
View all notes Alert
me of new notes
Company
Profile
|
CTRP
- NASDAQ
Ctrip.com Intl Ltd Adr
LEISURE - Resorts & Casinos
|
$74.14
|
+1.04
|
1,021,090
94% DAV
1,085,300
|
12/1/2009
(Date
Featured) |
$75.38
(Price
Featured) |
PP = $73.91 |
Y |
| MB = $77.61 |
Most Recent Note - 12/10/2009 5:52:31 PM
Y - Small gain today on average volume, closing back above its pivot point. Encountered some distributional pressure last week when briefly trading above its "max buy" price of $77.60. Featured on 12/01/09 in yellow in the mid-day report (read here). It triggered a technical buy signal as it rose with more than +50% above average volume from a brief consolidation resembling a "high-tight-flag" pattern which it formed after repairing a late-October breach of its 50 DMA line. Fundamentally, its sales revenues and earnings increases have shown acceleration in the 3 most recent quarterly comparisons and rose above the +25% guideline. Based on weak technical action it was dropped from the Featured Stocks list on 6/10/08, when it closed at $49.84, yet it has rebounded very impressively from subsequent lows in the $16 area.
>>> The latest Featured Stock Update with an annotated graph appeared on 12/1/2009. click here.
|
|
C
A
S
I |
News |
Chart |
SEC
View all notes Alert
me of new notes
Company
Profile
|
HEAT
-
|
$14.88
|
-0.20
|
687,620
84% DAV
822,300
|
11/17/2009
(Date
Featured) |
$12.00
(Price
Featured) |
PP = $12.61 |
G |
| MB = $13.24 |
Most Recent Note - 12/10/2009 5:55:03 PM
G - Holding its ground, but in the past week it encountered distributional pressure, where plenty of selling offset buying demand. The investment system rules say a stock should be held a minimum of 8 weeks after rising more than +20% in the first 2-3 weeks from being bought. HEAT found support near its pivot point during its recent consolidation, giving investors an opportunity to accumulate shares without chasing it and buying it "extended" from its latest base. First featured in yellow in the 11/17/09 mid-day report (read here) when technically rising from a "double bottom" base, reaching a new all-time high.
>>> The latest Featured Stock Update with an annotated graph appeared on 12/2/2009. click here.
|
|
C
A
S
I |
News |
Chart |
SEC
View all notes Alert
me of new notes
Company
Profile
|
LFT
-
|
$35.62
|
-0.08
|
314,841
70% DAV
451,300
|
11/17/2009
(Date
Featured) |
$31.77
(Price
Featured) |
PP = $33.04 |
G |
| MB = $34.69 |
Most Recent Note - 12/10/2009 5:55:43 PM
G - Today was its 4th consecutive small loss on light volume while still quietly perched near all-time highs. It remains a bit extended after recently rising from a choppy 14-week base. Prior chart highs in the $31 area are an initial support level to watch. A proposed offering of additional shares on 11/16/09 seems well received by the market. Its fundamentals remain strong.
>>> The latest Featured Stock Update with an annotated graph appeared on 12/4/2009. click here.
|
|
C
A
S
I |
News |
Chart |
SEC
View all notes Alert
me of new notes
Company
Profile
|
|
|
|
THESE ARE NOT BUY RECOMMENDATIONS!
Comments contained in the body of this report are technical
opinions only. The material herein has been obtained
from sources believed to be reliable and accurate, however,
its accuracy and completeness cannot be guaranteed.
This site is not an investment advisor, hence it does
not endorse or recommend any securities or other investments.
Any recommendation contained in this report may not
be suitable for all investors and it is not to be deemed
an offer or solicitation on our part with respect to
the purchase or sale of any securities. All trademarks,
service marks and trade names appearing in this report
are the property of their respective owners, and are
likewise used for identification purposes only.
This report is a service available
only to active Paid Premium Members.
You may opt-out of receiving report notifications
at any time. Questions or comments may be submitted
by writing to Premium Membership Services 665 S.E. 10 Street, Suite 201 Deerfield Beach, FL 33441-5634 or by calling 1-800-965-8307
or 954-785-1121.
|
|
|


