You are not logged in.
This means you
CAN ONLY VIEW reports that were published prior to Monday, April 14, 2025.
You
MUST UPGRADE YOUR MEMBERSHIP if you want to see any current reports.
AFTER MARKET UPDATE - MONDAY, DECEMBER 8TH, 2014
Previous After Market Report Next After Market Report >>>
|
|
|
|
DOW |
-106.31 |
17,852.48 |
-0.59% |
|
Volume |
793,570,520 |
+7% |
|
Volume |
1,807,727,500 |
+10% |
|
NASDAQ |
-40.07 |
4,740.69 |
-0.84% |
|
Advancers |
921 |
29% |
|
Advancers |
712 |
24% |
|
S&P 500 |
-15.06 |
2,060.31 |
-0.73% |
|
Decliners |
2,198 |
68% |
|
Decliners |
2,159 |
73% |
|
Russell 2000 |
-15.12 |
1,167.31 |
-1.28% |
|
52 Wk Highs |
230 |
|
|
52 Wk Highs |
145 |
|
|
S&P 600 |
-8.44 |
674.26 |
-1.24% |
|
52 Wk Lows |
293 |
|
|
52 Wk Lows |
173 |
|
|
 |
Breadth Negative as Major Averages Fell With Higher Volume Totals
Kenneth J. Gruneisen - Passed the CAN SLIM® Master's Exam
Stocks finished firmly lower on Monday. The Dow fell 106 points from its all-time high to 17,852. The S&P 500 retreated 15 points from its record level to 2,060. The NASDAQ Composite lost 40 points to close at 4,740. There volume totals were reported higher on the NYSE and higher on the Nasdaq exchange, a sign of distributional pressure. Breadth was negative as decliners led advancers by more than a 2-1 margin on the NYSE and 3-1 margin on the Nasdaq exchange. There were 86 high-ranked companies from the CANSLIM.net Leaders List that made new 52-week highs and appeared on the CANSLIM.net BreakOuts Page, down from the prior session total of 87 stocks. New 52-week lows outnumbered new 52-week highs on the NYSE and on the Nasdaq exchange. There were 3 gainers among the 12 high-ranked companies currently on the Featured Stocks Page. A "confirmed uptrend" for the market (M criteria) has been repeatedly noted in this daily Market Commentary since large gains were noted on 10/21/14 backed by higher volume totals as leadership (stocks hitting new 52-week highs) expanded.
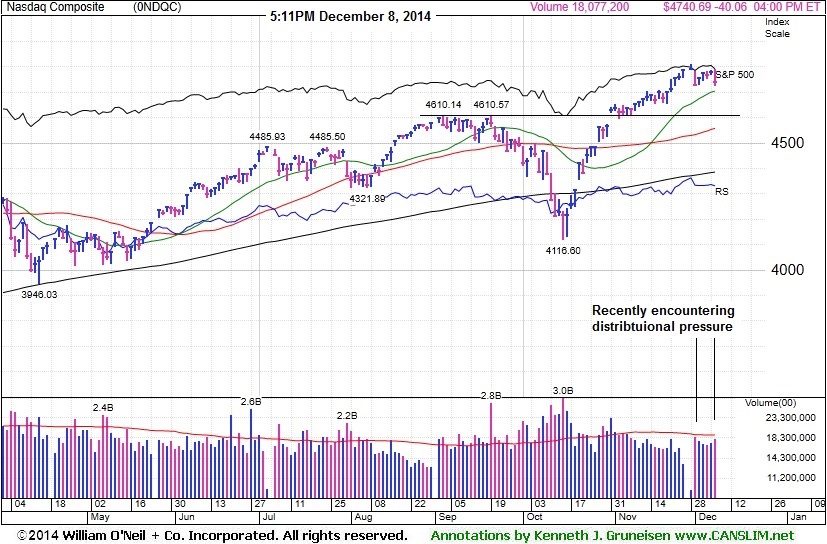
PICTURED: The Nasdaq Composite Index has encountered mild distributional pressure marked by losses on higher (but below average) volume.
The major averages declined following a weaker-than-expected Chinese trade report and a negative revision to Japan's third-quarter GDP figure. On the U.S. economic front, Atlanta Fed President Dennis Lockhart said although the global slowdown poses a risk to the U.S., the central bank remains on track to tighten interest rates sometime in the second half of 2015.
Energy stocks also weighed on market as the price of WTI crude oil declined -4.4% to a five-year low of $62.94/barrel. The sector slumped -3.8% with Chevron (CVX -3.67%) and Transocean (RIG -4.97%) falling. McDonald's (MCD -3.84%) fell after posting November same-store sales below projections. Health care was up the most benefiting from a round of M&A news. Cubist Pharmaceuticals surged (CBST +35.29%) after Merck agreed to by the company for $8.4 billion. Shares of Merck (MRK -0.63%) following the merger announcement.
Treasuries gained as the decline in crude oil tempered inflation fears. Benchmark 10-year notes rose 14/32 to yield 2.26%. Gold rose with COMEX futures up 0.4% to $1,194.70/ounce.
Disciplined investors know that new buying efforts may be made under the fact-based investment system only in stocks meeting all key criteria. The Featured Stocks Page shows the most action-worthy candidates and their latest notes and a Headline Link directs members to the latest detailed analysis with data-packed graphs annotated by a Certified expert along with links to additional resources. The Premium Member Homepage includes "dynamic archives" to all prior pay reports published.
|
 Kenneth J. Gruneisen started out as a licensed stockbroker in August 1987, a couple of months prior to the historic stock market crash that took the Dow Jones Industrial Average down -22.6% in a single day. He has published daily fact-based fundamental and technical analysis on high-ranked stocks online for two decades. Through FACTBASEDINVESTING.COM, Kenneth provides educational articles, news, market commentary, and other information regarding proven investment systems that work in good times and bad.
Comments contained in the body of this report are technical opinions only and are not necessarily those of Gruneisen Growth Corp. The material herein has been obtained from sources believed to be reliable and accurate, however, its accuracy and completeness cannot be guaranteed. Our firm, employees, and customers may effect transactions, including transactions contrary to any recommendation herein, or have positions in the securities mentioned herein or options with respect thereto. Any recommendation contained in this report may not be suitable for all investors and it is not to be deemed an offer or solicitation on our part with respect to the purchase or sale of any securities. |
|
 |
Energy, Networking and Semiconductor Groups Fell
Kenneth J. Gruneisen - Passed the CAN SLIM® Master's Exam
Weakness in energy-related shares was the highlight on Monday as the Oil Services Index ($OSX -4.64%) and the Integrated Oil Index ($XOI -4.10%) both suffered large losses. The Networking Index ($NWX -1.75%) and Semiconductor Index ($SOX -1.44%) lost ground while M&A action buoyed the Biotechnology Index ($BTK +2.06%). The Retail Index ($RLX -0.39%) edged lower and action was quiet in the financial groups as the Bank Index ($BKX -0.07%) and the Broker/Dealer Index ($XBD -0.02 ) both finished flat. The Gold & Silver Index ($XAU +0.04%) was also unchanged.
Charts courtesy www.stockcharts.com
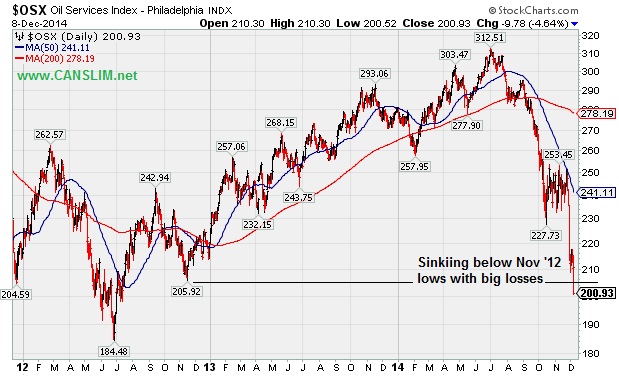
PICTURED: The Oil Services Index ($OSX -4.64%) fell below its November 2012 lows with a damaging loss.
| Oil Services |
$OSX |
200.93 |
-9.77 |
-4.64% |
-28.50% |
| Integrated Oil |
$XOI |
1,308.02 |
-55.90 |
-4.10% |
-12.98% |
| Semiconductor |
$SOX |
693.00 |
-10.12 |
-1.44% |
+29.53% |
| Networking |
$NWX |
345.61 |
-6.16 |
-1.75% |
+6.69% |
| Broker/Dealer |
$XBD |
183.81 |
-0.03 |
-0.02% |
+14.48% |
| Retail |
$RLX |
995.47 |
-3.93 |
-0.39% |
+5.92% |
| Gold & Silver |
$XAU |
70.18 |
+0.03 |
+0.04% |
-16.60% |
| Bank |
$BKX |
74.55 |
-0.05 |
-0.07% |
+7.64% |
| Biotech |
$BTK |
3,523.70 |
+71.29 |
+2.06% |
+51.20% |
|
|
|
 |
Testing Support While Encountering Recent Distributional Pressure
Kenneth J. Gruneisen - Passed the CAN SLIM® Master's Exam
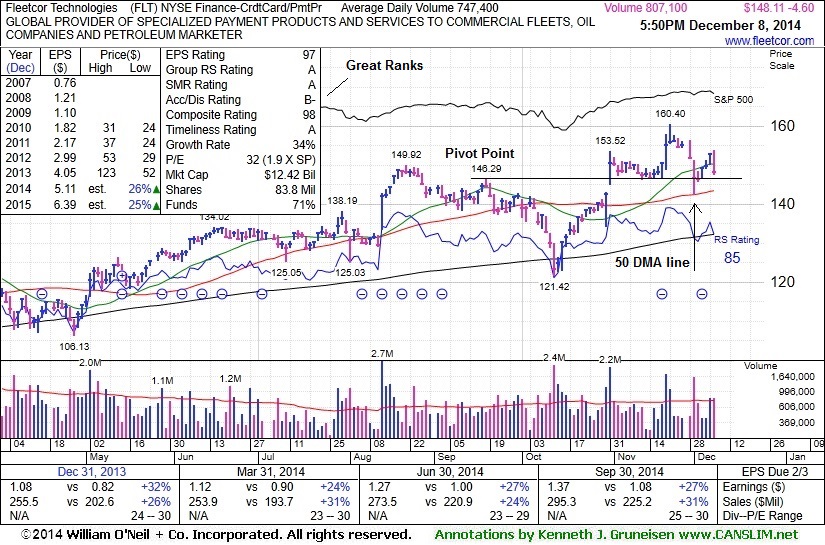
FleetCor Technologies, Inc's (FLT -$4.60 or -3.01% to $148.11) has been encountering distributional pressure while consolidating above prior highs in the $146-149 area. Big losses recently tested support at its 50-day moving average (DMA) line. More damaging losses may trigger a worrisome technical sell signal.
FLT last appeared in this FSU section on 11/18/14 with annotated graphs under the headline, "Consolidation Continues Above Prior Highs". It was highlighted in yellow in the 10/31/14 mid-day report (read here) and finished strong after blasting above the pivot point cited based on its 9/18/14 high in a "double bottom" base.
It reported earnings +27% on +31% sales revenues for the Sep '14 quarter, continuing its strong earnings history with results above the +25% minimum guideline (C criteria). Its Relative Strength rating of 85 remains above the 80+ minimum guideline for buy candidates.
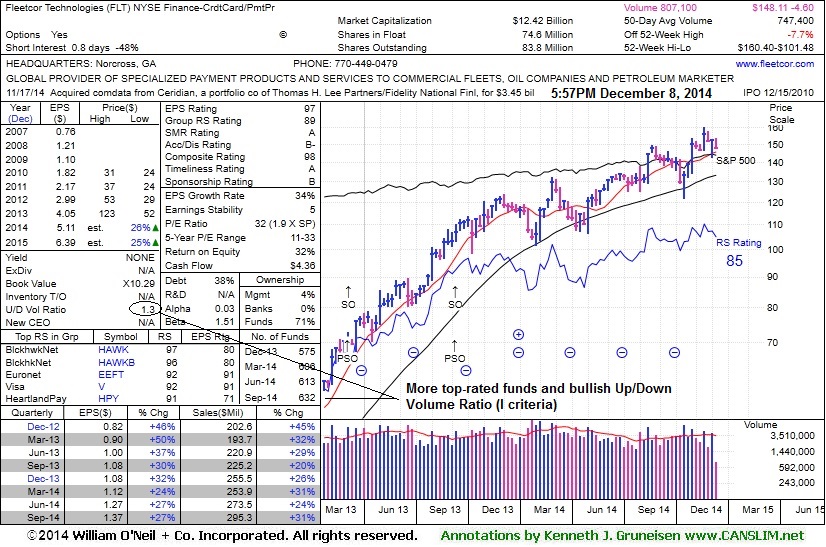
The company hails from the Finance - Credit Card Payment Processing group which saw big gains in recent weeks from Visa (V) and MasterCard (MA). Impressive strength and leadership from other firms in the same industry group is a reassurance concerning the L criteria. The company completed a Secondary Offering on 9/11/13. Prior Secondary Offerings on 3/14/12, 6/11/12, 11/29/12, and 3/08/13 were previously noted, "Such offerings often are a short-term hindrance to upward price progress yet typically result in broader institutional ownership interest." The number of top-rated funds owning its shares rose from 193 in Mar '12 to 632 in Sep '14, a reassuring sign concerning the I criteria. Its current Up/Down Volume Ratio of 1.3 is an unbiased indication its shares have been under accumulation over the past 50 days.
|
|
|
Color Codes Explained :
Y - Better candidates highlighted by our
staff of experts.
G - Previously featured
in past reports as yellow but may no longer be buyable under the
guidelines.
***Last / Change / Volume data in this table is the closing quote data***
Symbol/Exchange
Company Name
Industry Group |
PRICE |
CHANGE
(%Change) |
Day High |
Volume
(% DAV)
(% 50 day avg vol) |
52 Wk Hi
% From Hi |
Featured
Date |
Price
Featured |
Pivot Featured |
|
Max Buy |
ACT
-
NYSE
Actavis plc
Medical-Generic Drugs
|
$266.06
|
-1.44
-0.54% |
$268.60
|
2,491,629
79.89% of 50 DAV
50 DAV is 3,119,000
|
$272.75
-2.45%
|
6/20/2014
|
$216.53
|
PP = $230.87
|
|
MB = $242.41
|
Most Recent Note - 12/1/2014 6:34:20 PM
G - Quietly consolidating after spiking to new 52-week highs with volume-driven gains following news it plans to acquire Allergan (AGN) for $66 Billion. Did not form a sound base, and it is extended from prior highs in the $249 area defining near-term support.
>>> FEATURED STOCK ARTICLE : Perched at Highs Following Spike on Acquisition Plans - 11/24/2014
View all notes |
Set NEW NOTE alert |
CANSLIM.net Company Profile |
SEC
News |
Chart |
Request a new note
C
A N
S L
I M


|
AFSI
-
NASDAQ
Amtrust Financial Svcs
INSURANCE - Property and; Casualty Insurance
|
$53.83
|
+1.28
2.44% |
$54.79
|
2,493,361
242.54% of 50 DAV
50 DAV is 1,028,000
|
$55.30
-2.66%
|
10/17/2014
|
$45.24
|
PP = $46.02
|
|
MB = $48.32
|
Most Recent Note - 12/3/2014 3:42:10 PM
G - Touching a new 52-week high with today's gain on light volume, rising from a brief consolidation, not a sound base. Prior highs near $46 coincide with its 50 DMA line defining important near-term support.
>>> FEATURED STOCK ARTICLE : No Sound Base Formed, Yet Little Resistance Remains - 11/21/2014
View all notes |
Set NEW NOTE alert |
CANSLIM.net Company Profile |
SEC
News |
Chart |
Request a new note
C
A N
S L
I M
|
ALXN
-
NASDAQ
Alexion Pharmaceuticals
DRUGS - Drug Manufacturers - Other
|
$198.61
|
+0.95
0.48% |
$198.88
|
627,916
55.13% of 50 DAV
50 DAV is 1,139,000
|
$203.30
-2.31%
|
10/23/2014
|
$184.01
|
PP = $185.53
|
|
MB = $194.81
|
Most Recent Note - 12/2/2014 5:37:48 PM
G - Rallied to new highs today with a volume-driven gain from a brief consolidation, not a sufficient length base. Recent lows near $185 define initial support to watch above its 50 DMA line.
>>> FEATURED STOCK ARTICLE : Quietly Consolidating Near All-Time High - 11/28/2014
View all notes |
Set NEW NOTE alert |
CANSLIM.net Company Profile |
SEC
News |
Chart |
Request a new note
C
A N
S L
I M
|
BIDU
-
NASDAQ
Baidu Inc Ads
INTERNET - Internet Information Providers
|
$232.72
|
+1.91
0.83% |
$232.96
|
2,886,554
78.38% of 50 DAV
50 DAV is 3,683,000
|
$251.99
-7.65%
|
10/30/2014
|
$234.08
|
PP = $231.51
|
|
MB = $243.09
|
Most Recent Note - 12/3/2014 5:21:04 PM
Y - Consolidating near prior highs and its 50 DMA line defining important near-term support to watch. See the latest FSU analysis for more details and new annotated graphs.
>>> FEATURED STOCK ARTICLE : Consolidating Near Prior Highs and Above 50-Day Average - 12/3/2014
View all notes |
Set NEW NOTE alert |
CANSLIM.net Company Profile |
SEC
News |
Chart |
Request a new note
C
A N
S L
I M
|
EPAM
-
NYSE
Epam Systems Inc
COMPUTER SOFTWARE and SERVICES - Information Technology Service
|
$50.53
|
+0.54
1.08% |
$50.82
|
1,328,381
328.00% of 50 DAV
50 DAV is 405,000
|
$52.29
-3.37%
|
10/23/2014
|
$45.21
|
PP = $46.09
|
|
MB = $48.39
|
Most Recent Note - 12/5/2014 12:26:39 PM
G - Tallying a volume-driven gain today. Perched within close striking distance of its 52-week high after stubbornly holding its ground. Its 50 DMA line ($46.28) defines near-term support to watch on pullbacks.
>>> FEATURED STOCK ARTICLE : Quiet Gain For New High Close - 11/26/2014
View all notes |
Set NEW NOTE alert |
CANSLIM.net Company Profile |
SEC
News |
Chart |
Request a new note
C
A N
S L
I M
|
Symbol/Exchange
Company Name
Industry Group |
PRICE |
CHANGE
(%Change) |
Day High |
Volume
(% DAV)
(% 50 day avg vol) |
52 Wk Hi
% From Hi |
Featured
Date |
Price
Featured |
Pivot Featured |
|
Max Buy |
FB
-
NASDAQ
Facebook Inc Cl A
INTERNET
|
$76.36
|
+1.12
1.49% |
$76.76
|
24,282,405
67.81% of 50 DAV
50 DAV is 35,812,000
|
$81.16
-5.91%
|
9/9/2014
|
$76.67
|
PP = $76.84
|
|
MB = $80.68
|
Most Recent Note - 12/4/2014 6:13:51 PM
G - Recent gains lacked volume conviction. Needs gains above the 50 DMA line for its outlook to improve. See the latest FSU analysis for more details new annotated graphs.
>>> FEATURED STOCK ARTICLE : Gains Above 50-Day Moving Average Needed for Outlook to Improve - 12/4/2014
View all notes |
Set NEW NOTE alert |
CANSLIM.net Company Profile |
SEC
News |
Chart |
Request a new note
C
A N
S L
I M
|
FLT
-
NYSE
Fleetcor Technologies
DIVERSIFIED SERVICES - Business/Management Services
|
$152.71
|
+3.03
2.02% |
$152.77
|
826,028
110.73% of 50 DAV
50 DAV is 746,000
|
$160.40
-4.79%
|
10/31/2014
|
$148.50
|
PP = $146.29
|
|
MB = $153.60
|
Most Recent Note - 12/1/2014 12:11:22 PM
Y - Color code is changed to yellow while undercutting prior highs in the $146-149 area raising concerns with a big loss today on higher volume, testing support at its 50 DMA line. More damaging losses may trigger a worrisome technical sell signal.
>>> FEATURED STOCK ARTICLE : Consolidation Continues Above Prior Highs - 11/18/2014
View all notes |
Set NEW NOTE alert |
CANSLIM.net Company Profile |
SEC
News |
Chart |
Request a new note
C
A N
S L
I M
|
ILMN
-
NASDAQ
Illumina Inc
DRUGS - Biotechnology
|
$189.90
|
-0.93
-0.49% |
$196.00
|
1,184,539
96.86% of 50 DAV
50 DAV is 1,223,000
|
$197.37
-3.78%
|
10/22/2014
|
$188.77
|
PP = $182.27
|
|
MB = $191.38
|
Most Recent Note - 12/1/2014 6:44:33 PM
Y - Volume totals have been cooling while consolidating well above prior highs near $182 and above its 50 DMA line. Damaging losses below those levels would raise concerns and trigger technical sell signals.
>>> FEATURED STOCK ARTICLE : Quietly Consolidating Back Below "Max Buy" Level - 11/25/2014
View all notes |
Set NEW NOTE alert |
CANSLIM.net Company Profile |
SEC
News |
Chart |
Request a new note
C
A N
S L
I M
|
NBCB
-
NASDAQ
First N B C Bank Hldg
Banks-Southeast
|
$34.70
|
+0.32
0.93% |
$35.14
|
71,398
8.87% of 50 DAV
50 DAV is 805,000
|
$38.18
-9.11%
|
10/31/2014
|
$36.31
|
PP = $35.93
|
|
MB = $37.73
|
Most Recent Note - 12/2/2014 12:44:50 PM
Y - Volume-driven loss on the prior session raised concerns. Undercut prior highs near $34 and its 50 DMA line briefly today then found prompt support and managed an encouraging "positive reversal". More damaging losses would raise serious concerns and trigger a worrisome technical sell signal.
>>> FEATURED STOCK ARTICLE : Fifth Consecutive Loss While Retreating From Highs - 11/19/2014
View all notes |
Set NEW NOTE alert |
CANSLIM.net Company Profile |
SEC
News |
Chart |
Request a new note
C
A N
S L
I M
|
PANW
-
NYSE
Palo Alto Networks
Computer Sftwr-Security
|
$118.88
|
+0.59
0.50% |
$119.27
|
1,012,376
50.77% of 50 DAV
50 DAV is 1,994,000
|
$123.22
-3.52%
|
7/30/2014
|
$84.21
|
PP = $85.88
|
|
MB = $90.17
|
Most Recent Note - 12/1/2014 6:36:10 PM
G - Pulled back from all-time highs with higher volume today. It did not form a sound base, and the 50 DMA line defines near-term support to watch. Reported earnings +88% on +50% sales revenues for the Oct '14 quarter. See the latest FSU analysis for more details and new annotated graphs.
>>> FEATURED STOCK ARTICLE : Under Accumulation But Extended From Sound Base - 12/1/2014
View all notes |
Set NEW NOTE alert |
CANSLIM.net Company Profile |
SEC
News |
Chart |
Request a new note
C
A N
S L
I M
|
Symbol/Exchange
Company Name
Industry Group |
PRICE |
CHANGE
(%Change) |
Day High |
Volume
(% DAV)
(% 50 day avg vol) |
52 Wk Hi
% From Hi |
Featured
Date |
Price
Featured |
Pivot Featured |
|
Max Buy |
STRT
-
NASDAQ
Strattec Security Corp
AUTOMOTIVE - Auto Parts
|
$103.95
|
+2.39
2.35% |
$104.34
|
24,520
98.08% of 50 DAV
50 DAV is 25,000
|
$110.96
-6.32%
|
11/20/2014
|
$105.76
|
PP = $109.54
|
|
MB = $115.02
|
Most Recent Note - 12/2/2014 5:39:11 PM
Y - Fell for a 5th consecutive loss on even higher volume today, a sign of distributional pressure. After forming an advanced "3-weeks tight" base it has not produced the volume-driven gains for new highs needed to trigger a new (or add-on) technical buy signal. Prior highs coincide with its 50 DMA line defining important near-term support to watch on pullbacks.
>>> FEATURED STOCK ARTICLE : Formed New Advanced "3-Weeks Tight" Base - 11/20/2014
View all notes |
Set NEW NOTE alert |
CANSLIM.net Company Profile |
SEC
News |
Chart |
Request a new note
C
A N
S L
I M
|
UIHC
-
NASDAQ
United Insurance Holding
Insurance-Prop/Cas/Titl
|
$20.59
|
+1.00
5.10% |
$20.85
|
337,528
148.69% of 50 DAV
50 DAV is 227,000
|
$20.21
1.88%
|
12/5/2014
|
$20.64
|
PP = $20.31
|
|
MB = $21.33
|
Most Recent Note - 12/5/2014 6:18:47 PM
Y - Finished strong after highlighted in yellow with pivot point cited based on its 11/05/14 high plus 10 cents. Hitting a new 52-week high with today's 4th consecutive gain, rising from an orderly flat base-on-base pattern. Volume should be at least +40% above average behind gains above a stock's pivot point to trigger a proper technical buy signal. Reported earnings +58% on +33% sales revenues for the Sep '14 quarter, its 5th consecutive quarterly comparison above the +25% minimum guideline (C criteria). Completed a new Public Offering on 2/27/14. See the latest FSU analysis for more details and new annotated graphs.
>>> FEATURED STOCK ARTICLE : Technical Breakout Indicative of Institutional Demand - 12/5/2014
View all notes |
Set NEW NOTE alert |
CANSLIM.net Company Profile |
SEC
News |
Chart |
Request a new note
C
A N
S L
I M
|
|
|
|
THESE ARE NOT BUY RECOMMENDATIONS!
Comments contained in the body of this report are technical
opinions only. The material herein has been obtained
from sources believed to be reliable and accurate, however,
its accuracy and completeness cannot be guaranteed.
This site is not an investment advisor, hence it does
not endorse or recommend any securities or other investments.
Any recommendation contained in this report may not
be suitable for all investors and it is not to be deemed
an offer or solicitation on our part with respect to
the purchase or sale of any securities. All trademarks,
service marks and trade names appearing in this report
are the property of their respective owners, and are
likewise used for identification purposes only.
This report is a service available
only to active Paid Premium Members.
You may opt-out of receiving report notifications
at any time. Questions or comments may be submitted
by writing to Premium Membership Services 665 S.E. 10 Street, Suite 201 Deerfield Beach, FL 33441-5634 or by calling 1-800-965-8307
or 954-785-1121.
|
|
|

