***Last / Change / Volume data in this table is the closing quote data***
Symbol/Exchange
Company Name
Industry Group |
PRICE |
CHANGE
(%Change) |
Day High |
Volume
(% DAV)
(% 50 day avg vol) |
52 Wk Hi
% From Hi |
Featured
Date |
Price
Featured |
Pivot Featured |
|
Max Buy |
ABV
-
NYSE
Comp De Bebidas Adr
FOOD and BEVERAGE - Beverages - Brewers
|
$140.94
|
+0.44
0.31% |
$142.05
|
308,681
47.91% of 50 DAV
50 DAV is 644,300
|
$145.36
-3.04%
|
11/4/2010
|
$142.35
|
PP = $143.63
|
|
MB = $150.81
|
Most Recent Note - 12/3/2010 4:26:49 PM
Y - It posted a considerable gain on light volume today, rallying near its 52-week high. A convincing gain with above average volume has not been seen since October, and recent distributional pressure remains a concern until proof of fresh institutional buying demand is shown. Color code is changed to yellow based on its recent resilience.
>>> The latest Featured Stock Update with an annotated graph appeared on 12/3/2010. Click here.
View all notes |
Alert me of new notes |
CANSLIM.net Company Profile |
SEC |
Zacks Reports |
StockTalk |
News |
Chart |
Request a new note
C
A N
S L
I M


|
ARUN
-
NASDAQ
Aruba Networks Inc
COMPUTER HARDWARE - Networking andamp; Communication Dev
|
$22.90
|
+0.60
2.69% |
$22.92
|
1,579,283
59.41% of 50 DAV
50 DAV is 2,658,500
|
$24.28
-5.68%
|
8/30/2010
|
$18.12
|
PP = $18.51
|
|
MB = $19.44
|
 Most Recent Note - 12/8/2010 6:05:29 PM
G - Small gain today on light volume, still quietly consolidating above its 50 DMA line. Perched -5.7% off its 52-week high with volume totals cooling after enduring distributional pressure last week. It made a stand near an upward trendline connecting May - November lows previously noted as support to watch.
>>> The latest Featured Stock Update with an annotated graph appeared on 10/26/2010. Click here.
View all notes |
Alert me of new notes |
CANSLIM.net Company Profile |
SEC |
Zacks Reports |
StockTalk |
News |
Chart |
Request a new note
C
A N
S L
I M
|
BIDU
-
NASDAQ
Baidu Inc Ads
INTERNET - Internet Information Providers
|
$108.07
|
-1.61
-1.47% |
$110.15
|
5,767,628
48.96% of 50 DAV
50 DAV is 11,780,500
|
$115.04
-6.06%
|
9/17/2010
|
$85.73
|
PP = $88.42
|
|
MB = $92.84
|
Most Recent Note - 12/3/2010 5:37:04 PM
G - Rallied today with light volume after testing important support at its 50 DMA line. Any damaging violation of its short-term average or recent chart low ($103.11 on 11/16/10) would raise greater concerns and trigger technical sell signals. BIDU has been noted as a riskier "late stage" candidate, yet could produce more climactic gains.
>>> The latest Featured Stock Update with an annotated graph appeared on 11/30/2010. Click here.
View all notes |
Alert me of new notes |
CANSLIM.net Company Profile |
SEC |
Zacks Reports |
StockTalk |
News |
Chart |
Request a new note
C
A N
S L
I M
|
CACC
-
NASDAQ
Credit Acceptance Corp
FINANCIAL SERVICES - Credit Services
|
$61.52
|
-0.27
-0.44% |
$61.80
|
14,594
60.06% of 50 DAV
50 DAV is 24,300
|
$63.45
-3.04%
|
11/22/2010
|
$59.97
|
PP = $62.00
|
|
MB = $65.10
|
Most Recent Note - 12/6/2010 5:09:44 PM
Y - Hovering only -2.3% off its 52-week high. Its 11/29/10 gain with +69% above average volume helped it rally above the pivot point of a "double bottom" type base pattern, meeting the guidelines for a new (or add-on) technical buy signal. Additional volume-driven gains into new high territory would be a reassuring sign.
>>> The latest Featured Stock Update with an annotated graph appeared on 10/29/2010. Click here.
View all notes |
Alert me of new notes |
CANSLIM.net Company Profile |
SEC |
Zacks Reports |
StockTalk |
News |
Chart |
Request a new note
C
A N
S L
I M
|
CIS
-
NYSE
Camelot Info Systems Ads
COMPUTER SOFTWARE andamp; SERVICES - Information Technology Service
|
$19.92
|
-1.03
-4.92% |
$21.20
|
338,977
110.49% of 50 DAV
50 DAV is 306,800
|
$24.89
-19.97%
|
11/26/2010
|
$18.93
|
PP = $19.72
|
|
MB = $20.71
|
Most Recent Note - 12/8/2010 4:55:04 PM
G - Closed near the session low today with a loss on average volume. After a couple of damaging distribution days it has slumped near prior highs in the $19.50 area that define chart support to watch.
>>> The latest Featured Stock Update with an annotated graph appeared on 11/26/2010. Click here.
View all notes |
Alert me of new notes |
CANSLIM.net Company Profile |
SEC |
Zacks Reports |
StockTalk |
News |
Chart |
Request a new note
C
A N
S L
I M
|
Symbol/Exchange
Company Name
Industry Group |
PRICE |
CHANGE
(%Change) |
Day High |
Volume
(% DAV)
(% 50 day avg vol) |
52 Wk Hi
% From Hi |
Featured
Date |
Price
Featured |
Pivot Featured |
|
Max Buy |
CMG
-
NYSE
Chipotle Mexican Grill
LEISURE - Restaurants
|
$236.17
|
-5.37
-2.22% |
$242.79
|
828,595
80.65% of 50 DAV
50 DAV is 1,027,400
|
$262.78
-10.12%
|
9/1/2010
|
$158.31
|
PP = $155.52
|
|
MB = $163.30
|
Most Recent Note - 12/8/2010 5:56:33 PM
G - Down today on lighter volume following recent damaging distributional losses with above average volume. It was repeatedly noted as -"Extended from any sound base pattern." Its 50 DMA line (now $213.45) defines the nearest chart support level.
>>> The latest Featured Stock Update with an annotated graph appeared on 10/28/2010. Click here.
View all notes |
Alert me of new notes |
CANSLIM.net Company Profile |
SEC |
Zacks Reports |
StockTalk |
News |
Chart |
Request a new note
C
A N
S L
I M
|
DECK
-
NASDAQ
Deckers Outdoor Corp
CONSUMER NON-DURABLES - Textile - Apparel Footwear
|
$79.40
|
-1.43
-1.77% |
$81.71
|
3,176,529
191.06% of 50 DAV
50 DAV is 1,662,600
|
$85.00
-6.59%
|
10/27/2010
|
$54.16
|
PP = $54.86
|
|
MB = $57.60
|
Most Recent Note - 12/8/2010 5:58:37 PM
G -Down today for another loss with above average volume after a negative reversal at an all-time high. It has been noted as very extended from any sound base, while its 50 DMA line defines the nearest chart support.
>>> The latest Featured Stock Update with an annotated graph appeared on 10/27/2010. Click here.
View all notes |
Alert me of new notes |
CANSLIM.net Company Profile |
SEC |
Zacks Reports |
StockTalk |
News |
Chart |
Request a new note
C
A N
S L
I M
|
EZCH
-
NASDAQ
Ezchip Semiconductor Ltd
ELECTRONICS - Semiconductor - Specialized
|
$28.79
|
-0.11
-0.38% |
$28.89
|
279,101
102.09% of 50 DAV
50 DAV is 273,400
|
$29.65
-2.90%
|
12/2/2010
|
$27.53
|
PP = $26.00
|
|
MB = $27.30
|
Most Recent Note - 12/8/2010 6:00:03 PM
G - Holding its ground stubbornly after considerable gains with above average volume. It is extended from the previously noted orderly "double bottom" type base. Color code was changed to green, and prior chart highs in the $26 area define an important technical support level to watch.
>>> The latest Featured Stock Update with an annotated graph appeared on 12/2/2010. Click here.
View all notes |
Alert me of new notes |
CANSLIM.net Company Profile |
SEC |
Zacks Reports |
StockTalk |
News |
Chart |
Request a new note
C
A N
S L
I M
|
EZPW
-
NASDAQ
Ezcorp Inc Cl A
SPECIALTY RETAIL - Specialty Retail, Other
|
$27.53
|
+0.73
2.72% |
$27.85
|
450,830
138.12% of 50 DAV
50 DAV is 326,400
|
$27.67
-0.51%
|
11/5/2010
|
$24.02
|
PP = $23.85
|
|
MB = $25.04
|
Most Recent Note - 12/8/2010 6:01:40 PM
G - Gain today with above average volume for a new all-time high. Extended from a sound base pattern, its prior highs in the $22-23 area define chart support to watch coinciding with its 50 DMA line.
>>> The latest Featured Stock Update with an annotated graph appeared on 11/6/2010. Click here.
View all notes |
Alert me of new notes |
CANSLIM.net Company Profile |
SEC |
Zacks Reports |
StockTalk |
News |
Chart |
Request a new note
C
A N
S L
I M
|
FFIV
-
NASDAQ
F 5 Networks Inc
INTERNET - Internet Software and Services
|
$137.17
|
-0.44
-0.32% |
$139.13
|
1,914,347
65.35% of 50 DAV
50 DAV is 2,929,500
|
$143.00
-4.08%
|
6/16/2010
|
$74.50
|
PP = $74.10
|
|
MB = $77.81
|
Most Recent Note - 12/3/2010 4:58:10 PM
G - Light volume gain today for another new all-time high. Extended from any sound base pattern. Prior highs in the $112 area define initial chart support.
>>> The latest Featured Stock Update with an annotated graph appeared on 11/15/2010. Click here.
View all notes |
Alert me of new notes |
CANSLIM.net Company Profile |
SEC |
Zacks Reports |
StockTalk |
News |
Chart |
Request a new note
C
A N
S L
I M
|
Symbol/Exchange
Company Name
Industry Group |
PRICE |
CHANGE
(%Change) |
Day High |
Volume
(% DAV)
(% 50 day avg vol) |
52 Wk Hi
% From Hi |
Featured
Date |
Price
Featured |
Pivot Featured |
|
Max Buy |
FOSL
-
NASDAQ
Fossil Inc
CONSUMER DURABLES - Recreational Goods, Other
|
$72.21
|
-0.34
-0.47% |
$74.21
|
566,434
66.65% of 50 DAV
50 DAV is 849,800
|
$74.34
-2.87%
|
11/26/2010
|
$69.10
|
PP = $70.17
|
|
MB = $73.68
|
Most Recent Note - 12/3/2010 5:07:18 PM
Y - Held its ground today. It rallied to a new all-time high above its pivot point with volume +147% above average behind its considerable 12/02/10 gain, triggering a technical buy signal after an advanced "3-weeks tight" pattern.
>>> The latest Featured Stock Update with an annotated graph appeared on 11/29/2010. Click here.
View all notes |
Alert me of new notes |
CANSLIM.net Company Profile |
SEC |
Zacks Reports |
StockTalk |
News |
Chart |
Request a new note
C
A N
S L
I M
|
HMSY
-
NASDAQ
H M S Holdings Corp
COMPUTER SOFTWARE and SERVICES - Healthcare Information Service
|
$66.50
|
+0.26
0.39% |
$67.00
|
112,361
55.96% of 50 DAV
50 DAV is 200,800
|
$66.61
-0.17%
|
11/19/2010
|
$61.89
|
PP = $63.01
|
|
MB = $66.16
|
Most Recent Note - 12/7/2010 5:50:36 PM
G - Volume total was light behind today's 5th consecutive gain as it traded above its "max buy" level for another new 52-week high. Color code is changed to green after getting extended from a sound base. Volume did not meet the guideline to trigger a proper new (or add-on) technical buy signal. Prior highs near $62 define initial support to watch above its 50 DMA line.
>>> The latest Featured Stock Update with an annotated graph appeared on 11/19/2010. Click here.
View all notes |
Alert me of new notes |
CANSLIM.net Company Profile |
SEC |
Zacks Reports |
StockTalk |
News |
Chart |
Request a new note
C
A N
S L
I M
|
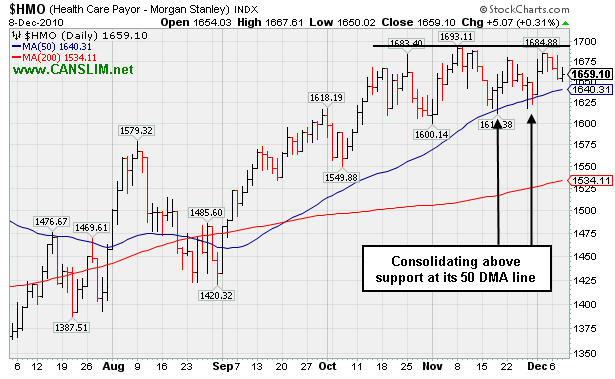
HS
-
NYSE
Healthspring Inc
HEALTH SERVICES - Health Care Plans
|
$28.76
|
+0.02
0.07% |
$29.02
|
320,219
54.80% of 50 DAV
50 DAV is 584,300
|
$29.80
-3.49%
|
8/27/2010
|
$19.91
|
PP = $19.75
|
|
MB = $20.74
|
Most Recent Note - 12/3/2010 5:55:25 PM
G - Finished at its second-best close ever today after gains with light volume this week helped it rally from support at its 50 DMA line. It tested that important short-term average for the first time since August, meanwhile any more damaging losses would raise concerns and trigger a technical sell signal.
>>> The latest Featured Stock Update with an annotated graph appeared on 10/22/2010. Click here.
View all notes |
Alert me of new notes |
CANSLIM.net Company Profile |
SEC |
Zacks Reports |
StockTalk |
News |
Chart |
Request a new note
C
A N
S L
I M
|
JOBS
-
NASDAQ
Fifty One Job Inc Ads
DIVERSIFIED SERVICES - Staffing and; Outsourcing Service
|
$53.03
|
+1.03
1.98% |
$53.11
|
192,119
103.29% of 50 DAV
50 DAV is 186,000
|
$52.99
0.08%
|
10/13/2010
|
$42.07
|
PP = $40.60
|
|
MB = $42.63
|
Most Recent Note - 12/8/2010 6:06:52 PM
G - Gain with average volume today for a new high close. It is extended from a sound base, and its 50 DMA line defines important support to watch.
>>> The latest Featured Stock Update with an annotated graph appeared on 11/16/2010. Click here.
View all notes |
Alert me of new notes |
CANSLIM.net Company Profile |
SEC |
Zacks Reports |
StockTalk |
News |
Chart |
Request a new note
C
A N
S L
I M
|
LULU
-
NASDAQ
Lululemon Athletica
MANUFACTURING - Textile Manufacturing
|
$55.70
|
+0.77
1.40% |
$55.70
|
2,672,855
239.80% of 50 DAV
50 DAV is 1,114,600
|
$56.12
-0.75%
|
10/8/2010
|
$47.66
|
PP = $46.67
|
|
MB = $49.00
|
Most Recent Note - 12/8/2010 12:51:57 PM
G - It faces no resistance but is extended from a sound base, perched at its 52-week high. Prior highs in the $46-48 area define chart support to watch along with its 50 DMA line.
>>> The latest Featured Stock Update with an annotated graph appeared on 12/1/2010. Click here.
View all notes |
Alert me of new notes |
CANSLIM.net Company Profile |
SEC |
Zacks Reports |
StockTalk |
News |
Chart |
Request a new note
C
A N
S L
I M
|
Symbol/Exchange
Company Name
Industry Group |
PRICE |
CHANGE
(%Change) |
Day High |
Volume
(% DAV)
(% 50 day avg vol) |
52 Wk Hi
% From Hi |
Featured
Date |
Price
Featured |
Pivot Featured |
|
Max Buy |
MWIV
-
NASDAQ
M W I Veterinary Supply
HEALTH SERVICES - Medical Instruments and; Supplies
|
$61.20
|
-0.98
-1.58% |
$62.42
|
57,908
106.25% of 50 DAV
50 DAV is 54,500
|
$63.94
-4.29%
|
11/4/2010
|
$61.79
|
PP = $59.60
|
|
MB = $62.58
|
Most Recent Note - 12/7/2010 5:42:27 PM
Y - Consolidating above its 50 DMA line, perched -3.1% off its 52-week high today with volume totals drying up since hitting its all-time high on 11/04/10. Its short-term average and an upward trendline connecting its May - August lows define chart support levels to watch.
>>> The latest Featured Stock Update with an annotated graph appeared on 11/2/2010. Click here.
View all notes |
Alert me of new notes |
CANSLIM.net Company Profile |
SEC |
Zacks Reports |
StockTalk |
News |
Chart |
Request a new note
C
A N
S L
I M
|
NEOG
-
NASDAQ
Neogen Corp
DRUGS - Diagnostic Substances
|
$38.81
|
+0.16
0.41% |
$38.89
|
85,807
114.41% of 50 DAV
50 DAV is 75,000
|
$38.97
-0.41%
|
9/1/2010
|
$30.79
|
PP = $30.49
|
|
MB = $32.01
|
Most Recent Note - 12/7/2010 5:44:49 PM
G - Gain today with average volume for a new high close. Extended from any sound base after steadily advancing. Its 50 DMA line has been a reliable support level.
>>> The latest Featured Stock Update with an annotated graph appeared on 12/6/2010. Click here.
View all notes |
Alert me of new notes |
CANSLIM.net Company Profile |
SEC |
Zacks Reports |
StockTalk |
News |
Chart |
Request a new note
C
A N
S L
I M
|
NFLX
-
NASDAQ
Netflix Inc
SPECIALTY RETAIL - Music and Video Stores
|
$188.23
|
-1.58
-0.83% |
$188.48
|
10,480,714
176.06% of 50 DAV
50 DAV is 5,953,000
|
$206.80
-8.98%
|
11/9/2010
|
$173.10
|
PP = $184.84
|
|
MB = $194.08
|
Most Recent Note - 12/8/2010 6:35:21 PM
G - Gapped down today for another loss with above average volume following another negative reversal. It is extended from a sound base, while an upward trendline connecting its July - November lows defines initial support to watch above its 50 DMA line.
>>> The latest Featured Stock Update with an annotated graph appeared on 11/24/2010. Click here.
View all notes |
Alert me of new notes |
CANSLIM.net Company Profile |
SEC |
Zacks Reports |
StockTalk |
News |
Chart |
Request a new note
C
A N
S L
I M
|
NTAP
-
NASDAQ
Netapp Inc
COMPUTER HARDWARE - Data Storage Devices
|
$55.13
|
+1.50
2.80% |
$55.20
|
6,075,086
87.51% of 50 DAV
50 DAV is 6,941,800
|
$57.96
-4.88%
|
9/8/2010
|
$46.98
|
PP = $44.99
|
|
MB = $47.24
|
Most Recent Note - 12/8/2010 6:03:16 PM
G - Closed near the session high with a gain on light volume today, still consolidating above its 50 DMA line. It is not near a sound base pattern, but last week's gains above its short-term average improved its technical stance.
>>> The latest Featured Stock Update with an annotated graph appeared on 11/3/2010. Click here.
View all notes |
Alert me of new notes |
CANSLIM.net Company Profile |
SEC |
Zacks Reports |
StockTalk |
News |
Chart |
Request a new note
C
A N
S L
I M
|
ORCL
-
NASDAQ
Oracle Corp
COMPUTER SOFTWARE and SERVICES - Application Software
|
$29.23
|
+0.18
0.62% |
$29.37
|
14,873,710
45.28% of 50 DAV
50 DAV is 32,850,900
|
$29.82
-1.98%
|
12/7/2010
|
$29.05
|
PP = $29.92
|
|
MB = $31.42
|
Most Recent Note - 12/7/2010 5:58:52 PM
Y - Gapped up today rallying above its old "max buy" level. After consolidating in an orderly fashion and finding support above prior highs, a new pivot point is being cited based upon its 52-week high plus ten cents. A subsequent breakout with great volume conviction may trigger a new (or add-on) buy signal.
>>> The latest Featured Stock Update with an annotated graph appeared on 11/18/2010. Click here.
View all notes |
Alert me of new notes |
CANSLIM.net Company Profile |
SEC |
Zacks Reports |
StockTalk |
News |
Chart |
Request a new note
C
A N
S L
I M
|
Symbol/Exchange
Company Name
Industry Group |
PRICE |
CHANGE
(%Change) |
Day High |
Volume
(% DAV)
(% 50 day avg vol) |
52 Wk Hi
% From Hi |
Featured
Date |
Price
Featured |
Pivot Featured |
|
Max Buy |
PAY
-
NYSE
Verifone Systems Inc
COMPUTER HARDWARE - Transaction Automation Systems
|
$40.02
|
-0.35
-0.87% |
$40.59
|
1,421,454
95.44% of 50 DAV
50 DAV is 1,489,400
|
$40.59
-1.39%
|
11/29/2010
|
$33.96
|
PP = $36.04
|
|
MB = $37.84
|
Most Recent Note - 12/3/2010 5:31:31 PM
G - Gapped up today and rallied for a considerable gain and new 52-week high. Color code was changed to green. Noted on 12/02/10 - "Rallied above the new pivot point cited. Its considerable gain on more than than 2 times average volume triggered a technical buy signal while rising from a previously noted advanced 'ascending base' pattern."
>>> The latest Featured Stock Update with an annotated graph appeared on 10/25/2010. Click here.
View all notes |
Alert me of new notes |
CANSLIM.net Company Profile |
SEC |
Zacks Reports |
StockTalk |
News |
Chart |
Request a new note
C
A N
S L
I M
|
RAX
-
NYSE
Rackspace Hosting Inc
INTERNET - Internet Software and; Services
|
$30.23
|
+0.08
0.27% |
$31.42
|
1,290,017
50.75% of 50 DAV
50 DAV is 2,542,000
|
$31.42
-3.79%
|
9/21/2010
|
$22.84
|
PP = $23.61
|
|
MB = $24.79
|
Most Recent Note - 12/3/2010 5:56:46 PM
G - Small gain on light volume today for a best-ever close. Volume totals have been below average in recent weeks. No resistance remains due to overhead supply, but it is extended from any sound base.
>>> The latest Featured Stock Update with an annotated graph appeared on 11/17/2010. Click here.
View all notes |
Alert me of new notes |
CANSLIM.net Company Profile |
SEC |
Zacks Reports |
StockTalk |
News |
Chart |
Request a new note
C
A N
S L
I M
|
ROVI
-
NASDAQ
Rovi Corp
COMPUTER SOFTWARE andamp; SERVICES - Security Software andamp; Services
|
$57.32
|
+0.99
1.76% |
$56.79
|
1,230,425
98.31% of 50 DAV
50 DAV is 1,251,600
|
$56.79
0.93%
|
10/29/2010
|
$49.99
|
PP = $53.10
|
|
MB = $55.76
|
Most Recent Note - 12/8/2010 6:30:16 PM
G - Posted a 4th consecutive gain today with average volume for another new 52-week high. Color code was changed to green after getting extended from its latest base without enough volume behind gains in recent weeks to trigger a proper new (or add-on) technical buy signal. Meanwhile, its 50 DMA line defines important support to watch.
>>> The latest Featured Stock Update with an annotated graph appeared on 10/20/2010. Click here.
View all notes |
Alert me of new notes |
CANSLIM.net Company Profile |
SEC |
Zacks Reports |
StockTalk |
News |
Chart |
Request a new note
C
A N
S L
I M
|
SHOO
-
NASDAQ
Steven Madden Limited
CONSUMER NON-DURABLES - Textile - Apparel Footwear
|
$47.32
|
-0.04
-0.08% |
$47.44
|
516,500
138.25% of 50 DAV
50 DAV is 373,600
|
$47.44
-0.25%
|
11/23/2010
|
$44.61
|
PP = $44.95
|
|
MB = $47.20
|
Most Recent Note - 12/7/2010 5:37:19 PM
G - Solid gain today with +90% above average volume lifted it to a close above its "max buy" level. Color code is changed to green. Prior highs in the $44 area define initial support to watch on pullbacks.
>>> The latest Featured Stock Update with an annotated graph appeared on 11/23/2010. Click here.
View all notes |
Alert me of new notes |
CANSLIM.net Company Profile |
SEC |
Zacks Reports |
StockTalk |
News |
Chart |
Request a new note
C
A N
S L
I M
|
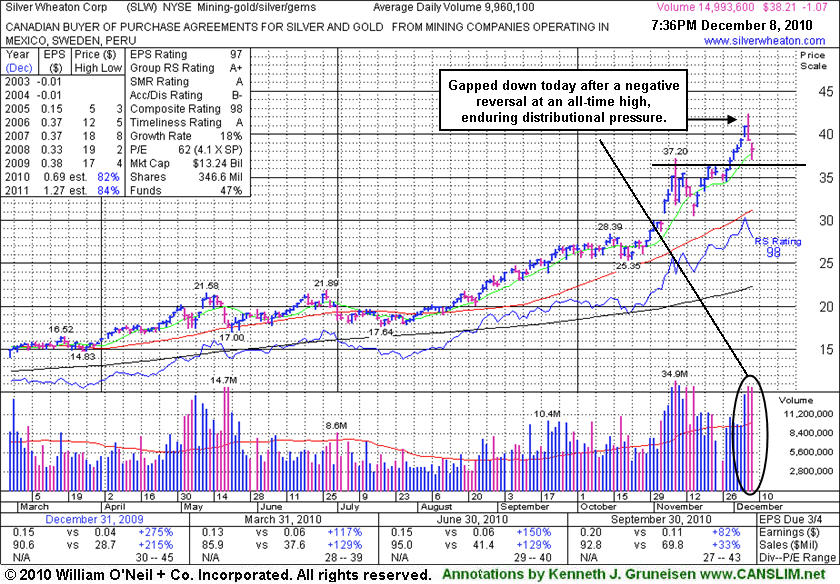
SLW
-
NYSE
Silver Wheaton Corp
METALS and; MINING - Silver
|
$38.21
|
-1.07
-2.72% |
$42.34
|
15,032,155
150.92% of 50 DAV
50 DAV is 9,960,100
|
$42.34
-9.75%
|
8/25/2010
|
$21.40
|
PP = $21.99
|
|
MB = $23.09
|
Most Recent Note - 12/8/2010 5:40:36 PM
G - Gapped down today following a negative reversal on the prior session after reaching an all-time high and capping a streak of 6 consecutive gains. Extended from any sound base, its prior chart highs in the $36-37 area define initial support well above its 50 DMA line.
>>> The latest Featured Stock Update with an annotated graph appeared on 12/8/2010. Click here.
View all notes |
Alert me of new notes |
CANSLIM.net Company Profile |
SEC |
Zacks Reports |
StockTalk |
News |
Chart |
Request a new note
C
A N
S L
I M
|
Symbol/Exchange
Company Name
Industry Group |
PRICE |
CHANGE
(%Change) |
Day High |
Volume
(% DAV)
(% 50 day avg vol) |
52 Wk Hi
% From Hi |
Featured
Date |
Price
Featured |
Pivot Featured |
|
Max Buy |
UA
-
NYSE
Under Armour Inc Cl A
CONSUMER NON-DURABLES - Textile - Apparel Clothing
|
$58.69
|
-0.03
-0.05% |
$60.12
|
268,578
38.09% of 50 DAV
50 DAV is 705,100
|
$60.12
-2.38%
|
9/9/2010
|
$39.99
|
PP = $40.10
|
|
MB = $42.11
|
Most Recent Note - 12/6/2010 5:17:19 PM
G - Hit yet another new 52-week high today with a small gain on light volume. The high-ranked Apparel - Clothing firm is very extended from any sound base and well above support at its 50 DMA line.
>>> The latest Featured Stock Update with an annotated graph appeared on 11/4/2010. Click here.
View all notes |
Alert me of new notes |
CANSLIM.net Company Profile |
SEC |
Zacks Reports |
StockTalk |
News |
Chart |
Request a new note
C
A N
S L
I M
|
ULTA
-
NASDAQ
Ulta Salon Cosm & Frag
SPECIALTY RETAIL - Specialty Retail, Other
|
$34.41
|
+0.55
1.62% |
$34.92
|
636,699
123.42% of 50 DAV
50 DAV is 515,900
|
$37.24
-7.60%
|
9/3/2010
|
$26.36
|
PP = $25.89
|
|
MB = $27.18
|
Most Recent Note - 12/6/2010 2:49:08 PM
G - Enduring distributional pressure following a negative reversal on 12/02/10 after hitting an all-time high. It is extended from any recent base, meanwhile, its 50 DMA line defines initial support to watch.
>>> The latest Featured Stock Update with an annotated graph appeared on 11/1/2010. Click here.
View all notes |
Alert me of new notes |
CANSLIM.net Company Profile |
SEC |
Zacks Reports |
StockTalk |
News |
Chart |
Request a new note
C
A N
S L
I M
|
VIT
-
NYSE
Vanceinfo Tech Inc Ads
COMPUTER SOFTWARE and SERVICES - Business Software and Services
|
$36.12
|
-0.30
-0.82% |
$39.67
|
1,382,062
216.12% of 50 DAV
50 DAV is 639,500
|
$41.06
-12.03%
|
7/8/2010
|
$25.20
|
PP = $26.58
|
|
MB = $27.91
|
Most Recent Note - 12/8/2010 6:38:49 PM
G - Down again today, testing support at its 50 DMA line with above average volume behind a 4th consecutive loss after its negative reversal an all-time high. Completed a Public Offering on 11/23/10, and it has not formed a sound base.
>>> The latest Featured Stock Update with an annotated graph appeared on 10/21/2010. Click here.
View all notes |
Alert me of new notes |
CANSLIM.net Company Profile |
SEC |
Zacks Reports |
StockTalk |
News |
Chart |
Request a new note
C
A N
S L
I M
|