You are not logged in.
This means you
CAN ONLY VIEW reports that were published prior to Monday, April 14, 2025.
You
MUST UPGRADE YOUR MEMBERSHIP if you want to see any current reports.
AFTER MARKET UPDATE - TUESDAY, DECEMBER 8TH, 2009
Previous After Market Report Next After Market Report >>>
|
|
|
|
DOW |
-104.14 |
10,285.97 |
-1.00% |
|
Volume |
1,178,146,290 |
+11% |
|
Volume |
2,058,789,160 |
+7% |
|
NASDAQ |
-16.62 |
2,172.99 |
-0.76% |
|
Advancers |
914 |
29% |
|
Advancers |
878 |
31% |
|
S&P 500 |
-11.31 |
1,091.94 |
-1.03% |
|
Decliners |
2,072 |
67% |
|
Decliners |
1,848 |
65% |
|
Russell 2000 |
-5.86 |
597.70 |
-0.97% |
|
52 Wk Highs |
128 |
|
|
52 Wk Highs |
62 |
|
|
S&P 600 |
-2.27 |
315.54 |
-0.71% |
|
52 Wk Lows |
8 |
|
|
52 Wk Lows |
15 |
|
|
 |
Major Averages Encounter Distributional Pressure
Adam Sarhan, Contributing Writer,
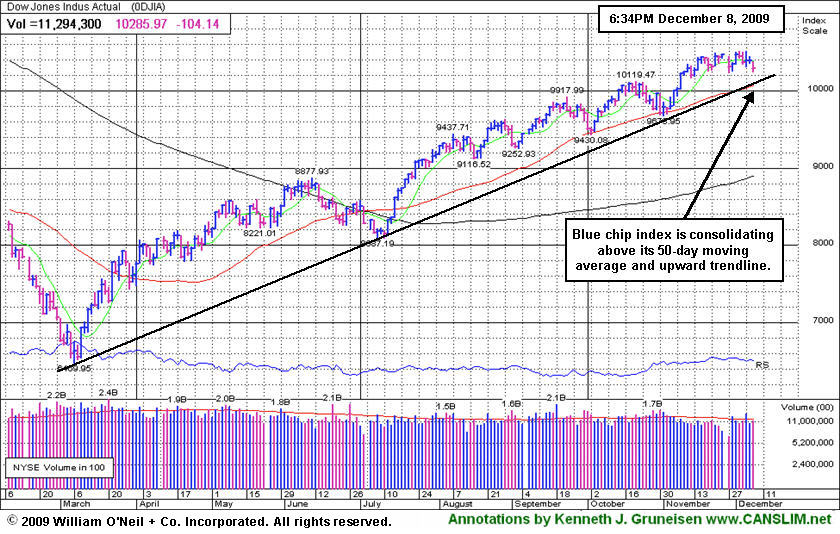
The major averages opened lower as the dollar strengthened for the fifth consecutive session. Some of Tuesday's headlines which led investors to question the ongoing recovery are: German industrial production unexpectedly fell, several credit-rating companies highlighted the risk of huge government deficits, and Dubai World's Nakheel PJSC said it lost $3.65 billion. Volume, an important indicator of institutional sponsorship, was higher than Monday's levels on both major exchanges, making it another distribution day for the major averages. Decliners led advancers by more than a 2-to-1 ratio on the NYSE and on the Nasdaq exchange. There were 18 high-ranked companies from the CANSLIM.net Leaders List that made a new 52-week high and appeared on the CANSLIM.net BreakOuts Page, less than the total of 29 issues that appeared on the prior session. New 52-week highs outnumbered new 52-week lows on the NYSE and on the Nasdaq exchange.
Downgrades: The major averages gapped down at the open after Fitch Ratings downgraded the nation's credit. Moody's Investors Service said deteriorating public finances in the US and U.K. may "test the Aaa boundaries." Fitch Ratings cut Greece down to a BBB+ rating on Tuesday which is the third-lowest investment grade. Meanwhile, Standard & Poor's put Greece's A- rating on watch for a possible downgrade. Moody's, another popular rating agency, said the US and UK have "resilient" Aaa ratings while Canada, Germany and France's ratings are "resistant."
Economic News: Overseas, Japan's government supported 7.2 trillion yen ($81 billion) stimulus package to help their economic recovery. In Europe, German industrial output slid -1.8% in October led by a drop in production of energy and investment goods. This was lower than the average estimate for a +1% percent gain, according a Bloomberg.com. Nakheel, the Dubai World-owned property developer seeking to renegotiate its debt, said that it had a first-half loss of 13.4 billion dirhams ($3.65 billion) due to lower revenue. A spokesman for Dubai World, Nakheel's parent, declined to comment on the write down. The weaker-than-expected economic news coupled with the multi-billion dollar loss from Nakheel sent the US dollar higher and a host of dollar denominated assets lower. Crude oil slid for a fifth consecutive day and gold continued falling from its all-time high of last Thursday.
PICTURED: The Dow Jones Industrial Average is consolidating above its 50-day moving average and an upward trendline. Any subsequent violations would raise concerns, meanwhile the current rally remains intact.
|
|
|
 |
Financial Groups Continue Sputtering
Kenneth J. Gruneisen - Passed the CAN SLIM® Master's Exam
Commodity-linked areas were Tuesday's worst laggards as the Gold & Silver Index ($XAU -3.83%) was a standout decliner followed by losses in the Oil Services Index ($OSX -2.48%) and Integrated Oil Index ($XOI -1.95%). Weakness weighing on the Broker/Dealer Index ($XBD -1.07%) and Retail Index ($RLX -0.82%) was also a negative influence on the major averages. The Internet Index ($IIX -0.75%) and Biotechnology Index ($BTK -0.64%) suffered modest losses while the Networking Index ($NWX -0.13%), Semiconductor Index ($SOX +0.07%), and Bank Index ($BKX -0.07%) were little changed. The Healthcare Index ($HMO +0.65%) was one defensive group that posted a modest gain.
Charts courtesy www.stockcharts.com
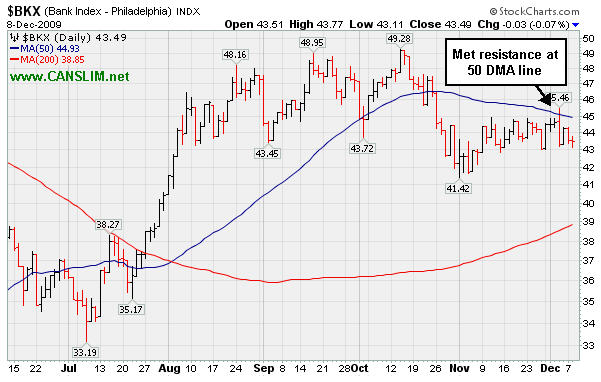
PICTURED 1: The Bank Index ($BKX -0.07%) recently encountered resistance at its 50-day moving average (DMA) line.
Charts courtesy www.stockcharts.com

PICTURED 2: The Broker/Dealer Index ($XBD -1.07%) has been slumping near recent low closes.
| Oil Services |
$OSX |
181.07 |
-4.61 |
-2.48% |
+49.16% |
| Healthcare |
$HMO |
1,372.59 |
+8.87 |
+0.65% |
+42.95% |
| Integrated Oil |
$XOI |
1,043.31 |
-20.70 |
-1.95% |
+6.49% |
| Semiconductor |
$SOX |
336.96 |
+0.24 |
+0.07% |
+58.82% |
| Networking |
$NWX |
228.66 |
-0.29 |
-0.13% |
+58.91% |
| Internet |
$IIX |
226.13 |
-1.72 |
-0.75% |
+69.04% |
| Broker/Dealer |
$XBD |
112.40 |
-1.21 |
-1.07% |
+45.09% |
| Retail |
$RLX |
404.08 |
-3.35 |
-0.82% |
+44.70% |
| Gold & Silver |
$XAU |
172.11 |
-6.86 |
-3.83% |
+38.97% |
| Bank |
$BKX |
43.49 |
-0.03 |
-0.07% |
-1.87% |
| Biotech |
$BTK |
904.82 |
-5.84 |
-0.64% |
+39.81% |
|
|
|
 |
Consolidation Above Support At 50 DMA Line And Upward Trendline
Kenneth J. Gruneisen - Passed the CAN SLIM® Master's Exam
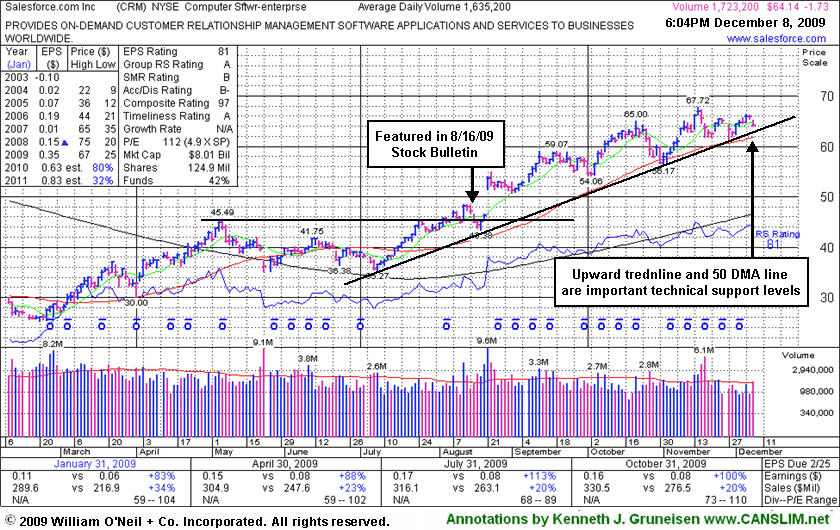
Salesforce.com, Inc. (CRM -$1.73 or -2.63% to $64.14) gapped down today for a small loss on average volume, still hovering just -5% from its 52 week high. It has been recently consolidating above important support at its 50-day moving average (DMA) line and an upward trendline. It still has not formed a sound new base, yet it has held its ground since recent distributional pressure raised concerns. It has not spent a lot of time basing since its big gap up in August. Patience may allow it to form a sound new base and offer disciplined investors another idea entry point. Meanwhile, its 50 DMA line and upward trendline connecting prior chart lows are initial chart support levels to watch. Violations could trigger technical sell signals and raise more serious concerns. Not long ago it found prompt support at its 50-day moving average (DMA) line then rallied to a new 52-week high.
|
|
|
Color Codes Explained :
Y - Better candidates highlighted by our
staff of experts.
G - Previously featured
in past reports as yellow but may no longer be buyable under the
guidelines.
***Last / Change / Volume quote data in this table corresponds with the timestamp on the note***
Symbol/Exchange
Company Name
Industry Group |
Last |
Chg. |
Vol
% DAV |
Date Featured |
Price Featured |
Latest Pivot Point
Featured |
Status |
| Latest Max Buy Price |
ARST
-
|
$23.41
|
-0.84
|
381,408
67% DAV
572,500
|
9/1/2009
(Date
Featured) |
$19.91
(Price
Featured) |
PP = $20.90 |
G |
| MB = $21.95 |
Most Recent Note - 12/8/2009 5:47:39 PM
G - Gapped down today for a loss on light volume, sinking back under its 50 DMA line toward recent lows. It proved resilient last week after recently noted technical sell signals. ARST was first featured in yellow at $19.91 in the 9/01/09 mid-day report with an annotated daily graph (read here).
>>> The latest Featured Stock Update with an annotated graph appeared on 12/3/2009. click here.
|
|
C
A
S
I |
News |
Chart |
SEC
View all notes Alert
me of new notes
Company
Profile
|
ASIA
-
|
$30.87
|
+0.16
|
2,519,306
200% DAV
1,257,600
|
10/14/2009
(Date
Featured) |
$23.05
(Price
Featured) |
PP = $22.19 |
G |
| MB = $23.30 |
Most Recent Note - 12/8/2009 5:48:01 PM
G - Held its ground today after a gap up for a considerable gain on 12/07/09 with almost 8 times average volume for a new 52-week high after announcing a merger with Linkage Technologies International Holdings Limited, leading providers of software solutions and IT services for the telecommunications industry in China. Featured 10/14/09 in the mid-day report (read here) as it gapped up for a new 52-week high with 5 times average volume, triggering a technical buy signal by blasting above its pivot point. First featured in the August 2009 CANSLIM.net News (read here).
>>> The latest Featured Stock Update with an annotated graph appeared on 12/7/2009. click here.
|
|
C
A
S
I |
News |
Chart |
SEC
View all notes Alert
me of new notes
Company
Profile
|
BIDU
- NASDAQ
Baidu Inc Ads
INTERNET - Internet Information Providers
|
$418.84
|
-2.16
|
1,083,392
51% DAV
2,111,800
|
9/8/2009
(Date
Featured) |
$351.80
(Price
Featured) |
PP = $368.59 |
G |
| MB = $387.02 |
Most Recent Note - 12/8/2009 5:51:15 PM
G - Today's loss was its 7th decline in 8 sessions, consolidating in a very tight trading range near all-time highs while its 50 DMA line has caught up. Since quietly rallying to new highs in November it has stalled, but not yet formed a new sound base. BIDU traded up as much as +23% from its price when featured in yellow in the 9/08/09 Mid-Day BreakOuts Report (read here).
>>> The latest Featured Stock Update with an annotated graph appeared on 11/25/2009. click here.
|
|
C
A
S
I |
News |
Chart |
SEC
View all notes Alert
me of new notes
Company
Profile
|
CAAS
- NASDAQ
China Automotive Systems
AUTOMOTIVE - Auto Parts
|
$20.62
|
+1.16
|
1,347,666
251% DAV
536,700
|
11/30/2009
(Date
Featured) |
$18.84
(Price
Featured) |
PP = $17.62 |
G |
| MB = $18.50 |
Most Recent Note - 12/8/2009 5:52:08 PM
G - Positively reversed after early weakness today and posted a solid gain with above average volume. It is extended from a sound base under the investment system rules. The Chinese maker of power steering systems was rising from an advanced "3-weeks tight" type of chart pattern as it showed up in yellow in the 11/30/09 mid-day report (read here). Recent quarters show accelerating sales revenues and earnings increases, and it has a good annual earnings history.
>>> The latest Featured Stock Update with an annotated graph appeared on 11/30/2009. click here.
|
|
C
A
S
I |
News |
Chart |
SEC
View all notes Alert
me of new notes
Company
Profile
|
CACC
- NASDAQ
Credit Acceptance Corp
FINANCIAL SERVICES - Credit Services
|
$34.07
|
-0.42
|
10,858
29% DAV
37,100
|
9/29/2009
(Date
Featured) |
$33.48
(Price
Featured) |
PP = $37.10 |
Y |
| MB = $38.96 |
Most Recent Note - 12/8/2009 5:54:36 PM
Y - Consolidating today for a small loss on light volume near its 50 DMA line, showing some resilience near that important short-term average line after encountering distributional pressure last week. After a near 8-week flat base it is continuing its consolidation above prior chart highs in the $32 area. The Finance - Consumer/Commercial Loans firm has maintained a great track record of annual and quarterly sales revenues and earnings increases. It was featured on 9/29/09 in yellow in the mid-day report (read here).
>>> The latest Featured Stock Update with an annotated graph appeared on 11/27/2009. click here.
|
|
C
A
S
I |
News |
Chart |
SEC
View all notes Alert
me of new notes
Company
Profile
|
CRM
- NYSE
Salesforce.com Inc
INTERNET - Internet Software & Services
|
$64.14
|
-1.73
|
1,735,539
106% DAV
1,635,200
|
8/16/2009
(Date
Featured) |
$47.12
(Price
Featured) |
PP = $45.59 |
G |
| MB = $47.87 |
Most Recent Note - 12/8/2009 5:56:22 PM
G - Gapped down today for a loss on average volume. Recently consolidating above important support at its 50 DMA line and just -5% from its 52 week high. It has not yet formed a sound new base, and recent distributional pressure raised concerns.
>>> The latest Featured Stock Update with an annotated graph appeared on 12/8/2009. click here.
|
|
C
A
S
I |
News |
Chart |
SEC
View all notes Alert
me of new notes
Company
Profile
|
CTRP
- NASDAQ
Ctrip.com Intl Ltd Adr
LEISURE - Resorts & Casinos
|
$74.88
|
-0.90
|
573,185
52% DAV
1,101,900
|
12/1/2009
(Date
Featured) |
$75.38
(Price
Featured) |
PP = $73.91 |
Y |
| MB = $77.61 |
Most Recent Note - 12/8/2009 5:59:40 PM
Y - Holding its ground near all-time highs today after encountering some distributional pressure last week when briefly trading above its "max buy" price of $77.60. Featured on 12/01/09 in yellow in the mid-day report (read here). It triggered a technical buy signal as it rose with more than +50% above average volume from a brief consolidation resembling a "high-tight-flag" pattern which it formed after repairing a late-October breach of its 50 DMA line. Fundamentally, its sales revenues and earnings increases have shown acceleration in the 3 most recent quarterly comparisons and rose above the +25% guideline. Based on weak technical action it was dropped from the Featured Stocks list on 6/10/08, when it closed at $49.84, yet it has rebounded very impressively from subsequent lows in the $16 area.
>>> The latest Featured Stock Update with an annotated graph appeared on 12/1/2009. click here.
|
|
C
A
S
I |
News |
Chart |
SEC
View all notes Alert
me of new notes
Company
Profile
|
HEAT
-
|
$14.81
|
-0.56
|
2,406,564
306% DAV
786,900
|
11/17/2009
(Date
Featured) |
$12.00
(Price
Featured) |
PP = $12.61 |
G |
| MB = $13.24 |
Most Recent Note - 12/8/2009 6:01:20 PM
G - Early gain today helped it touch new high territory, but it negatively reversed again and closed near the session low. The investment system rules say a stock should be held a minimum of 8 weeks after rising more than +20% in the first 2-3 weeks from being bought. HEAT found support near its pivot point during its recent consolidation, giving investors an opportunity to accumulate shares without chasing it and buying it "extended" from its latest base. First featured in yellow in the 11/17/09 mid-day report (read here) when technically rising from a "double bottom" base, reaching a new all-time high.
>>> The latest Featured Stock Update with an annotated graph appeared on 12/2/2009. click here.
|
|
C
A
S
I |
News |
Chart |
SEC
View all notes Alert
me of new notes
Company
Profile
|
LFT
-
|
$36.34
|
-0.77
|
297,741
65% DAV
455,100
|
11/17/2009
(Date
Featured) |
$31.77
(Price
Featured) |
PP = $33.04 |
G |
| MB = $34.69 |
Most Recent Note - 12/8/2009 6:01:58 PM
G - Small loss again today on light volume. Quietly perched near all-time highs, extended after recently rising from a choppy 14-week base. Prior chart highs in the $31 area are an initial support level to watch. A proposed offering of additional shares on 11/16/09 seems well received by the market. Its fundamentals remain strong.
>>> The latest Featured Stock Update with an annotated graph appeared on 12/4/2009. click here.
|
|
C
A
S
I |
News |
Chart |
SEC
View all notes Alert
me of new notes
Company
Profile
|
|
|
|
THESE ARE NOT BUY RECOMMENDATIONS!
Comments contained in the body of this report are technical
opinions only. The material herein has been obtained
from sources believed to be reliable and accurate, however,
its accuracy and completeness cannot be guaranteed.
This site is not an investment advisor, hence it does
not endorse or recommend any securities or other investments.
Any recommendation contained in this report may not
be suitable for all investors and it is not to be deemed
an offer or solicitation on our part with respect to
the purchase or sale of any securities. All trademarks,
service marks and trade names appearing in this report
are the property of their respective owners, and are
likewise used for identification purposes only.
This report is a service available
only to active Paid Premium Members.
You may opt-out of receiving report notifications
at any time. Questions or comments may be submitted
by writing to Premium Membership Services 665 S.E. 10 Street, Suite 201 Deerfield Beach, FL 33441-5634 or by calling 1-800-965-8307
or 954-785-1121.
|
|
|


