You are not logged in.
This means you
CAN ONLY VIEW reports that were published prior to Tuesday, April 15, 2025.
You
MUST UPGRADE YOUR MEMBERSHIP if you want to see any current reports.
AFTER MARKET UPDATE - MONDAY, DECEMBER 7TH, 2009
Previous After Market Report Next After Market Report >>>
|
|
|
|
DOW |
+1.21 |
10,390.11 |
+0.01% |
|
Volume |
1,059,007,080 |
-33% |
|
Volume |
1,918,614,350 |
-19% |
|
NASDAQ |
-4.74 |
2,189.61 |
-0.22% |
|
Advancers |
1,657 |
53% |
|
Advancers |
1,388 |
48% |
|
S&P 500 |
-2.73 |
1,103.25 |
-0.25% |
|
Decliners |
1,363 |
44% |
|
Decliners |
1,332 |
47% |
|
Russell 2000 |
+0.77 |
603.56 |
+0.13% |
|
52 Wk Highs |
222 |
|
|
52 Wk Highs |
100 |
|
|
S&P 600 |
+0.26 |
317.81 |
+0.08% |
|
52 Wk Lows |
3 |
|
|
52 Wk Lows |
9 |
|
|
 |
Major Averages End Mixed And Little Changed With Lighter Volume
Adam Sarhan, Contributing Writer,
The stock market ended mixed on Monday after trading in a very tight range for most of the session. Volume, an important indicator of institutional sponsorship, was lower than Friday's levels on both major exchanges which suggested large institutions were not aggressively selling stocks. Advancers led decliners by about a 8-to-7 ratio on the NYSE and were roughly even on the Nasdaq exchange. There were 29 high-ranked companies from the CANSLIM.net Leaders List that made a new 52-week high and appeared on the CANSLIM.net BreakOuts Page, less than the total of 45 issues that appeared on the prior session. Leadership among high-ranked growth stocks had dried up in recent weeks, so the expansion in new highs this week has been a welcome improvement. New 52-week highs solidly outnumbered new 52-week lows on the NYSE and on the Nasdaq exchange, and new lows were in the single digits on both exchanges.

Stocks vacillated between positive and negative territory as the dollar edged higher and a slew of commodities continued pulling back. The light volume day was considered normal after Friday's news-dominated session. Gold closed lower for the third straight day and has shed over 100 points since last Thursday's all-time high. In the early afternoon, Federal Reserve Chairman Ben Bernanke gave a speech at the Economic Club of Washington D.C. and said it was too early to determine the sustainability of this recovery. Bernanke also said that he sees modest economic growth in 2010 and does not believe inflation is a threat at this point. He also said that tight credit markets and a 10% unemployment rate could hinder future economic growth.
Last Friday's stronger than expected jobs report was bitter sweet. At face value the report is a net positive for the economy because it shows that employers may begin adding jobs in the near future. However, it also suggests that the Fed may begin raising rates as the economy improves. Currently, the Fed's overnight lending rate stands near a historical low of 0-.25% which is sharply lower than the +5.25% seen in early 2007 before the financial crisis began. That coupled with a weaker dollar has played a pivotal role in the robust 8-month rally. Bernanke reaffirmed the Fed's position that interest rates will likely remain low for an extended period of time but reiterated the importance of analyzing future economic data as it emerges.
Looking at the recent action in the market, the major averages continue acting well as they remain perched just below resistance (their respective 2009 highs) and above their respective 50-day moving average (DMA) lines. Both these factors are considered healthy and bodes well for this 8-month rally. The Nasdaq continues to experience formidable resistance just above 2,200 while the benchmark S&P 500 Index faces resistance just above 1,115. The blue chip Dow Jones Industrial Average remains the strongest of it peers and currently faces resistance just above 10,500. Until the major averages close above these levels, expect the bracketed (sideways) action to continue.
PICTURED: The Nasdaq Composite Index closed below resistance for the fourth consecutive session.
|
|
|
 |
Healthcare Index Consolidating After +104% Rally Off March Lows
Kenneth J. Gruneisen - Passed the CAN SLIM® Master's Exam
The financial group started the week sputtering again as the Bank Index ($BKX -1.63%) and Broker/Dealer Index ($XBD -1.52%) fell. The Gold & Silver Index ($XAU -1.64%) also created a drag and the Integrated Oil Index ($XOI -0.41%) closed with a small loss while the Oil Services Index ($OSX -0.01%) ended flat. The Retail Index ($RLX -0.02%) was virtually unchanged and the Internet Index ($IIX -0.06%) and Biotechnology Index ($BTK +0.13%) also showed little direction while the Networking Index ($NWX +0.37%) and Semiconductor Index ($SOX +0.45%) posted modest gains.
Charts courtesy www.stockcharts.com
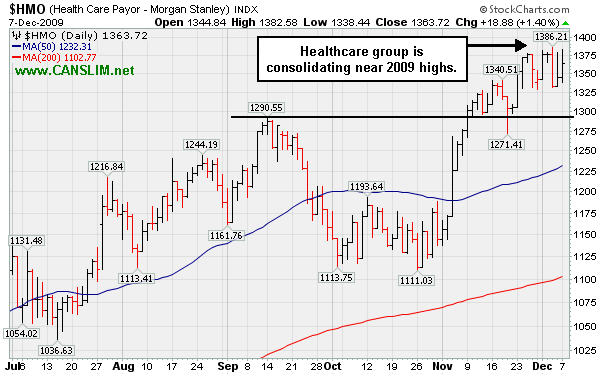
PICTURED: The Healthcare Index ($HMO +1.40%) was a standout gainer on Monday, while consolidating near 2009 highs.
| Oil Services |
$OSX |
185.68 |
-0.02 |
-0.01% |
+52.96% |
| Healthcare |
$HMO |
1,363.72 |
+18.88 |
+1.40% |
+42.03% |
| Integrated Oil |
$XOI |
1,064.01 |
-4.42 |
-0.41% |
+8.61% |
| Semiconductor |
$SOX |
336.72 |
+1.51 |
+0.45% |
+58.70% |
| Networking |
$NWX |
228.95 |
+0.85 |
+0.37% |
+59.11% |
| Internet |
$IIX |
227.85 |
-0.14 |
-0.06% |
+70.33% |
| Broker/Dealer |
$XBD |
113.61 |
-1.75 |
-1.52% |
+46.65% |
| Retail |
$RLX |
407.43 |
-0.09 |
-0.02% |
+45.90% |
| Gold & Silver |
$XAU |
178.97 |
-2.99 |
-1.64% |
+44.51% |
| Bank |
$BKX |
43.52 |
-0.72 |
-1.63% |
-1.81% |
| Biotech |
$BTK |
910.66 |
+1.21 |
+0.13% |
+40.71% |
|
|
|
 |
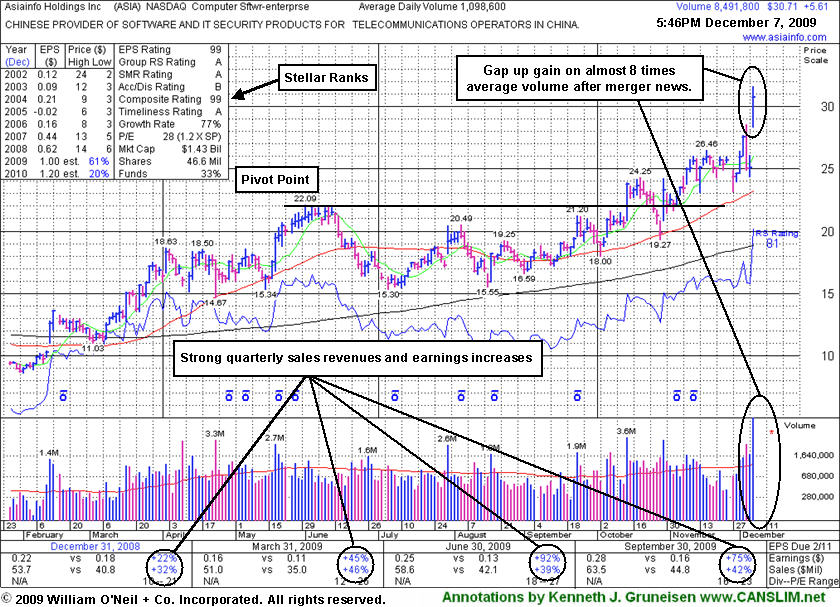
Considerable Gap Up Follows New Merger News
Kenneth J. Gruneisen - Passed the CAN SLIM® Master's Exam
AsiaInfo Holdings, Inc. (ASIA +$5.61 or +22.35% to $30.71) gapped up today for a considerable gain on almost 8 times average volume for a new 52-week high after announcing a merger with Linkage Technologies International Holdings Limited, leading providers of software solutions and IT services for the telecommunications industry in China. It is extended from its latest sound base now, and disciplined investors would avoid chasing it more than +5% above its pivot point.
Gains with above average volume helped it rally to new 2009 highs following a 10/29/09 gap up for a big gain after reporting solid earnings for the period ended Sept 30, 2009 that beat expectations as it also raised guidance. It found prompt support near its 50-day moving average (DMA) line, a textbook chart support level, after a 7 session losing streak with losses on high volume triggered technical sell signals and briefly negated its latest breakout.
ASIA was featured 10/14/09 in the mid-day report (read here) as it gapped up for a new 52-week high with 5 times average volume, triggering a technical buy signal by blasting above its pivot point. Disciplined entries and exits are critical to investors' success with the investment system. ASIA was first featured in the August 2009 CANSLIM.net News (read here).
|
|
|
Color Codes Explained :
Y - Better candidates highlighted by our
staff of experts.
G - Previously featured
in past reports as yellow but may no longer be buyable under the
guidelines.
***Last / Change / Volume quote data in this table corresponds with the timestamp on the note***
Symbol/Exchange
Company Name
Industry Group |
Last |
Chg. |
Vol
% DAV |
Date Featured |
Price Featured |
Latest Pivot Point
Featured |
Status |
| Latest Max Buy Price |
ARST
-
|
$24.25
|
-0.37
|
570,833
100% DAV
570,500
|
9/1/2009
(Date
Featured) |
$19.91
(Price
Featured) |
PP = $20.90 |
G |
| MB = $21.95 |
Most Recent Note - 12/7/2009 4:57:53 PM
G - Gave up an early gain today and reversed for a loss. Positively reversed on 12/04/09 after early weakness retested the week's lows following an analyst downgrade. Finding support and trading near its 50 DMA line, it proved resilient last week after recently noted technical sell signals. ARST was first featured in yellow at $19.91 in the 9/01/09 mid-day report with an annotated daily graph (read here).
>>> The latest Featured Stock Update with an annotated graph appeared on 12/3/2009. click here.
|
|
C
A
S
I |
News |
Chart |
SEC
View all notes Alert
me of new notes
Company
Profile
|
ASIA
-
|
$30.71
|
+5.61
|
8,495,610
773% DAV
1,098,600
|
10/14/2009
(Date
Featured) |
$23.05
(Price
Featured) |
PP = $22.19 |
G |
| MB = $23.30 |
Most Recent Note - 12/7/2009 4:59:00 PM
G - Gapped up for a considerable gain on almost 8 times average volume for a new 52-week high today after announcing a merger with Linkage Technologies International Holdings Limited, leading providers of software solutions and IT services for the telecommunications industry in China. Featured 10/14/09 in the mid-day report (read here) as it gapped up for a new 52-week high with 5 times average volume, triggering a technical buy signal by blasting above its pivot point. First featured in the August 2009 CANSLIM.net News (read here).
>>> The latest Featured Stock Update with an annotated graph appeared on 12/7/2009. click here.
|
|
C
A
S
I |
News |
Chart |
SEC
View all notes Alert
me of new notes
Company
Profile
|
BIDU
- NASDAQ
Baidu Inc Ads
INTERNET - Internet Information Providers
|
$421.00
|
-4.32
|
1,264,766
60% DAV
2,117,700
|
9/8/2009
(Date
Featured) |
$351.80
(Price
Featured) |
PP = $368.59 |
G |
| MB = $387.02 |
Most Recent Note - 12/7/2009 5:00:46 PM
G - Today's loss was its 6th decline in 7 sessions. Since quietly rallying to new highs in November it has stalled, but not yet formed a new sound base. It has been consolidating in a very tight trading range near all-time highs, and in the past it has proven resilient near its 50 DMA line. BIDU traded up as much as +23% from its price when featured in yellow in the 9/08/09 Mid-Day BreakOuts Report (read here).
>>> The latest Featured Stock Update with an annotated graph appeared on 11/25/2009. click here.
|
|
C
A
S
I |
News |
Chart |
SEC
View all notes Alert
me of new notes
Company
Profile
|
CAAS
- NASDAQ
China Automotive Systems
AUTOMOTIVE - Auto Parts
|
$19.46
|
-1.53
|
1,502,771
296% DAV
507,600
|
11/30/2009
(Date
Featured) |
$18.84
(Price
Featured) |
PP = $17.62 |
G |
| MB = $18.50 |
Most Recent Note - 12/7/2009 5:05:01 PM
G - Loss today on heavier volume following a negative reversal on 12/04/09. It is extended from a sound base under the investment system rules. The Chinese maker of power steering systems was rising from an advanced "3-weeks tight" type of chart pattern as it showed up in yellow in the 11/30/09 mid-day report (read here). Recent quarters show accelerating sales revenues and earnings increases, and it has a good annual earnings history.
>>> The latest Featured Stock Update with an annotated graph appeared on 11/30/2009. click here.
|
|
C
A
S
I |
News |
Chart |
SEC
View all notes Alert
me of new notes
Company
Profile
|
CACC
- NASDAQ
Credit Acceptance Corp
FINANCIAL SERVICES - Credit Services
|
$34.49
|
-0.03
|
29,621
80% DAV
37,200
|
9/29/2009
(Date
Featured) |
$33.48
(Price
Featured) |
PP = $37.10 |
Y |
| MB = $38.96 |
Most Recent Note - 12/7/2009 5:08:35 PM
Y - Consolidating near its 50 DMA line, showing some resilience near that important short-term average line after encountering distributional pressure last week. After a 7-week flat base it is continuing its consolidation above prior chart highs in the $32 area. The Finance - Consumer/Commercial Loans firm has maintained a great track record of annual and quarterly sales revenues and earnings increases. It was featured on 9/29/09 in yellow in the mid-day report (read here).
>>> The latest Featured Stock Update with an annotated graph appeared on 11/27/2009. click here.
|
|
C
A
S
I |
News |
Chart |
SEC
View all notes Alert
me of new notes
Company
Profile
|
CRM
- NYSE
Salesforce.com Inc
INTERNET - Internet Software & Services
|
$65.87
|
-0.08
|
913,873
55% DAV
1,652,100
|
8/16/2009
(Date
Featured) |
$47.12
(Price
Featured) |
PP = $45.59 |
G |
| MB = $47.87 |
Most Recent Note - 12/7/2009 5:10:11 PM
G - Quietly consolidating above important support at its 50 DMA line and less than -3% from its 52 week high. It has not yet formed a sound new base, and recent distributional pressure raised concerns.
>>> The latest Featured Stock Update with an annotated graph appeared on 11/23/2009. click here.
|
|
C
A
S
I |
News |
Chart |
SEC
View all notes Alert
me of new notes
Company
Profile
|
CTRP
- NASDAQ
Ctrip.com Intl Ltd Adr
LEISURE - Resorts & Casinos
|
$75.78
|
+0.52
|
662,358
60% DAV
1,099,700
|
12/1/2009
(Date
Featured) |
$75.38
(Price
Featured) |
PP = $73.91 |
Y |
| MB = $77.61 |
Most Recent Note - 12/7/2009 5:28:56 PM
Y - Holding its ground today after encountering some distributional pressure last week when briefly trading above its "max buy" price of $77.60. Featured on 12/01/09 in yellow in the mid-day report (read here). It triggered a technical buy signal as it rose with more than +50% above average volume from a brief consolidation resembling a "high-tight-flag" pattern which it formed after repairing a late-October breach of its 50 DMA line. Fundamentally, its sales revenues and earnings increases have shown acceleration in the 3 most recent quarterly comparisons and rose above the +25% guideline. Based on weak technical action it was dropped from the Featured Stocks list on 6/10/08, when it closed at $49.84, yet it has rebounded very impressively from subsequent lows in the $16 area.
>>> The latest Featured Stock Update with an annotated graph appeared on 12/1/2009. click here.
|
|
C
A
S
I |
News |
Chart |
SEC
View all notes Alert
me of new notes
Company
Profile
|
HEAT
-
|
$15.37
|
+1.26
|
1,423,427
184% DAV
771,800
|
11/17/2009
(Date
Featured) |
$12.00
(Price
Featured) |
PP = $12.61 |
G |
| MB = $13.24 |
Most Recent Note - 12/7/2009 5:34:23 PM
G - Considerable gain today on almost 2 times average volume for its second highest close ever. The investment system rules say a stock should be held a minimum of 8 weeks after rising more than +20% in the first 2-3 weeks from being bought. HEAT found support near its pivot point during its recent consolidation, giving investors an opportunity to accumulate shares without chasing it and buying it "extended" from its latest base. First featured in yellow in the 11/17/09 mid-day report (read here) when technically rising from a "double bottom" base, reaching a new all-time high.
>>> The latest Featured Stock Update with an annotated graph appeared on 12/2/2009. click here.
|
|
C
A
S
I |
News |
Chart |
SEC
View all notes Alert
me of new notes
Company
Profile
|
LFT
-
|
$37.11
|
-0.35
|
295,482
65% DAV
451,900
|
11/17/2009
(Date
Featured) |
$31.77
(Price
Featured) |
PP = $33.04 |
G |
| MB = $34.69 |
Most Recent Note - 12/7/2009 5:35:04 PM
G - Small loss today on light volume. Quietly perched near all-time highs, extended after recently rising from a choppy 14-week base. Prior chart highs in the $31 area are an initial support level to watch. A proposed offering of additional shares on 11/16/09 seems well received by the market. Its fundamentals remain strong.
>>> The latest Featured Stock Update with an annotated graph appeared on 12/4/2009. click here.
|
|
C
A
S
I |
News |
Chart |
SEC
View all notes Alert
me of new notes
Company
Profile
|
|
|
|
THESE ARE NOT BUY RECOMMENDATIONS!
Comments contained in the body of this report are technical
opinions only. The material herein has been obtained
from sources believed to be reliable and accurate, however,
its accuracy and completeness cannot be guaranteed.
This site is not an investment advisor, hence it does
not endorse or recommend any securities or other investments.
Any recommendation contained in this report may not
be suitable for all investors and it is not to be deemed
an offer or solicitation on our part with respect to
the purchase or sale of any securities. All trademarks,
service marks and trade names appearing in this report
are the property of their respective owners, and are
likewise used for identification purposes only.
This report is a service available
only to active Paid Premium Members.
You may opt-out of receiving report notifications
at any time. Questions or comments may be submitted
by writing to Premium Membership Services 665 S.E. 10 Street, Suite 201 Deerfield Beach, FL 33441-5634 or by calling 1-800-965-8307
or 954-785-1121.
|
|
|


