***Last / Change / Volume data in this table is the closing quote data***
Symbol/Exchange
Company Name
Industry Group |
PRICE |
CHANGE
(%Change) |
Day High |
Volume
(% DAV)
(% 50 day avg vol) |
52 Wk Hi
% From Hi |
Featured
Date |
Price
Featured |
Pivot Featured |
|
Max Buy |
ADS
-
NYSE
Alliance Data Sys Corp
COMPUTER SOFTWARE and SERVICES - Information and Delivery Service
|
$103.29
|
+0.22
0.21% |
$103.72
|
856,335
90.15% of 50 DAV
50 DAV is 949,900
|
$107.33
-3.76%
|
10/21/2011
|
$97.94
|
PP = $101.15
|
|
MB = $106.21
|
Most Recent Note - 12/6/2011 12:46:36 PM
Y - Small gap down today after touching a new all-time high on the prior session while capping a streak of 6 consecutive gains.
>>> The latest Featured Stock Update with an annotated graph appeared on 11/17/2011. Click here.
View all notes |
Alert me of new notes |
CANSLIM.net Company Profile |
SEC |
Zacks Reports |
StockTalk |
News |
Chart |
Request a new note
C
A N
S L
I M


|
ALXN
-
NASDAQ
Alexion Pharmaceuticals
DRUGS - Drug Manufacturers - Other
|
$64.45
|
-0.60
-0.92% |
$64.99
|
1,353,877
88.99% of 50 DAV
50 DAV is 1,521,300
|
$70.42
-8.48%
|
11/30/2011
|
$68.66
|
PP = $70.52
|
|
MB = $74.05
|
Most Recent Note - 12/5/2011 5:00:04 PM
G - Pulled back today with slightly above average volume and slumped below its 50 DMA line raising concerns so its color code is changed to green. A repair of its 50 DMA violation and volume-driven gains are needed to trigger a new (or add-on) technical buy signal.
>>> The latest Featured Stock Update with an annotated graph appeared on 11/14/2011. Click here.
View all notes |
Alert me of new notes |
CANSLIM.net Company Profile |
SEC |
Zacks Reports |
StockTalk |
News |
Chart |
Request a new note
C
A N
S L
I M
|
CELG
-
NASDAQ
Celgene Corp
DRUGS - Drug Manufacturers - Major
|
$62.65
|
+0.44
0.71% |
$62.99
|
2,448,182
63.73% of 50 DAV
50 DAV is 3,841,700
|
$68.25
-8.21%
|
9/16/2011
|
$61.21
|
PP = $62.59
|
|
MB = $65.72
|
Most Recent Note - 12/2/2011 7:56:45 PM
G - Slumped further below its 50 DMA line with a loss today on higher volume indicative of distributional pressure. Gains above its short-term average are needed for its outlook to improve. See the latest FSU analysis for more details and a new annotated graph.
>>> The latest Featured Stock Update with an annotated graph appeared on 12/1/2011. Click here.
View all notes |
Alert me of new notes |
CANSLIM.net Company Profile |
SEC |
Zacks Reports |
StockTalk |
News |
Chart |
Request a new note
C
A N
S L
I M
|
FEIC
-
NASDAQ
F E I Co
ELECTRONICS - Diversified Electronics
|
$41.41
|
+0.29
0.71% |
$41.50
|
198,357
45.40% of 50 DAV
50 DAV is 436,900
|
$42.25
-1.99%
|
12/7/2011
|
$41.41
|
PP = $42.35
|
|
MB = $44.47
|
 Most Recent Note - 12/7/2011 6:15:01 PM
Y - Finished near the session high today with a 3rd consecutive small gain on below average volume. Little resistance remains due to overhead supply. Color code is changed to yellow with new pivot point cited based on its 52-week high plus 10 cents.
>>> The latest Featured Stock Update with an annotated graph appeared on 11/25/2011. Click here.
View all notes |
Alert me of new notes |
CANSLIM.net Company Profile |
SEC |
Zacks Reports |
StockTalk |
News |
Chart |
Request a new note
C
A N
S L
I M
|
GNC
-
NYSE
G N C Holdings Inc
RETAIL - Drug Stores
|
$26.81
|
-0.21
-0.78% |
$27.02
|
651,912
50.76% of 50 DAV
50 DAV is 1,284,300
|
$28.50
-5.93%
|
10/26/2011
|
$24.60
|
PP = $24.80
|
|
MB = $26.04
|
Most Recent Note - 12/7/2011 6:17:25 PM
G - Finished near the session high today with a 3rd consecutive small loss on below average volume, finishing -5.9% off its all-time high. Prior chart highs in the $25-26 area define initial support to watch on pullbacks.
>>> The latest Featured Stock Update with an annotated graph appeared on 11/21/2011. Click here.
View all notes |
Alert me of new notes |
CANSLIM.net Company Profile |
SEC |
Zacks Reports |
StockTalk |
News |
Chart |
Request a new note
C
A N
S L
I M
|
Symbol/Exchange
Company Name
Industry Group |
PRICE |
CHANGE
(%Change) |
Day High |
Volume
(% DAV)
(% 50 day avg vol) |
52 Wk Hi
% From Hi |
Featured
Date |
Price
Featured |
Pivot Featured |
|
Max Buy |
HMSY
-
NASDAQ
H M S Holdings Corp
COMPUTER SOFTWARE and SERVICES - Healthcare Information Service
|
$30.95
|
+0.12
0.39% |
$31.00
|
537,727
79.24% of 50 DAV
50 DAV is 678,600
|
$31.99
-3.25%
|
10/27/2011
|
$26.44
|
PP = $28.37
|
|
MB = $29.79
|
Most Recent Note - 12/1/2011 6:51:08 PM
G - Pulled back today on light volume and finished near its "max buy" level. Prior highs in the $27-28 area acted as support during the recent pullback. See the latest FSU analysis for more details and a new annotated weekly graph.
>>> The latest Featured Stock Update with an annotated graph appeared on 11/30/2011. Click here.
View all notes |
Alert me of new notes |
CANSLIM.net Company Profile |
SEC |
Zacks Reports |
StockTalk |
News |
Chart |
Request a new note
C
A N
S L
I M
|
ISRG
-
NASDAQ
Intuitive Surgical Inc
HEALTH SERVICES - Medical Appliances and Equipment
|
$439.88
|
-0.07
-0.02% |
$441.54
|
240,590
58.30% of 50 DAV
50 DAV is 412,700
|
$449.06
-2.04%
|
10/19/2011
|
$424.69
|
PP = $415.29
|
|
MB = $436.05
|
Most Recent Note - 12/7/2011 6:40:21 PM
Y - Still perched within close striking distance of its all-time high. Found support recently well above its 50 DMA line near prior chart highs.
>>> The latest Featured Stock Update with an annotated graph appeared on 11/15/2011. Click here.
View all notes |
Alert me of new notes |
CANSLIM.net Company Profile |
SEC |
Zacks Reports |
StockTalk |
News |
Chart |
Request a new note
C
A N
S L
I M
|
MELI
-
NASDAQ
Mercadolibre Inc
INTERNET - Internet Software and; Services
|
$93.69
|
-0.93
-0.98% |
$94.97
|
893,136
134.23% of 50 DAV
50 DAV is 665,400
|
$95.48
-1.87%
|
12/5/2011
|
$91.08
|
PP = $92.83
|
|
MB = $97.47
|
Most Recent Note - 12/7/2011 12:19:37 PM
Y - Perched at its 52-week high today after 2 consecutive volume-driven gains, trading just above the new pivot point cited in the 12/05/11 mid-day report. Went through a deep consolidation below its 50 and 200 DMA lines since dropped from the Featured Stocks list on 6/13/11. Earnings history has remained strong, satisfying the C and A criteria. See the latest FSU analysis for more details and a new annotated graph.
>>> The latest Featured Stock Update with an annotated graph appeared on 12/5/2011. Click here.
View all notes |
Alert me of new notes |
CANSLIM.net Company Profile |
SEC |
Zacks Reports |
StockTalk |
News |
Chart |
Request a new note
C
A N
S L
I M
|
MG
-
NYSE
Mistras Group Inc
DIVERSIFIED SERVICES - Bulding and Faci;ity Management Services
|
$23.96
|
-0.44
-1.80% |
$24.31
|
73,715
35.59% of 50 DAV
50 DAV is 207,100
|
$25.28
-5.22%
|
10/28/2011
|
$22.49
|
PP = $23.61
|
|
MB = $24.79
|
Most Recent Note - 12/7/2011 11:32:24 AM
Y - Small gap down today, slumping back near its pivot point. A solid gain and strong close on 12/05/11 with +55% above average volume triggered a technical buy signal. Prior highs in the $23 area define initial chart support to watch.
>>> The latest Featured Stock Update with an annotated graph appeared on 11/11/2011. Click here.
View all notes |
Alert me of new notes |
CANSLIM.net Company Profile |
SEC |
Zacks Reports |
StockTalk |
News |
Chart |
Request a new note
C
A N
S L
I M
|
MKTX
-
NASDAQ
Marketaxess Holdings Inc
FINANCIAL SERVICES - Investment Brokerage - Nationa
|
$28.79
|
-0.46
-1.57% |
$29.23
|
393,881
162.69% of 50 DAV
50 DAV is 242,100
|
$31.45
-8.46%
|
10/28/2011
|
$29.79
|
PP = $31.05
|
|
MB = $32.60
|
Most Recent Note - 12/6/2011 12:43:07 PM
G - Rallying up from support at its 50 DMA line with a gain on higher volume today. It still faces previously stubborn resistance in the $31 area.
>>> The latest Featured Stock Update with an annotated graph appeared on 11/23/2011. Click here.
View all notes |
Alert me of new notes |
CANSLIM.net Company Profile |
SEC |
Zacks Reports |
StockTalk |
News |
Chart |
Request a new note
C
A N
S L
I M
|
Symbol/Exchange
Company Name
Industry Group |
PRICE |
CHANGE
(%Change) |
Day High |
Volume
(% DAV)
(% 50 day avg vol) |
52 Wk Hi
% From Hi |
Featured
Date |
Price
Featured |
Pivot Featured |
|
Max Buy |
OSIS
-
NASDAQ
O S I Systems Inc
ELECTRONICS - Semiconductor Equipment and Mate
|
$47.83
|
+0.18
0.38% |
$47.92
|
46,925
31.62% of 50 DAV
50 DAV is 148,400
|
$49.04
-2.47%
|
11/1/2011
|
$42.07
|
PP = $45.57
|
|
MB = $47.85
|
Most Recent Note - 12/1/2011 6:49:23 PM
Y - Pulled back today on lighter than average volume. Its gap gain with +44% above average volume on the prior session cleared its previously cited pivot point confirming a technical buy signal. The recent lows ($42.20 on 11/25/11) defines an important support level to watch. See the latest FSU analysis for more details and a new annotated graph.
>>> The latest Featured Stock Update with an annotated graph appeared on 11/28/2011. Click here.
View all notes |
Alert me of new notes |
CANSLIM.net Company Profile |
SEC |
Zacks Reports |
StockTalk |
News |
Chart |
Request a new note
C
A N
S L
I M
|
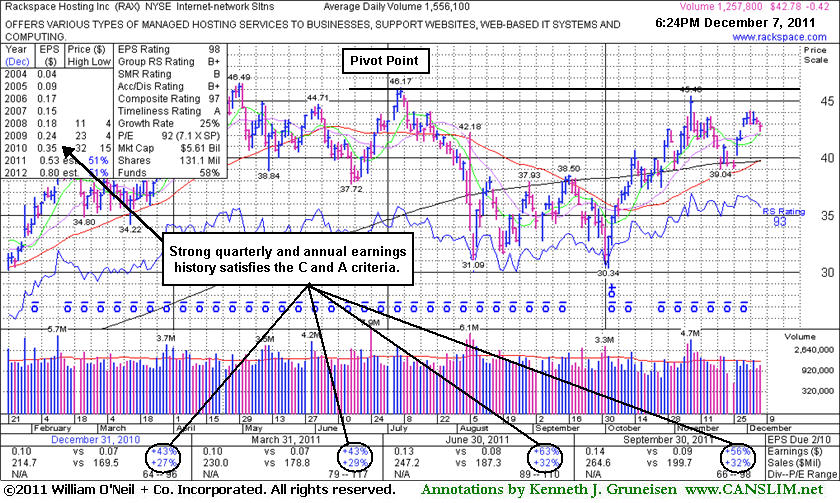
RAX
-
NYSE
Rackspace Hosting Inc
INTERNET - Internet Software and; Services
|
$42.78
|
-0.42
-0.97% |
$43.11
|
1,260,497
79.25% of 50 DAV
50 DAV is 1,590,600
|
$46.50
-7.99%
|
11/8/2011
|
$44.28
|
PP = $46.27
|
|
MB = $48.58
|
Most Recent Note - 12/7/2011 6:37:22 PM
Y - Quietly perched within close striking distance of its 52-week and all-time high. Support to watch is at its closely coinciding 50 and 200 DMA lines. Subsequent violations would trigger damaging technical sell signals. See the latest FSU analysis for more details and a new annotated daily graph.
>>> The latest Featured Stock Update with an annotated graph appeared on 12/7/2011. Click here.
View all notes |
Alert me of new notes |
CANSLIM.net Company Profile |
SEC |
Zacks Reports |
StockTalk |
News |
Chart |
Request a new note
C
A N
S L
I M
|
SWI
-
NYSE
Solarwinds Inc
COMPUTER SOFTWARE and SERVICES - Application Software
|
$32.07
|
-0.83
-2.52% |
$32.75
|
672,627
57.38% of 50 DAV
50 DAV is 1,172,200
|
$33.55
-4.41%
|
10/27/2011
|
$27.78
|
PP = $25.62
|
|
MB = $26.90
|
Most Recent Note - 12/7/2011 5:49:27 PM
G - Down today with below average volume, pulling back from its all-time high. Extended from its prior base, its prior highs in the $25-26 area define initial chart support to watch on pullbacks.
>>> The latest Featured Stock Update with an annotated graph appeared on 11/22/2011. Click here.
View all notes |
Alert me of new notes |
CANSLIM.net Company Profile |
SEC |
Zacks Reports |
StockTalk |
News |
Chart |
Request a new note
C
A N
S L
I M
|
TDG
-
NYSE
Transdigm Group Inc
AEROSPACE/DEFENSE - Aerospace/Defense Products and; Services
|
$95.02
|
-1.12
-1.16% |
$96.21
|
223,944
54.22% of 50 DAV
50 DAV is 413,000
|
$102.73
-7.51%
|
11/9/2011
|
$98.45
|
PP = $95.14
|
|
MB = $99.90
|
Most Recent Note - 12/6/2011 5:32:15 PM
Y - Small loss today on light volume. It stayed well above its 50 DMA line during its recent consolidation. A subsequent slump below the recent low and its 50 DMA line would trigger technical sell signals. See the latest FSU analysis for more details and a new annotated graph.
>>> The latest Featured Stock Update with an annotated graph appeared on 12/6/2011. Click here.
View all notes |
Alert me of new notes |
CANSLIM.net Company Profile |
SEC |
Zacks Reports |
StockTalk |
News |
Chart |
Request a new note
C
A N
S L
I M
|
UA
-
NYSE
Under Armour Inc Cl A
CONSUMER NON-DURABLES - Textile - Apparel Clothing
|
$82.22
|
-0.41
-0.50% |
$82.83
|
634,190
47.74% of 50 DAV
50 DAV is 1,328,400
|
$87.40
-5.93%
|
10/25/2011
|
$82.43
|
PP = $80.80
|
|
MB = $84.84
|
Most Recent Note - 12/5/2011 5:05:39 PM
G - Gapped up today and finished near the session high with a gain on lighter than average volume. Its 50 DMA line and recent low ($73.55 on 11/21/11) define important support to watch.
>>> The latest Featured Stock Update with an annotated graph appeared on 11/29/2011. Click here.
View all notes |
Alert me of new notes |
CANSLIM.net Company Profile |
SEC |
Zacks Reports |
StockTalk |
News |
Chart |
Request a new note
C
A N
S L
I M
|
Symbol/Exchange
Company Name
Industry Group |
PRICE |
CHANGE
(%Change) |
Day High |
Volume
(% DAV)
(% 50 day avg vol) |
52 Wk Hi
% From Hi |
Featured
Date |
Price
Featured |
Pivot Featured |
|
Max Buy |
ULTA
-
NASDAQ
Ulta Salon Cosm & Frag
SPECIALTY RETAIL - Specialty Retail, Other
|
$73.13
|
+0.20
0.27% |
$74.19
|
898,621
84.90% of 50 DAV
50 DAV is 1,058,400
|
$75.70
-3.39%
|
12/2/2011
|
$72.88
|
PP = $75.79
|
|
MB = $79.58
|
Most Recent Note - 12/5/2011 12:30:58 PM
Y - Touching a new 52-week high today. No resistance remains due to overhead supply and it may be working on a late-stage "square box" type base pattern. Its fundamentals (C and A criteria) remain strong. Color code is changed to yellow with new pivot point based on its 52-week high plus 10 cents.
>>> The latest Featured Stock Update with an annotated graph appeared on 12/2/2011. Click here.
View all notes |
Alert me of new notes |
CANSLIM.net Company Profile |
SEC |
Zacks Reports |
StockTalk |
News |
Chart |
Request a new note
C
A N
S L
I M
|
V
-
NYSE
Visa Inc Cl A
DIVERSIFIED SERVICES - Business/Management Services
|
$97.07
|
+1.70
1.78% |
$97.45
|
4,013,754
75.66% of 50 DAV
50 DAV is 5,305,100
|
$98.60
-1.55%
|
10/24/2011
|
$94.21
|
PP = $94.85
|
|
MB = $99.59
|
Most Recent Note - 12/7/2011 6:38:53 PM
Y - Still perched near its 52-week high. Proof of serious institutional demand requires at least +50% heavier than average volume behind a meaningful gain.
>>> The latest Featured Stock Update with an annotated graph appeared on 11/18/2011. Click here.
View all notes |
Alert me of new notes |
CANSLIM.net Company Profile |
SEC |
Zacks Reports |
StockTalk |
News |
Chart |
Request a new note
C
A N
S L
I M
|