***Last / Change / Volume data in this table is the closing quote data***
Symbol/Exchange
Company Name
Industry Group |
PRICE |
CHANGE
(%Change) |
Day High |
Volume
(% DAV)
(% 50 day avg vol) |
52 Wk Hi
% From Hi |
Featured
Date |
Price
Featured |
Pivot Featured |
|
Max Buy |
ABV
-
NYSE
Comp De Bebidas Adr
FOOD and BEVERAGE - Beverages - Brewers
|
$142.02
|
-1.31
-0.91% |
$143.24
|
369,432
56.47% of 50 DAV
50 DAV is 654,200
|
$145.36
-2.30%
|
11/4/2010
|
$142.35
|
PP = $143.63
|
|
MB = $150.81
|
Most Recent Note - 12/3/2010 4:26:49 PM
Y - It posted a considerable gain on light volume today, rallying near its 52-week high. A convincing gain with above average volume has not been seen since October, and recent distributional pressure remains a concern until proof of fresh institutional buying demand is shown. Color code is changed to yellow based on its recent resilience.
>>> The latest Featured Stock Update with an annotated graph appeared on 12/3/2010. Click here.
View all notes |
Alert me of new notes |
CANSLIM.net Company Profile |
SEC |
Zacks Reports |
StockTalk |
News |
Chart |
Request a new note
C
A N
S L
I M


|
ARUN
-
NASDAQ
Aruba Networks Inc
COMPUTER HARDWARE - Networking andamp; Communication Dev
|
$22.98
|
-0.04
-0.17% |
$23.05
|
1,884,245
70.83% of 50 DAV
50 DAV is 2,660,100
|
$24.28
-5.35%
|
8/30/2010
|
$18.12
|
PP = $18.51
|
|
MB = $19.44
|
 Most Recent Note - 12/6/2010 5:07:29 PM
G - Consolidating above its 50 DMA line only -5.4% off its 52-week high with volume totals cooling after enduring distributional pressure last week. It made a stand near an upward trendline connecting May - November lows previously noted as support to watch.
>>> The latest Featured Stock Update with an annotated graph appeared on 10/26/2010. Click here.
View all notes |
Alert me of new notes |
CANSLIM.net Company Profile |
SEC |
Zacks Reports |
StockTalk |
News |
Chart |
Request a new note
C
A N
S L
I M
|
BIDU
-
NASDAQ
Baidu Inc Ads
INTERNET - Internet Information Providers
|
$110.23
|
+1.00
0.92% |
$111.72
|
10,692,430
87.39% of 50 DAV
50 DAV is 12,235,500
|
$115.04
-4.18%
|
9/17/2010
|
$85.73
|
PP = $88.42
|
|
MB = $92.84
|
Most Recent Note - 12/3/2010 5:37:04 PM
G - Rallied today with light volume after testing important support at its 50 DMA line. Any damaging violation of its short-term average or recent chart low ($103.11 on 11/16/10) would raise greater concerns and trigger technical sell signals. BIDU has been noted as a riskier "late stage" candidate, yet could produce more climactic gains.
>>> The latest Featured Stock Update with an annotated graph appeared on 11/30/2010. Click here.
View all notes |
Alert me of new notes |
CANSLIM.net Company Profile |
SEC |
Zacks Reports |
StockTalk |
News |
Chart |
Request a new note
C
A N
S L
I M
|
CACC
-
NASDAQ
Credit Acceptance Corp
FINANCIAL SERVICES - Credit Services
|
$62.00
|
+0.08
0.13% |
$62.22
|
20,710
84.19% of 50 DAV
50 DAV is 24,600
|
$63.45
-2.28%
|
11/22/2010
|
$59.97
|
PP = $62.00
|
|
MB = $65.10
|
Most Recent Note - 12/6/2010 5:09:44 PM
Y - Hovering only -2.3% off its 52-week high. Its 11/29/10 gain with +69% above average volume helped it rally above the pivot point of a "double bottom" type base pattern, meeting the guidelines for a new (or add-on) technical buy signal. Additional volume-driven gains into new high territory would be a reassuring sign.
>>> The latest Featured Stock Update with an annotated graph appeared on 10/29/2010. Click here.
View all notes |
Alert me of new notes |
CANSLIM.net Company Profile |
SEC |
Zacks Reports |
StockTalk |
News |
Chart |
Request a new note
C
A N
S L
I M
|
CIS
-
NYSE
Camelot Info Systems Ads
COMPUTER SOFTWARE andamp; SERVICES - Information Technology Service
|
$22.91
|
-0.40
-1.71% |
$24.70
|
241,640
78.51% of 50 DAV
50 DAV is 307,800
|
$24.89
-7.95%
|
11/26/2010
|
$18.93
|
PP = $19.72
|
|
MB = $20.71
|
Most Recent Note - 12/6/2010 4:58:25 PM
G - Wider intra-day price swings indicate uncertainty. It quickly got extended from a sound base. Prior highs in the $19.50 area define chart support to watch following its recent streak of volume-driven gains.
>>> The latest Featured Stock Update with an annotated graph appeared on 11/26/2010. Click here.
View all notes |
Alert me of new notes |
CANSLIM.net Company Profile |
SEC |
Zacks Reports |
StockTalk |
News |
Chart |
Request a new note
C
A N
S L
I M
|
Symbol/Exchange
Company Name
Industry Group |
PRICE |
CHANGE
(%Change) |
Day High |
Volume
(% DAV)
(% 50 day avg vol) |
52 Wk Hi
% From Hi |
Featured
Date |
Price
Featured |
Pivot Featured |
|
Max Buy |
CMG
-
NYSE
Chipotle Mexican Grill
LEISURE - Restaurants
|
$241.06
|
+5.11
2.17% |
$242.22
|
1,457,544
155.50% of 50 DAV
50 DAV is 937,300
|
$262.78
-8.26%
|
9/1/2010
|
$158.31
|
PP = $155.52
|
|
MB = $163.30
|
Most Recent Note - 12/6/2010 5:02:01 PM
G - Gain today halted its slide following 2 damaging distributional losses with above average volume. It was repeatedly noted as -"Extended from any sound base pattern." Its 50 DMA line (now $209) defines the nearest chart support level.
>>> The latest Featured Stock Update with an annotated graph appeared on 10/28/2010. Click here.
View all notes |
Alert me of new notes |
CANSLIM.net Company Profile |
SEC |
Zacks Reports |
StockTalk |
News |
Chart |
Request a new note
C
A N
S L
I M
|
DECK
-
NASDAQ
Deckers Outdoor Corp
CONSUMER NON-DURABLES - Textile - Apparel Footwear
|
$83.11
|
+0.23
0.28% |
$83.66
|
2,942,467
197.84% of 50 DAV
50 DAV is 1,487,300
|
$82.97
0.17%
|
10/27/2010
|
$54.16
|
PP = $54.86
|
|
MB = $57.60
|
Most Recent Note - 12/6/2010 12:43:52 PM
G -After its recent streak of volume-driven gains to new all-time highs it is very extended from any sound base. Its prior highs and its 50 DMA line define the nearest chart support.
>>> The latest Featured Stock Update with an annotated graph appeared on 10/27/2010. Click here.
View all notes |
Alert me of new notes |
CANSLIM.net Company Profile |
SEC |
Zacks Reports |
StockTalk |
News |
Chart |
Request a new note
C
A N
S L
I M
|
EZCH
-
NASDAQ
Ezchip Semiconductor Ltd
ELECTRONICS - Semiconductor - Specialized
|
$28.81
|
+0.98
3.52% |
$29.48
|
616,173
241.26% of 50 DAV
50 DAV is 255,400
|
$28.11
2.49%
|
12/2/2010
|
$27.53
|
PP = $26.00
|
|
MB = $27.30
|
Most Recent Note - 12/6/2010 12:47:42 PM
G - Considerable gain today with above average volume, getting more extended from its orderly "double bottom" type base. Color code is changed to green, and prior chart highs in the $26 area define an important technical support level to watch.
>>> The latest Featured Stock Update with an annotated graph appeared on 12/2/2010. Click here.
View all notes |
Alert me of new notes |
CANSLIM.net Company Profile |
SEC |
Zacks Reports |
StockTalk |
News |
Chart |
Request a new note
C
A N
S L
I M
|
EZPW
-
NASDAQ
Ezcorp Inc Cl A
SPECIALTY RETAIL - Specialty Retail, Other
|
$26.75
|
+0.14
0.53% |
$27.07
|
491,392
156.39% of 50 DAV
50 DAV is 314,200
|
$27.67
-3.32%
|
11/5/2010
|
$24.02
|
PP = $23.85
|
|
MB = $25.04
|
Most Recent Note - 12/6/2010 5:04:17 PM
G - Stubbornly holding its ground after spiking to new all-time highs last week, extended from a sound base pattern. Prior highs in the $22-23 area define chart support to watch near its 50 DMA line.
>>> The latest Featured Stock Update with an annotated graph appeared on 11/6/2010. Click here.
View all notes |
Alert me of new notes |
CANSLIM.net Company Profile |
SEC |
Zacks Reports |
StockTalk |
News |
Chart |
Request a new note
C
A N
S L
I M
|
FFIV
-
NASDAQ
F 5 Networks Inc
INTERNET - Internet Software and Services
|
$139.80
|
+0.52
0.37% |
$140.58
|
1,552,668
53.38% of 50 DAV
50 DAV is 2,908,800
|
$141.62
-1.29%
|
6/16/2010
|
$74.50
|
PP = $74.10
|
|
MB = $77.81
|
Most Recent Note - 12/3/2010 4:58:10 PM
G - Light volume gain today for another new all-time high. Extended from any sound base pattern. Prior highs in the $112 area define initial chart support.
>>> The latest Featured Stock Update with an annotated graph appeared on 11/15/2010. Click here.
View all notes |
Alert me of new notes |
CANSLIM.net Company Profile |
SEC |
Zacks Reports |
StockTalk |
News |
Chart |
Request a new note
C
A N
S L
I M
|
Symbol/Exchange
Company Name
Industry Group |
PRICE |
CHANGE
(%Change) |
Day High |
Volume
(% DAV)
(% 50 day avg vol) |
52 Wk Hi
% From Hi |
Featured
Date |
Price
Featured |
Pivot Featured |
|
Max Buy |
FOSL
-
NASDAQ
Fossil Inc
CONSUMER DURABLES - Recreational Goods, Other
|
$72.90
|
+0.64
0.89% |
$73.10
|
600,605
71.53% of 50 DAV
50 DAV is 839,700
|
$73.01
-0.15%
|
11/26/2010
|
$69.10
|
PP = $70.17
|
|
MB = $73.68
|
Most Recent Note - 12/3/2010 5:07:18 PM
Y - Held its ground today. It rallied to a new all-time high above its pivot point with volume +147% above average behind its considerable 12/02/10 gain, triggering a technical buy signal after an advanced "3-weeks tight" pattern.
>>> The latest Featured Stock Update with an annotated graph appeared on 11/29/2010. Click here.
View all notes |
Alert me of new notes |
CANSLIM.net Company Profile |
SEC |
Zacks Reports |
StockTalk |
News |
Chart |
Request a new note
C
A N
S L
I M
|
HMSY
-
NASDAQ
H M S Holdings Corp
COMPUTER SOFTWARE and SERVICES - Healthcare Information Service
|
$65.51
|
+0.24
0.37% |
$65.52
|
99,125
47.86% of 50 DAV
50 DAV is 207,100
|
$65.44
0.11%
|
11/19/2010
|
$61.89
|
PP = $63.01
|
|
MB = $66.16
|
Most Recent Note - 12/3/2010 5:58:29 PM
Y - Volume total was light behind today's 3rd consecutive gain as it traded further above its pivot point for another new 52-week high. Volume did not meet the guideline to trigger a proper new (or add-on) technical buy signal. Its 50 DMA line defines important support to watch.
>>> The latest Featured Stock Update with an annotated graph appeared on 11/19/2010. Click here.
View all notes |
Alert me of new notes |
CANSLIM.net Company Profile |
SEC |
Zacks Reports |
StockTalk |
News |
Chart |
Request a new note
C
A N
S L
I M
|
HS
-
NYSE
Healthspring Inc
HEALTH SERVICES - Health Care Plans
|
$28.74
|
-0.01
-0.03% |
$28.98
|
235,035
37.32% of 50 DAV
50 DAV is 629,700
|
$29.80
-3.56%
|
8/27/2010
|
$19.91
|
PP = $19.75
|
|
MB = $20.74
|
Most Recent Note - 12/3/2010 5:55:25 PM
G - Finished at its second-best close ever today after gains with light volume this week helped it rally from support at its 50 DMA line. It tested that important short-term average for the first time since August, meanwhile any more damaging losses would raise concerns and trigger a technical sell signal.
>>> The latest Featured Stock Update with an annotated graph appeared on 10/22/2010. Click here.
View all notes |
Alert me of new notes |
CANSLIM.net Company Profile |
SEC |
Zacks Reports |
StockTalk |
News |
Chart |
Request a new note
C
A N
S L
I M
|
JOBS
-
NASDAQ
Fifty One Job Inc Ads
DIVERSIFIED SERVICES - Staffing and; Outsourcing Service
|
$51.60
|
-0.40
-0.77% |
$52.91
|
70,432
36.74% of 50 DAV
50 DAV is 191,700
|
$52.99
-2.62%
|
10/13/2010
|
$42.07
|
PP = $40.60
|
|
MB = $42.63
|
Most Recent Note - 12/6/2010 5:10:54 PM
G - Stubbornly holding its ground with volume totals cooling since it gapped up on 12/01/10 for a new 52-week high. It is extended from a sound base, and its 50 DMA line defines important support to watch.
>>> The latest Featured Stock Update with an annotated graph appeared on 11/16/2010. Click here.
View all notes |
Alert me of new notes |
CANSLIM.net Company Profile |
SEC |
Zacks Reports |
StockTalk |
News |
Chart |
Request a new note
C
A N
S L
I M
|
LFT
-
NYSE
Longtop Financl Tech Ads
COMPUTER SOFTWARE and SERVICES - Business Software and Services
|
$38.60
|
-1.15
-2.89% |
$39.97
|
583,761
110.90% of 50 DAV
50 DAV is 526,400
|
$42.86
-9.94%
|
11/5/2010
|
$41.83
|
PP = $40.96
|
|
MB = $43.01
|
Most Recent Note - 12/6/2010 2:52:50 PM
G - Slumping -9.4% off its all-time high, it violated its 50 DMA line today, raising concerns. More damaging losses leading to a violation of its recent low ($37.71 on 11/15/10) would raise more serious concerns and trigger a more worrisome technical sell signal.
>>> The latest Featured Stock Update with an annotated graph appeared on 10/14/2010. Click here.
View all notes |
Alert me of new notes |
CANSLIM.net Company Profile |
SEC |
Zacks Reports |
StockTalk |
News |
Chart |
Request a new note
C
A N
S L
I M
|
Symbol/Exchange
Company Name
Industry Group |
PRICE |
CHANGE
(%Change) |
Day High |
Volume
(% DAV)
(% 50 day avg vol) |
52 Wk Hi
% From Hi |
Featured
Date |
Price
Featured |
Pivot Featured |
|
Max Buy |
LULU
-
NASDAQ
Lululemon Athletica
MANUFACTURING - Textile Manufacturing
|
$55.26
|
+1.88
3.52% |
$55.62
|
1,452,808
137.11% of 50 DAV
50 DAV is 1,059,600
|
$54.84
0.77%
|
10/8/2010
|
$47.66
|
PP = $46.67
|
|
MB = $49.00
|
Most Recent Note - 12/6/2010 2:54:14 PM
G - It faces no resistance but is extended from a sound base after a gain today for a new 52-week high. Prior highs in the $46-48 area define chart support to watch along with its 50 DMA line.
>>> The latest Featured Stock Update with an annotated graph appeared on 12/1/2010. Click here.
View all notes |
Alert me of new notes |
CANSLIM.net Company Profile |
SEC |
Zacks Reports |
StockTalk |
News |
Chart |
Request a new note
C
A N
S L
I M
|
MWIV
-
NASDAQ
M W I Veterinary Supply
HEALTH SERVICES - Medical Instruments and; Supplies
|
$60.99
|
-0.51
-0.83% |
$61.65
|
30,496
56.27% of 50 DAV
50 DAV is 54,200
|
$63.94
-4.61%
|
11/4/2010
|
$61.79
|
PP = $59.60
|
|
MB = $62.58
|
Most Recent Note - 12/6/2010 5:12:45 PM
Y - Consolidating above its 50 DMA line -4.6% off its 52-week high. It stalled after hitting its all-time high on 11/04/10, yet held its ground stubbornly above its short-term average.
>>> The latest Featured Stock Update with an annotated graph appeared on 11/2/2010. Click here.
View all notes |
Alert me of new notes |
CANSLIM.net Company Profile |
SEC |
Zacks Reports |
StockTalk |
News |
Chart |
Request a new note
C
A N
S L
I M
|
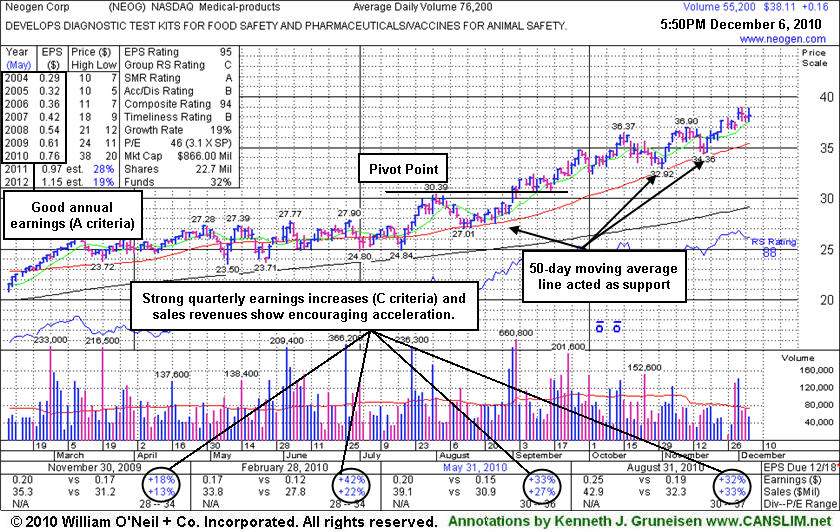
NEOG
-
NASDAQ
Neogen Corp
DRUGS - Diagnostic Substances
|
$38.11
|
+0.16
0.42% |
$38.93
|
55,200
70.14% of 50 DAV
50 DAV is 78,700
|
$38.97
-2.21%
|
9/1/2010
|
$30.79
|
PP = $30.49
|
|
MB = $32.01
|
Most Recent Note - 12/6/2010 5:14:38 PM
G - Holding its ground stubbornly near all-time highs, extended from any sound base after steadily advancing. Its 50 DMA line has been a reliable support level.
>>> The latest Featured Stock Update with an annotated graph appeared on 12/6/2010. Click here.
View all notes |
Alert me of new notes |
CANSLIM.net Company Profile |
SEC |
Zacks Reports |
StockTalk |
News |
Chart |
Request a new note
C
A N
S L
I M
|
NFLX
-
NASDAQ
Netflix Inc
SPECIALTY RETAIL - Music and Video Stores
|
$193.47
|
+8.02
4.32% |
$193.67
|
6,823,445
113.05% of 50 DAV
50 DAV is 6,036,000
|
$206.80
-6.45%
|
11/9/2010
|
$173.10
|
PP = $184.84
|
|
MB = $194.08
|
Most Recent Note - 12/6/2010 2:57:04 PM
G - Still well above its 50 DMA line, a gain today halted its slide after enduring heavy distributional pressure last week following a "negative reversal" on 12/01/10 at its all-time high.
>>> The latest Featured Stock Update with an annotated graph appeared on 11/24/2010. Click here.
View all notes |
Alert me of new notes |
CANSLIM.net Company Profile |
SEC |
Zacks Reports |
StockTalk |
News |
Chart |
Request a new note
C
A N
S L
I M
|
NTAP
-
NASDAQ
Netapp Inc
COMPUTER HARDWARE - Data Storage Devices
|
$53.27
|
-0.80
-1.48% |
$54.07
|
4,667,025
65.74% of 50 DAV
50 DAV is 7,099,300
|
$57.96
-8.09%
|
9/8/2010
|
$46.98
|
PP = $44.99
|
|
MB = $47.24
|
Most Recent Note - 12/6/2010 5:00:10 PM
G - Consolidating above its 50 DMA line. It is not near a sound base pattern, but last week's gains above its short-term average improved its technical stance.
>>> The latest Featured Stock Update with an annotated graph appeared on 11/3/2010. Click here.
View all notes |
Alert me of new notes |
CANSLIM.net Company Profile |
SEC |
Zacks Reports |
StockTalk |
News |
Chart |
Request a new note
C
A N
S L
I M
|
Symbol/Exchange
Company Name
Industry Group |
PRICE |
CHANGE
(%Change) |
Day High |
Volume
(% DAV)
(% 50 day avg vol) |
52 Wk Hi
% From Hi |
Featured
Date |
Price
Featured |
Pivot Featured |
|
Max Buy |
ORCL
-
NASDAQ
Oracle Corp
COMPUTER SOFTWARE and SERVICES - Application Software
|
$28.73
|
-0.08
-0.27% |
$28.96
|
21,144,559
62.92% of 50 DAV
50 DAV is 33,603,000
|
$29.82
-3.65%
|
9/20/2010
|
$27.32
|
PP = $26.73
|
|
MB = $28.07
|
Most Recent Note - 12/3/2010 5:29:57 PM
Y - Gains on near-average volume helped it rally back above its 50 DMA line this week, helping its outlook to improve, technically. Color code is changed to yellow based on recent resilience.
>>> The latest Featured Stock Update with an annotated graph appeared on 11/18/2010. Click here.
View all notes |
Alert me of new notes |
CANSLIM.net Company Profile |
SEC |
Zacks Reports |
StockTalk |
News |
Chart |
Request a new note
C
A N
S L
I M
|
PAY
-
NYSE
Verifone Systems Inc
COMPUTER HARDWARE - Transaction Automation Systems
|
$39.83
|
-0.04
-0.10% |
$40.09
|
1,591,426
115.77% of 50 DAV
50 DAV is 1,374,600
|
$40.23
-0.99%
|
11/29/2010
|
$33.96
|
PP = $36.04
|
|
MB = $37.84
|
Most Recent Note - 12/3/2010 5:31:31 PM
G - Gapped up today and rallied for a considerable gain and new 52-week high. Color code was changed to green. Noted on 12/02/10 - "Rallied above the new pivot point cited. Its considerable gain on more than than 2 times average volume triggered a technical buy signal while rising from a previously noted advanced 'ascending base' pattern."
>>> The latest Featured Stock Update with an annotated graph appeared on 10/25/2010. Click here.
View all notes |
Alert me of new notes |
CANSLIM.net Company Profile |
SEC |
Zacks Reports |
StockTalk |
News |
Chart |
Request a new note
C
A N
S L
I M
|
RAX
-
NYSE
Rackspace Hosting Inc
INTERNET - Internet Software and; Services
|
$30.49
|
+0.29
0.96% |
$30.47
|
885,954
34.31% of 50 DAV
50 DAV is 2,582,100
|
$30.49
0.00%
|
9/21/2010
|
$22.84
|
PP = $23.61
|
|
MB = $24.79
|
Most Recent Note - 12/3/2010 5:56:46 PM
G - Small gain on light volume today for a best-ever close. Volume totals have been below average in recent weeks. No resistance remains due to overhead supply, but it is extended from any sound base.
>>> The latest Featured Stock Update with an annotated graph appeared on 11/17/2010. Click here.
View all notes |
Alert me of new notes |
CANSLIM.net Company Profile |
SEC |
Zacks Reports |
StockTalk |
News |
Chart |
Request a new note
C
A N
S L
I M
|
ROVI
-
NASDAQ
Rovi Corp
COMPUTER SOFTWARE andamp; SERVICES - Security Software andamp; Services
|
$55.93
|
+0.03
0.05% |
$56.20
|
698,469
52.50% of 50 DAV
50 DAV is 1,330,300
|
$56.07
-0.25%
|
10/29/2010
|
$49.99
|
PP = $53.10
|
|
MB = $55.76
|
Most Recent Note - 12/3/2010 5:41:26 PM
G - Gain today for a new high close above its "max buy" level" without great volume conviction. Color code is changed to green after getting extended from its latest base without enough volume behind gains in recent weeks to trigger a proper new (or add-on) technical buy signal. Meanwhile, its 50 DMA line defines important support to watch.
>>> The latest Featured Stock Update with an annotated graph appeared on 10/20/2010. Click here.
View all notes |
Alert me of new notes |
CANSLIM.net Company Profile |
SEC |
Zacks Reports |
StockTalk |
News |
Chart |
Request a new note
C
A N
S L
I M
|
SHOO
-
NASDAQ
Steven Madden Limited
CONSUMER NON-DURABLES - Textile - Apparel Footwear
|
$45.21
|
-0.93
-2.02% |
$46.10
|
498,770
138.13% of 50 DAV
50 DAV is 361,100
|
$46.75
-3.29%
|
11/23/2010
|
$44.61
|
PP = $44.95
|
|
MB = $47.20
|
Most Recent Note - 12/6/2010 4:57:11 PM
Y - Loss on above average volume today was a sign of distributional pressure, yet it remains above its latest pivot point. Its 11/29/10 gain with twice average volume met the guidelines for a new (or add-on) technical buy signal. No resistance remains due to overhead supply.
>>> The latest Featured Stock Update with an annotated graph appeared on 11/23/2010. Click here.
View all notes |
Alert me of new notes |
CANSLIM.net Company Profile |
SEC |
Zacks Reports |
StockTalk |
News |
Chart |
Request a new note
C
A N
S L
I M
|
Symbol/Exchange
Company Name
Industry Group |
PRICE |
CHANGE
(%Change) |
Day High |
Volume
(% DAV)
(% 50 day avg vol) |
52 Wk Hi
% From Hi |
Featured
Date |
Price
Featured |
Pivot Featured |
|
Max Buy |
SLW
-
NYSE
Silver Wheaton Corp
METALS and; MINING - Silver
|
$40.84
|
+1.53
3.89% |
$40.99
|
14,191,122
147.77% of 50 DAV
50 DAV is 9,603,400
|
$39.50
3.39%
|
8/25/2010
|
$21.40
|
PP = $21.99
|
|
MB = $23.09
|
Most Recent Note - 12/6/2010 2:58:00 PM
G - Up today with above average volume behind a 6th consecutive gain for another new all-time high. It is extended from any sound base, and the recent low ($30.52 on 11/16/10) defines initial support above its 50 DMA line.
>>> The latest Featured Stock Update with an annotated graph appeared on 10/18/2010. Click here.
View all notes |
Alert me of new notes |
CANSLIM.net Company Profile |
SEC |
Zacks Reports |
StockTalk |
News |
Chart |
Request a new note
C
A N
S L
I M
|
UA
-
NYSE
Under Armour Inc Cl A
CONSUMER NON-DURABLES - Textile - Apparel Clothing
|
$59.55
|
+0.52
0.88% |
$59.49
|
403,652
56.65% of 50 DAV
50 DAV is 712,500
|
$59.19
0.61%
|
9/9/2010
|
$39.99
|
PP = $40.10
|
|
MB = $42.11
|
Most Recent Note - 12/6/2010 5:17:19 PM
G - Hit yet another new 52-week high today with a small gain on light volume. The high-ranked Apparel - Clothing firm is very extended from any sound base and well above support at its 50 DMA line.
>>> The latest Featured Stock Update with an annotated graph appeared on 11/4/2010. Click here.
View all notes |
Alert me of new notes |
CANSLIM.net Company Profile |
SEC |
Zacks Reports |
StockTalk |
News |
Chart |
Request a new note
C
A N
S L
I M
|
ULTA
-
NASDAQ
Ulta Salon Cosm & Frag
SPECIALTY RETAIL - Specialty Retail, Other
|
$34.08
|
-1.14
-3.24% |
$36.04
|
1,074,640
227.24% of 50 DAV
50 DAV is 472,900
|
$37.24
-8.49%
|
9/3/2010
|
$26.36
|
PP = $25.89
|
|
MB = $27.18
|
Most Recent Note - 12/6/2010 2:49:08 PM
G - Enduring distributional pressure following a negative reversal on 12/02/10 after hitting an all-time high. It is extended from any recent base, meanwhile, its 50 DMA line defines initial support to watch.
>>> The latest Featured Stock Update with an annotated graph appeared on 11/1/2010. Click here.
View all notes |
Alert me of new notes |
CANSLIM.net Company Profile |
SEC |
Zacks Reports |
StockTalk |
News |
Chart |
Request a new note
C
A N
S L
I M
|
VIT
-
NYSE
Vanceinfo Tech Inc Ads
COMPUTER SOFTWARE and SERVICES - Business Software and Services
|
$38.88
|
-0.07
-0.18% |
$39.59
|
683,117
109.28% of 50 DAV
50 DAV is 625,100
|
$41.06
-5.31%
|
7/8/2010
|
$25.20
|
PP = $26.58
|
|
MB = $27.91
|
Most Recent Note - 12/3/2010 5:26:51 PM
G - After a negative reversal an all-time high it finished near the session low today with above average volume behind the loss. Completed a Public Offering on 11/23/10. It 50 DMA line has acted as support recently, but it has not formed a sound base recently.
>>> The latest Featured Stock Update with an annotated graph appeared on 10/21/2010. Click here.
View all notes |
Alert me of new notes |
CANSLIM.net Company Profile |
SEC |
Zacks Reports |
StockTalk |
News |
Chart |
Request a new note
C
A N
S L
I M
|