You are not logged in.
This means you
CAN ONLY VIEW reports that were published prior to Monday, April 14, 2025.
You
MUST UPGRADE YOUR MEMBERSHIP if you want to see any current reports.
AFTER MARKET UPDATE - WEDNESDAY, DECEMBER 4TH, 2013
Previous After Market Report Next After Market Report >>>
|
|
|
|
DOW |
-24.85 |
15,889.77 |
-0.16% |
|
Volume |
756,073,000 |
-2% |
|
Volume |
1,835,626,100 |
+5% |
|
NASDAQ |
+0.80 |
4,038.00 |
+0.02% |
|
Advancers |
1,141 |
37% |
|
Advancers |
1,077 |
40% |
|
S&P 500 |
-2.34 |
1,792.81 |
-0.13% |
|
Decliners |
1,888 |
60% |
|
Decliners |
1,487 |
56% |
|
Russell 2000 |
-2.40 |
1,121.38 |
-0.21% |
|
52 Wk Highs |
63 |
|
|
52 Wk Highs |
87 |
|
|
S&P 600 |
-2.30 |
643.23 |
-0.36% |
|
52 Wk Lows |
91 |
|
|
52 Wk Lows |
20 |
|
|
 |
Major Averages Ended Mixed, Up From Early Lows
Kenneth J. Gruneisen - Passed the CAN SLIM® Master's Exam
The major averages ended mixed, albeit well off of their session lows on Wednesday. The volume totals were reported mixed, higher on the Nasdaq exchange while lighter on the NYSE. Breadth was negative as decliners led advancers again by about a 3-2 margin on the NYSE and on the Nasdaq exchange. Leadership continued contracting as there were only 21 high-ranked companies from the CANSLIM.net Leaders List that made new 52-week highs and appeared on the CANSLIM.net BreakOuts Page, down from a total of 24 stocks on the prior session. Any sustained rally must have leadership, so recently waning new highs totals are a concern coupled with the noted signs of distribution. The list of stocks hitting new 52-week highs still outnumbered new lows on the Nasdaq exchange, but new lows outnumbered new high on the NYSE. There were gains for only 8 of the 19 high-ranked companies currently included on the Featured Stocks Page.
The Dow Jones Industrial Average gave up just 24 points to 15,889 after being down by as many as 123 points. The S&P 500 shed 2 points to 1,792 and the NASDAQ advanced less than a point to close at 4,038. Stocks were under pressure throughout much of the session as a better-than-expected ADP employment report heightened fears that the Federal Reserve may soon begin to taper their bond purchases. Despite the weakness, equities pared their losses as the Fed’s Beige Book showed only a modest expansion of the economy. Market volatility could continue to be a factor ahead of Friday’s closely watched non-farm payrolls report.
On the earnings front, Express Inc (EXP -22.9%) dove as the retailer posted a disappointing profit tally and lowered their full-year guidance. In other news, shares of Hewlett-Packard (HPQ +2.3%) rose after the stock received some positive analyst comments.
Turning to fixed income markets, Treasuries were lower along the curve. The benchmark 10-year note was down 7/16 of a point to yield 2.84% and the 30-year bond was off 29/32 to yield 3.90%.
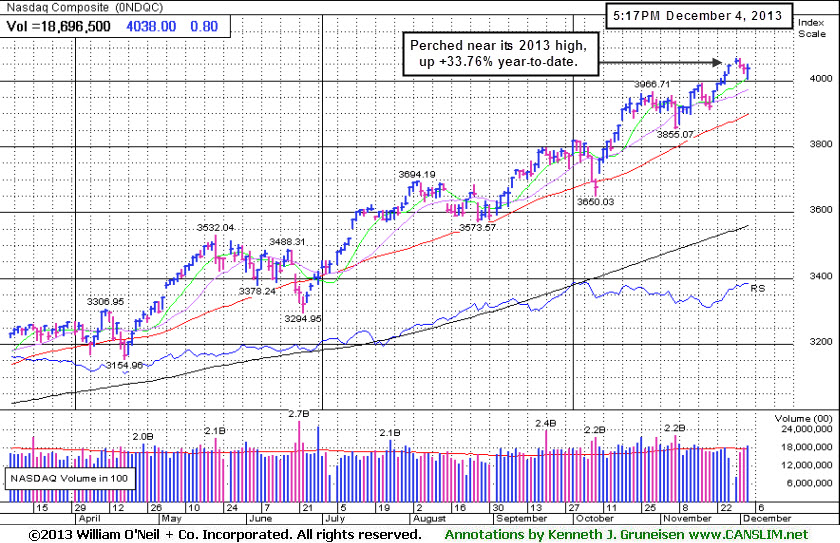
The Market (M criteria) remains in a confirmed rally, however showing signs of distribution and waning leadership, yet the Dow and S&P 500 Index both remain perched near new all-time highs. As always, any new buying efforts should be selective. The CANSLIM.net Featured Stocks Page shows the most action-worthy candidates and their latest notes and a new Headline Link directs members to the latest detailed analysis with data-packed graphs annotated by a Certified expert along with links to additional resources. The Premium Member Homepage - includes "dynamic archives" to all prior pay reports published. Watch for an announcement via email concerning the next WEBCAST.
PICTURED: The Nasdaq Composite Index is perched near its 2013 high, up +33.76% year-to-date.
|
 Kenneth J. Gruneisen started out as a licensed stockbroker in August 1987, a couple of months prior to the historic stock market crash that took the Dow Jones Industrial Average down -22.6% in a single day. He has published daily fact-based fundamental and technical analysis on high-ranked stocks online for two decades. Through FACTBASEDINVESTING.COM, Kenneth provides educational articles, news, market commentary, and other information regarding proven investment systems that work in good times and bad.
Comments contained in the body of this report are technical opinions only and are not necessarily those of Gruneisen Growth Corp. The material herein has been obtained from sources believed to be reliable and accurate, however, its accuracy and completeness cannot be guaranteed. Our firm, employees, and customers may effect transactions, including transactions contrary to any recommendation herein, or have positions in the securities mentioned herein or options with respect thereto. Any recommendation contained in this report may not be suitable for all investors and it is not to be deemed an offer or solicitation on our part with respect to the purchase or sale of any securities. |
|
 |
Bank, Networking, and Gold & Silver Index Posted Gains
Kenneth J. Gruneisen - Passed the CAN SLIM® Master's Exam
The Bank Index ($BKX +0.37%) posted a modest gain while the Broker/Dealer Index ($XBD -0.00%) finished flat. The Networking Index ($NWX +0.89%) led the tech sector, meanwhile the Semiconductor Index ($SOX -0.48%) and the Biotechnology Index ($BTK -0.44%) suffered modest losses. The Gold & Silver Index ($XAU +2.63%) was a standout gainer. The Retail Index ($RLX -0.24%) edged lower and energy-related shares also had a slightly negative bias as the Oil Services Index ($OSX -0.17%) and the Integrated Oil Index ($XOI -0.50%) ended lower.
Charts courtesy www.stockcharts.com
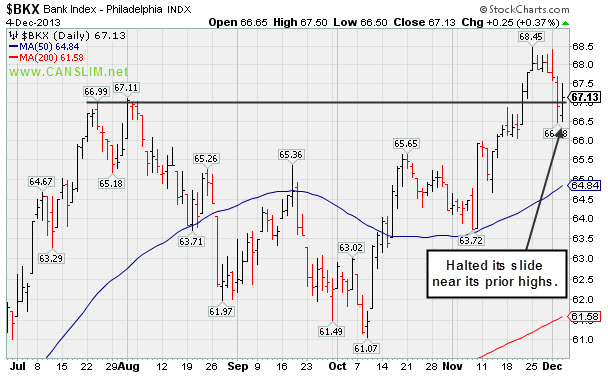
PICTURED: The Bank Index ($BKX +0.37%) halted its slide near prior highs.
| Oil Services |
$OSX |
278.81 |
-0.47 |
-0.17% |
+26.64% |
| Integrated Oil |
$XOI |
1,467.31 |
-7.37 |
-0.50% |
+18.16% |
| Semiconductor |
$SOX |
508.77 |
-2.43 |
-0.48% |
+32.47% |
| Networking |
$NWX |
305.81 |
+2.69 |
+0.89% |
+34.99% |
| Broker/Dealer |
$XBD |
152.67 |
-0.00 |
-0.00% |
+61.85% |
| Retail |
$RLX |
917.24 |
-2.21 |
-0.24% |
+40.45% |
| Gold & Silver |
$XAU |
83.01 |
+2.13 |
+2.63% |
-49.87% |
| Bank |
$BKX |
67.13 |
+0.25 |
+0.37% |
+30.91% |
| Biotech |
$BTK |
2,268.59 |
-9.99 |
-0.44% |
+46.64% |
|
|
|
 |
Cooling Volume Totals While Hovering Near Highs
Kenneth J. Gruneisen - Passed the CAN SLIM® Master's Exam
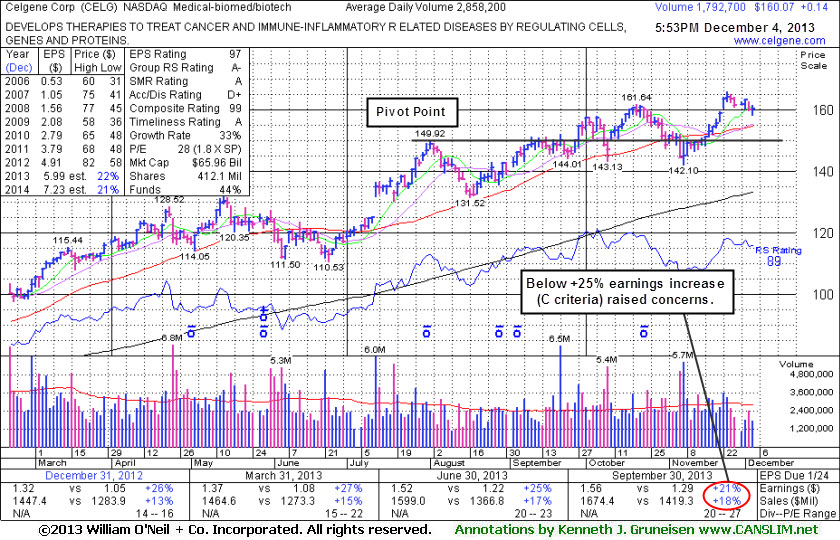
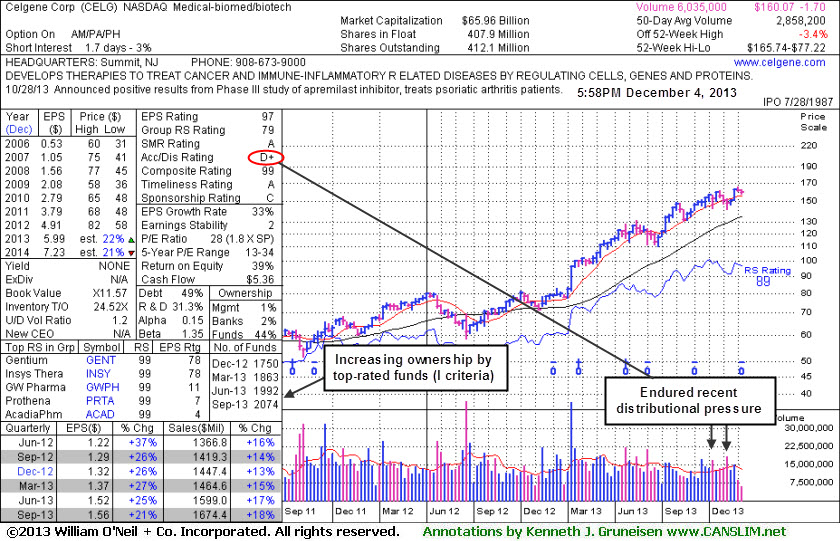
Celgene Corp (CELG +$0.14 or +0.09% to $160.07) has proven resilient and is hovering near its 52-week and all-time highs with volume totals cooling after volume-driven gains to new highs. Its weekly graph below shows that it endured distributional pressure in recent weeks. Its D+ rating for Accumulation/Distribution is also cause for some concern (see red circle on weekly graph).
CELG has made limited progress above the pivot point long ago cited based on its 8/01/13 high. It technically broke out of another short flat base that formed but no new pivot point was cited. Fundamental flaws may be considered an over-riding concern arguing against new buying efforts. It reported earnings +21% on +18% sales revenues for the Sep '13 quarter. below the +25% minimum guideline (C criteria) - (see red circle on daily graph).
After its last appearance in this FSU section on 11/01/13 with an annotated graph under the headline, "Testing 50-Day Average Following Sub Par Earnings Increase", subsequent technical sell signals were noted. However, it halted its slide with a gain on 11/07/13 backed by heavier volume (5.7 million shares traded) and after it rebounded above its 50-day moving average its outlook continued improving. While any stock that is sold can always be bought back later if strength returns, investors owning it now may continue give it the benefit of the doubt while being on the watch for any weakness or noted technical sell signals.
The number of top-rated funds owning its shares rose from 1,623 in Dec '11 to 2,074 in Sep '13, a reassuring trend concerning the I criteria. However, the company is already well-known by the institutional crowd, and that means that very few are likely to just be discovering it. The concern is only great if it shows any sign of technical weakness
|
|
|
Color Codes Explained :
Y - Better candidates highlighted by our
staff of experts.
G - Previously featured
in past reports as yellow but may no longer be buyable under the
guidelines.
***Last / Change / Volume data in this table is the closing quote data***
Symbol/Exchange
Company Name
Industry Group |
PRICE |
CHANGE
(%Change) |
Day High |
Volume
(% DAV)
(% 50 day avg vol) |
52 Wk Hi
% From Hi |
Featured
Date |
Price
Featured |
Pivot Featured |
|
Max Buy |
BITA
-
NYSE
Bitauto Hldgs Ltd Ads
INTERNET - Internet Information Providers
|
$31.96
|
-0.13
-0.41% |
$32.49
|
612,733
53.28% of 50 DAV
50 DAV is 1,150,100
|
$35.04
-8.79%
|
9/24/2013
|
$16.40
|
PP = $17.31
|
|
MB = $18.18
|
Most Recent Note - 11/29/2013 10:53:00 AM
G - Hovering near its 52-week high, very extended from any sound base. Its prior high in the $28 area define initial support to watch on pullbacks.
>>> FEATURED STOCK ARTICLE : Consolidating After Getting Extended From Prior Base - 11/11/2013
View all notes |
Set NEW NOTE alert |
CANSLIM.net Company Profile |
SEC
News |
Chart |
Request a new note
C
A N
S L
I M


|
CELG
-
NASDAQ
Celgene Corp
DRUGS - Drug Manufacturers - Major
|
$160.07
|
+0.14
0.09% |
$161.45
|
1,794,095
62.77% of 50 DAV
50 DAV is 2,858,200
|
$165.74
-3.42%
|
9/12/2013
|
$149.50
|
PP = $150.02
|
|
MB = $157.52
|
 Most Recent Note - 12/4/2013 7:01:02 PM
G - Hovering near its 52-week and all-time highs with volume totals cooling. See the latest FSU analysis for more details and a new annotated daily and weekly graphs.
>>> FEATURED STOCK ARTICLE : Cooling Volume Totals While Hovering Near Highs - 12/4/2013
View all notes |
Set NEW NOTE alert |
CANSLIM.net Company Profile |
SEC
News |
Chart |
Request a new note
C
A N
S L
I M
|
EGOV
-
NASDAQ
N I C Inc
INTERNET - Internet Software and Services
|
$23.43
|
-0.47
-1.97% |
$24.08
|
146,261
49.16% of 50 DAV
50 DAV is 297,500
|
$25.99
-9.85%
|
10/18/2013
|
$25.17
|
PP = $23.66
|
|
MB = $24.84
|
Most Recent Note - 12/2/2013 6:04:50 PM
G - Down considerably today with near average but higher volume indicative of mild distributional pressure. Disciplined investors always limit losses by selling any stock that falls more than -7% from their purchase price.
>>> FEATURED STOCK ARTICLE : Finding Support Near 50-Day Average During Distributional Pressure - 11/25/2013
View all notes |
Set NEW NOTE alert |
CANSLIM.net Company Profile |
SEC
News |
Chart |
Request a new note
C
A N
S L
I M
|
FLT
-
NYSE
Fleetcor Technologies
DIVERSIFIED SERVICES - Business/Management Services
|
$121.99
|
-0.06
-0.05% |
$122.75
|
522,990
63.35% of 50 DAV
50 DAV is 825,600
|
$123.96
-1.59%
|
8/19/2013
|
$99.01
|
PP = $100.97
|
|
MB = $106.02
|
Most Recent Note - 12/3/2013 1:04:59 PM
G - Still hovering at its all-time high, extended from any sound base. A steep upward trendline connecting its Oct-Nov lows defines initial support to watch well above its 50 DMA line ($113.34 now).
>>> FEATURED STOCK ARTICLE : Perched Near All-Time High Tallying Quiet Gains - 11/13/2013
View all notes |
Set NEW NOTE alert |
CANSLIM.net Company Profile |
SEC
News |
Chart |
Request a new note
C
A N
S L
I M
|
GNRC
-
NYSE
Generac Hldgs Inc
CONSUMER DURABLES - Electronic Equipment
|
$52.80
|
-0.13
-0.25% |
$53.16
|
1,141,229
138.16% of 50 DAV
50 DAV is 826,000
|
$53.74
-1.74%
|
11/26/2013
|
$53.02
|
PP = $52.42
|
|
MB = $55.04
|
Most Recent Note - 11/29/2013 2:46:49 PM
Y - Perched at its 52-week high today. Prior highs in the $52 area define initial support to watch after its breakout from a short flat base with +59% above average volume triggered a new (or-add on) technical buy signal. See the latest FSU analysis for more details and new annotated daily and weekly graphs.
>>> FEATURED STOCK ARTICLE : Following Latest Breakout Prior Highs Define Support - 11/29/2013
View all notes |
Set NEW NOTE alert |
CANSLIM.net Company Profile |
SEC
News |
Chart |
Request a new note
C
A N
S L
I M
|
Symbol/Exchange
Company Name
Industry Group |
PRICE |
CHANGE
(%Change) |
Day High |
Volume
(% DAV)
(% 50 day avg vol) |
52 Wk Hi
% From Hi |
Featured
Date |
Price
Featured |
Pivot Featured |
|
Max Buy |
HLF
-
NYSE
Herbalife Ltd
DRUGS - Nutrition and Weight Management
|
$75.93
|
-0.72
-0.94% |
$76.25
|
2,665,801
107.37% of 50 DAV
50 DAV is 2,482,900
|
$76.83
-1.17%
|
11/22/2013
|
$72.21
|
PP = $75.04
|
|
MB = $78.79
|
Most Recent Note - 12/3/2013 1:12:35 PM
Y - Volume is running at an above average pace today while hitting a new 52-week high and trading above its pivot point. Volume must be at least +40% above average when rallying above the pivot point to trigger a proper technical buy signal.
>>> FEATURED STOCK ARTICLE : Perched Near Highs Following Rebound - 11/22/2013
View all notes |
Set NEW NOTE alert |
CANSLIM.net Company Profile |
SEC
News |
Chart |
Request a new note
C
A N
S L
I M
|
JAZZ
-
NASDAQ
Jazz Pharmaceuticals Plc
DRUGS - Biotechnology
|
$114.38
|
+0.57
0.50% |
$116.82
|
927,096
122.92% of 50 DAV
50 DAV is 754,200
|
$118.80
-3.72%
|
9/30/2013
|
$93.20
|
PP = $89.10
|
|
MB = $93.56
|
Most Recent Note - 12/3/2013 1:14:25 PM
G - Volume totals have been cooling while hovering near its 52-week high, stubbornly holding its ground while extended from any sound base. Prior notes reminded members - "Disciplined investors avoid chasing stocks more than +5% above prior highs and always limit losses by selling any stock that falls more than -7% from their purchase price."
>>> FEATURED STOCK ARTICLE : Hovering Near All-Time Highs Following Volume-Driven Gains - 11/7/2013
View all notes |
Set NEW NOTE alert |
CANSLIM.net Company Profile |
SEC
News |
Chart |
Request a new note
C
A N
S L
I M
|
KORS
-
NYSE
Michael Kors Hldgs Ltd
RETAIL - Apparel Stores
|
$80.76
|
+0.37
0.46% |
$80.89
|
2,735,403
61.26% of 50 DAV
50 DAV is 4,465,200
|
$83.13
-2.86%
|
8/6/2013
|
$69.66
|
PP = $66.28
|
|
MB = $69.59
|
Most Recent Note - 12/4/2013 7:10:41 PM
G - Managed a positive reversal today. Volume totals have still been cooling while hovering in a tight range near all-time highs, stubbornly holding its ground. Prior highs in the $78 area define near-term support above its 50 DMA line.
>>> FEATURED STOCK ARTICLE : Hitting New Highs After Choppy Consolidation - 11/6/2013
View all notes |
Set NEW NOTE alert |
CANSLIM.net Company Profile |
SEC
News |
Chart |
Request a new note
C
A N
S L
I M
|
LOPE
-
NASDAQ
Grand Canyon Education
DIVERSIFIED SERVICES - Education and; Training Services
|
$44.00
|
-0.46
-1.03% |
$44.69
|
373,093
90.29% of 50 DAV
50 DAV is 413,200
|
$50.48
-12.84%
|
6/19/2013
|
$31.47
|
PP = $34.17
|
|
MB = $35.88
|
Most Recent Note - 12/3/2013 1:07:13 PM
G - Volume totals have been cooling while consolidating above its 50 DMA line defining near-term support. Repeatedly noted - "Fundamental concerns remain while technical action has been reassuring."
>>> FEATURED STOCK ARTICLE : Fundamental Concerns Noted While Consolidating Above 50-Day Moving Average - 11/26/2013
View all notes |
Set NEW NOTE alert |
CANSLIM.net Company Profile |
SEC
News |
Chart |
Request a new note
C
A N
S L
I M
|
NOAH
-
NYSE
Noah Holdings Ltd Ads
FINANCIAL SERVICES - Asset Management
|
$20.20
|
-0.37
-1.80% |
$20.95
|
349,931
42.06% of 50 DAV
50 DAV is 832,000
|
$25.51
-20.82%
|
10/15/2013
|
$19.10
|
PP = $18.33
|
|
MB = $19.25
|
Most Recent Note - 12/3/2013 1:01:27 PM
G - Still consolidating above its 50 DMA line which acted as support throughout its choppy ascent. Previously noted with caution - "A violation may trigger a technical sell signal. Caution is called for after a worrisome 'negative reversal' occurred at its 52-week high, and it is extended from its latest base."
>>> FEATURED STOCK ARTICLE : 50-Day Average And Prior Highs Define Important Support - 11/20/2013
View all notes |
Set NEW NOTE alert |
CANSLIM.net Company Profile |
SEC
News |
Chart |
Request a new note
C
A N
S L
I M
|
Symbol/Exchange
Company Name
Industry Group |
PRICE |
CHANGE
(%Change) |
Day High |
Volume
(% DAV)
(% 50 day avg vol) |
52 Wk Hi
% From Hi |
Featured
Date |
Price
Featured |
Pivot Featured |
|
Max Buy |
PCLN
-
NASDAQ
Priceline.Com Inc
INTERNET - Internet Software and Services
|
$1,181.67
|
+5.19
0.44% |
$1,184.99
|
462,747
72.19% of 50 DAV
50 DAV is 641,000
|
$1,198.75
-1.42%
|
9/13/2013
|
$966.82
|
PP = $995.08
|
|
MB = $1,044.83
|
Most Recent Note - 12/4/2013 7:14:03 PM
G - Hovering at its 52-week high with volume totals cooling. It may go on to produce more climactic gains but is currently extended from any sound base pattern. Reported earnings +40% on +33% sales revenues for the Sep '13 quarter versus the year-ago period, improving after a slightly sub par Jun '13 report.
>>> FEATURED STOCK ARTICLE : Extended From Any Sound Base Pattern - 12/3/2013
View all notes |
Set NEW NOTE alert |
CANSLIM.net Company Profile |
SEC
News |
Chart |
Request a new note
C
A N
S L
I M
|
PRLB
-
NYSE
Proto Labs Inc
MANUFACTURING - Small Tools and Accessories
|
$74.67
|
+0.38
0.51% |
$74.99
|
229,346
49.78% of 50 DAV
50 DAV is 460,700
|
$89.97
-17.00%
|
7/29/2013
|
$64.86
|
PP = $67.50
|
|
MB = $70.88
|
Most Recent Note - 12/2/2013 6:03:10 PM
G - Still failing to attract buying demand after slumping well below its 50 DMA line which is now downward sloping. Its prior low of $68.29 on 10/09/13 defines support above its 200 DMA line.
>>> FEATURED STOCK ARTICLE : Undercut 50-Day Moving Average Yet Found Prompt Support - 11/4/2013
View all notes |
Set NEW NOTE alert |
CANSLIM.net Company Profile |
SEC
News |
Chart |
Request a new note
C
A N
S L
I M
|
SFUN
-
NYSE
Soufun Hldgs Ltd Ads A
INTERNET - Internet Information Providers
|
$73.76
|
-2.78
-3.63% |
$75.99
|
1,962,141
130.76% of 50 DAV
50 DAV is 1,500,600
|
$77.45
-4.76%
|
10/17/2013
|
$58.02
|
PP = $53.87
|
|
MB = $56.56
|
Most Recent Note - 12/2/2013 12:52:08 PM
G - Poised for a best-ever close and challenging its all-time high with today's considerable gain. It has not formed a sound base pattern. Disciplined investors avoid chasing extended stocks. Prior highs in the $59 area define initial support to watch on pullbacks.
>>> FEATURED STOCK ARTICLE : Perched Near All-Time High After Testing Support - 11/8/2013
View all notes |
Set NEW NOTE alert |
CANSLIM.net Company Profile |
SEC
News |
Chart |
Request a new note
C
A N
S L
I M
|
SSNC
-
NASDAQ
S S & C Technologies
COMPUTER SOFTWARE and SERVICES - Application Software
|
$42.10
|
-0.17
-0.40% |
$43.42
|
284,033
90.31% of 50 DAV
50 DAV is 314,500
|
$43.80
-3.88%
|
10/22/2013
|
$39.17
|
PP = $40.04
|
|
MB = $42.04
|
Most Recent Note - 12/3/2013 1:15:54 PM
G - Slumping back near its "max buy" level with today's pullback on below average volume. Prior highs near $41 define initial support to watch above its 50 DMA line on pullbacks.
>>> FEATURED STOCK ARTICLE : Volume Totals Cooling Following Recent Volume-Driven Breakout - 11/12/2013
View all notes |
Set NEW NOTE alert |
CANSLIM.net Company Profile |
SEC
News |
Chart |
Request a new note
C
A N
S L
I M
|
SSYS
-
NASDAQ
Stratasys Ltd
COMPUTER HARDWARE - Computer Peripherals
|
$122.82
|
+0.33
0.27% |
$124.81
|
719,584
60.68% of 50 DAV
50 DAV is 1,185,800
|
$134.00
-8.34%
|
10/11/2013
|
$102.94
|
PP = $105.38
|
|
MB = $110.65
|
Most Recent Note - 11/29/2013 2:52:53 PM
G - Consolidating above support at its 50 DMA line and prior highs with volume totals cooling. More damaging losses would raise greater concerns and trigger worrisome technical sell signals. Reported earnings +13% on +153% sales revenues, below the +25% minimum earnings guideline (C criteria) raising fundamental concerns.
>>> FEATURED STOCK ARTICLE : Rallying For New Highs Despite Fundamental Flaw Raising Concern - 11/18/2013
View all notes |
Set NEW NOTE alert |
CANSLIM.net Company Profile |
SEC
News |
Chart |
Request a new note
C
A N
S L
I M
|
Symbol/Exchange
Company Name
Industry Group |
PRICE |
CHANGE
(%Change) |
Day High |
Volume
(% DAV)
(% 50 day avg vol) |
52 Wk Hi
% From Hi |
Featured
Date |
Price
Featured |
Pivot Featured |
|
Max Buy |
STMP
-
NASDAQ
Stamps.Com Inc
INTERNET - Internet Software and Services
|
$44.98
|
+0.83
1.88% |
$45.47
|
181,663
156.88% of 50 DAV
50 DAV is 115,800
|
$49.40
-8.95%
|
9/24/2013
|
$45.54
|
PP = $46.57
|
|
MB = $48.90
|
Most Recent Note - 12/4/2013 12:37:36 PM
G - Up today, but remaining below its 50 DMA line. Recently testing an upward trendline where any damaging violation may raise more serious concerns. Earnings were +24% on +7% sales revenues for the Sep '13 quarter, just below the +25% minimum earnings guideline (C criteria). See the latest FSU analysis for more details and annotated daily and weekly graphs.
>>> FEATURED STOCK ARTICLE : Upward Trendline and 50-Day Average Define Important Near-Term Support - 12/2/2013
View all notes |
Set NEW NOTE alert |
CANSLIM.net Company Profile |
SEC
News |
Chart |
Request a new note
C
A N
S L
I M
|
ULTI
-
NASDAQ
Ultimate Software Group
INTERNET - Internet Software and Services
|
$153.64
|
-0.57
-0.37% |
$153.95
|
76,721
52.41% of 50 DAV
50 DAV is 146,400
|
$162.88
-5.67%
|
10/16/2013
|
$142.95
|
PP = $151.18
|
|
MB = $158.74
|
Most Recent Note - 12/4/2013 7:09:17 PM
Y - Prior highs and its 50 DMA line define near-term support near the $151 area. Finished near the session high after quietly testing its 50 DMA line today. Volume totals have been cooling while holding its ground near its 52-week high yet below its "max buy" level.
>>> FEATURED STOCK ARTICLE : Consolidating Above 50 DMA Line and Prior Highs Defining Support - 11/21/2013
View all notes |
Set NEW NOTE alert |
CANSLIM.net Company Profile |
SEC
News |
Chart |
Request a new note
C
A N
S L
I M
|
VRX
-
NYSE
Valeant Pharmaceuticals
DRUGS - Drug Manufacturers - Other
|
$107.90
|
-1.29
-1.18% |
$109.55
|
1,096,868
97.36% of 50 DAV
50 DAV is 1,126,600
|
$115.40
-6.50%
|
9/11/2013
|
$100.26
|
PP = $105.50
|
|
MB = $110.78
|
Most Recent Note - 12/4/2013 7:06:40 PM
Y - Still consolidating in a very tight range near its 50 DMA line. Recent lows in the $102 area define near-term support where a violation may trigger a technical sell signal. Resilient after it reported earnings +24% on +74% sales revenues for the Sep '13 quarter, a notch below the +25% minimum guideline (C criteria).
>>> FEATURED STOCK ARTICLE : Recent Lows Define Support to Watch Below 50 Day Average - 11/15/2013
View all notes |
Set NEW NOTE alert |
CANSLIM.net Company Profile |
SEC
News |
Chart |
Request a new note
C
A N
S L
I M
|
YNDX
-
NASDAQ
Yandex N V Class A
INTERNET - Internet Information Providers
|
$40.10
|
+0.25
0.61% |
$40.30
|
2,062,176
79.73% of 50 DAV
50 DAV is 2,586,600
|
$42.00
-4.54%
|
11/27/2013
|
$39.61
|
PP = $42.10
|
|
MB = $44.21
|
Most Recent Note - 12/3/2013 12:54:47 PM
Y - Challenged its 52-week high earlier today with above average volume behind its gain approaching the new pivot point cited based on its 10/22/13 high plus 10 cents. Subsequent volume-driven gains above the pivot point may trigger a new (or add-on) technical buy signal. Prior lows ($35.59 on 11/08/13 and $34.31 on 10/08/13) defines the next important chart support levels to watch. See the latest FSU analysis for more details and annotated daily and weekly graphs.
>>> FEATURED STOCK ARTICLE : Forming New Base Pattern With Little Resistance Remaining - 11/27/2013
View all notes |
Set NEW NOTE alert |
CANSLIM.net Company Profile |
SEC
News |
Chart |
Request a new note
C
A N
S L
I M
|
|
|
|
THESE ARE NOT BUY RECOMMENDATIONS!
Comments contained in the body of this report are technical
opinions only. The material herein has been obtained
from sources believed to be reliable and accurate, however,
its accuracy and completeness cannot be guaranteed.
This site is not an investment advisor, hence it does
not endorse or recommend any securities or other investments.
Any recommendation contained in this report may not
be suitable for all investors and it is not to be deemed
an offer or solicitation on our part with respect to
the purchase or sale of any securities. All trademarks,
service marks and trade names appearing in this report
are the property of their respective owners, and are
likewise used for identification purposes only.
This report is a service available
only to active Paid Premium Members.
You may opt-out of receiving report notifications
at any time. Questions or comments may be submitted
by writing to Premium Membership Services 665 S.E. 10 Street, Suite 201 Deerfield Beach, FL 33441-5634 or by calling 1-800-965-8307
or 954-785-1121.
|
|
|

