You are not logged in.
This means you
CAN ONLY VIEW reports that were published prior to Monday, April 14, 2025.
You
MUST UPGRADE YOUR MEMBERSHIP if you want to see any current reports.
AFTER MARKET UPDATE - FRIDAY, DECEMBER 4TH, 2009
Previous After Market Report Next After Market Report >>>
|
|
|
|
DOW |
+22.75 |
10,388.90 |
+0.22% |
|
Volume |
1,573,747,850 |
+39% |
|
Volume |
2,359,994,360 |
+15% |
|
NASDAQ |
+21.21 |
2,194.35 |
+0.98% |
|
Advancers |
2,166 |
69% |
|
Advancers |
2,016 |
70% |
|
S&P 500 |
+6.06 |
1,105.98 |
+0.55% |
|
Decliners |
867 |
28% |
|
Decliners |
710 |
25% |
|
Russell 2000 |
+14.01 |
602.79 |
+2.38% |
|
52 Wk Highs |
287 |
|
|
52 Wk Highs |
129 |
|
|
S&P 600 |
+7.21 |
317.55 |
+2.32% |
|
52 Wk Lows |
7 |
|
|
52 Wk Lows |
31 |
|
|
 |
Major Averages Churn Higher After Eventful Week
Adam Sarhan, Contributing Writer,
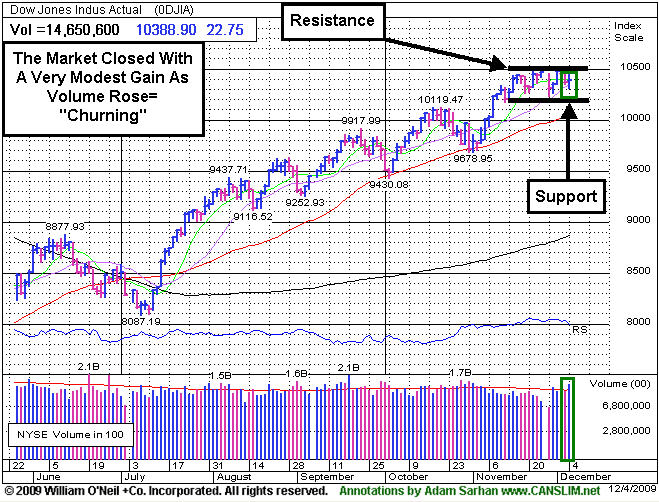
Stocks ended the week higher as investors digested a slew of economic data. On Friday, stocks seesawed higher after the government released a stronger than expected jobs report. Volume, an important indicator of institutional sponsorship, was higher than Thursday's levels on both major exchanges. The fact that the major averages closed in the lower half of their daily ranges on heavier volume, however, could be interpreted as churning - which is not a healthy sign. Advancers led decliners by more than a 2-to-1 ratio on the NYSE and by nearly a 3-to-1 ratio on the Nasdaq exchange. There were 45 high-ranked companies from the CANSLIM.net Leaders List that made a new 52-week high and appeared on the CANSLIM.net BreakOuts Page, one more than the total of 44 issues that appeared on the prior session. Leadership among high-ranked growth stocks had dried up in recent weeks, so the expansion in new highs this week has been a welcome improvement. New 52-week highs solidly outnumbered new 52-week lows on the NYSE and on the Nasdaq exchange.
On Monday, stocks spent most of the session in the red but buyers showed up in the final hour which helped the major averages close higher on the day. Monday was the first full trading session since the Dubai news spread during Thanksgiving. It was encouraging to see the major averages rally as investors largely dismissed the Dubai news. Elsewhere, the Chinese government reiterated its stance regarding its stimulus package after India announced its economy grew at a very healthy rate of +7.9%, which topped estimates. In the US, the National Retail Federation released a report that showed that holiday traffic was up from the same period last year, but the average shopper spent $343.31 in stores and online over the Thanksgiving holiday weekend, less than the $372.57 spent last year. The group reaffirmed its forecast for a -1% decline in spending for the holiday season.
On Tuesday, stocks rallied around the globe after Dubai World said it took "constructive" steps to restructure nearly half its debt. HSBC released a report showing that Chinese manufacturing, rose in November. This echoed the Institute for Supply Management (ISM)'s manufacturing index. The ISM said US manufacturing rose in November for a fourth consecutive month which is a healthy data point for the global recovery. Turning to the housing market, the National Association of Realtors said the number of contracts to buy previously owned homes in the US unexpectedly rose +3.7% in October.
Stocks ended mixed on Wednesday after ADP Employer Services, the country's largest private payrolls company, said US employers slashed -169,000 jobs last month. This topped the Street's forecast for a reading of -150,000 and led many to question the government's official reading which was released on Friday. Before Thursday's open, the Labor Department said that 457,000 jobless claims were reported last week which was just under the Street's estimates. Stocks were up for most of the day but a late burst of selling sent stocks lower in the final hour which was not a healthy sign. Finally, before Friday's opening bell, the Labor Department released a much stronger than expected jobs report. The report showed that US employers "only" shed -11,000 jobs last month (not a typo) while the unemployment rate fell to -10%. This smashed the Street's estimates for a reading of over -100,000 and analysts believed that the unemployment rate would hold steady at +10.2%.
Initially, the market rallied on the jobs report but sellers quickly emerged which put pressure on the market. It was disconcerting to see a several high profile leaders such as Apple Inc. (AAPL -1.61%) and Netflix (NFLX -3.04%) get smacked on Friday. Apple, one the strongest stocks since the March lows, triggered a technical sell signal when it violated its well defined 8-month upward trendline and its 50 DMA line on Friday. This was the first time since the March low that Apple closed below support (its upward trendline and 50 DMA line). Volume surged as the stocks fell which indicated that large institutional investors were unloading their positions, not Aunt Mary or Uncle Bob. The dollar rallied sharply after the jobs report was released which put pressure on a slew of commodities, mainly gold. Gold plunged sharply today which dragged a slew of gold related stocks. Remember that gold has been one of the strongest performing groups in recent weeks and now that it has fallen, a new group will need to emerge to carry this market higher. That coupled with the recent questionable action in the major averages and the dearth of leadership suggests this rally is "under pressure" which means caution is advised.
PICTURED: The Dow Jones Industrial Average closed with a modest gain as volume rose which equals churning.
|
|
|
 |
Dollar's Strength Prompts Sharp Pullback For Gold & Silver Index
Kenneth J. Gruneisen - Passed the CAN SLIM® Master's Exam
Strength in the US dollar contributed to the standout decline for the Gold & Silver Index ($XAU -5.48%), but after a great streak of gains such a pullback was eventually bound to happen. Weakness in the Retail Index ($RLX -1.19%) and energy shares created a drag on the major averages as the Oil Services Index ($OSX -0.70%) and Integrated Oil Index ($XOI -0.54%) also ended Friday's session in the red. however, financial shares made a very important positive contribution as the week came to a close, with the Bank Index ($BKX +2.19%) and Broker/Dealer Index ($XBD +2.27%) posting solid gains. Healthy gains from the Healthcare Index ($HMO +0.95%) and a positive bias throughout the technology sector also underpinned the rally while the Networking Index ($NWX +2.01%) and Semiconductor Index ($SOX +2.06%) outpaced the Biotechnology Index ($BTK +0.25%) and the Internet Index ($IIX +0.93%).
Charts courtesy www.stockcharts.com
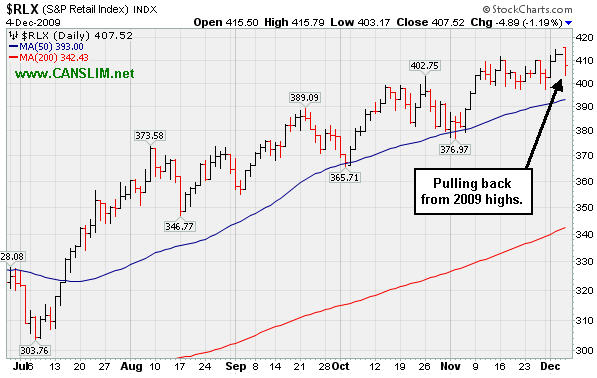
PICTURED: The Retail Index ($RLX -1.19%) is pulling back from 2009 highs, but still in very healthy shape. It found great support near its 50-day moving average line throughout the recent rally.
| Oil Services |
$OSX |
185.70 |
-1.31 |
-0.70% |
+52.98% |
| Healthcare |
$HMO |
1,344.84 |
+12.64 |
+0.95% |
+40.06% |
| Integrated Oil |
$XOI |
1,068.43 |
-5.80 |
-0.54% |
+9.06% |
| Semiconductor |
$SOX |
335.21 |
+6.77 |
+2.06% |
+57.99% |
| Networking |
$NWX |
228.10 |
+4.50 |
+2.01% |
+58.52% |
| Internet |
$IIX |
227.99 |
+2.11 |
+0.93% |
+70.43% |
| Broker/Dealer |
$XBD |
115.36 |
+2.56 |
+2.27% |
+48.91% |
| Retail |
$RLX |
407.52 |
-4.89 |
-1.19% |
+45.93% |
| Gold & Silver |
$XAU |
181.96 |
-10.55 |
-5.48% |
+46.92% |
| Bank |
$BKX |
44.24 |
+0.95 |
+2.19% |
-0.18% |
| Biotech |
$BTK |
909.45 |
+2.24 |
+0.25% |
+40.53% |
|
|
|
 |
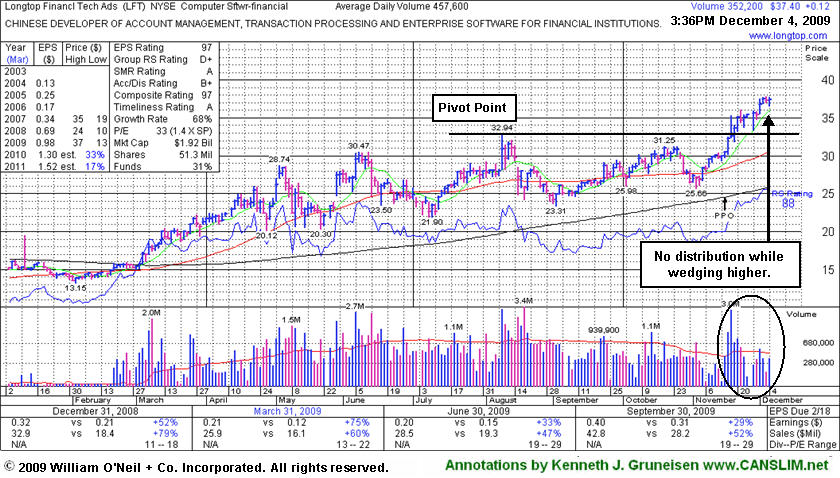
Extended From Sound Base After Wedging Higher
Kenneth J. Gruneisen - Passed the CAN SLIM® Master's Exam
Longtop Financl Tech Ads (LFT +$0.18 or +0.48% to $37.46) has been wedging higher, encountering no distributional pressure. It is extended more than +5% above its pivot point and above its "max buy" price, so disciplined investors would avoid chasing it. Recent highs in the $31 area are an initial support level to watch.
A proposed offering of additional shares on 11/16/09 seems well received by the market. Its fundamentals remain strong. The number of top-rated funds owning an interest in its shares rose from 20 funds in Dec '08 to 50 funds in Sept '09, which is reassuring concerning the L criteria. It has reported strong annual and quarterly earnings increases (good concerning the C & A criteria) backed by strong sales revenues increases. Return on Equity of +20% is above the +17% guideline. Upward progress can often be hindered by additional share offerings for the near-term, yet institutional investors typically increase their interest through the process. LFT was first featured at $22.19 on Thursday, April 02, 2009 in the CANSLIM.net Mid Day Breakouts Report (read here).
|
|
|
Color Codes Explained :
Y - Better candidates highlighted by our
staff of experts.
G - Previously featured
in past reports as yellow but may no longer be buyable under the
guidelines.
***Last / Change / Volume quote data in this table corresponds with the timestamp on the note***
Symbol/Exchange
Company Name
Industry Group |
Last |
Chg. |
Vol
% DAV |
Date Featured |
Price Featured |
Latest Pivot Point
Featured |
Status |
| Latest Max Buy Price |
ARST
-
|
$24.75
|
+0.77
|
1,862,642
338% DAV
551,500
|
9/1/2009
(Date
Featured) |
$19.91
(Price
Featured) |
PP = $20.90 |
G |
| MB = $21.95 |
Most Recent Note - 12/4/2009 4:18:41 PM
G - Positively reversed today after early weakness retested the week's lows following an analyst downgrade. Finding support and trading near its 50 DMA line, it has shown resilience this week after recently noted technical sell signals. ARST was first featured in yellow at $19.91 in the 9/01/09 mid-day report with an annotated daily graph (read here).
>>> The latest Featured Stock Update with an annotated graph appeared on 12/3/2009. click here.
|
|
C
A
S
I |
News |
Chart |
SEC
View all notes Alert
me of new notes
Company
Profile
|
ASIA
-
|
$24.96
|
-0.08
|
1,681,801
155% DAV
1,084,300
|
10/14/2009
(Date
Featured) |
$23.05
(Price
Featured) |
PP = $22.19 |
G |
| MB = $23.30 |
Most Recent Note - 12/4/2009 4:21:29 PM
G - Held its ground today after a negative reversal on 12/03/09 following early gains for a new 52-week high. Featured 10/14/09 in the mid-day report (read here) as it gapped up for a new 52-week high with 5 times average volume, triggering a technical buy signal by blasting above its pivot point. First featured in the August 2009 CANSLIM.net News (read here).
>>> The latest Featured Stock Update with an annotated graph appeared on 11/24/2009. click here.
|
|
C
A
S
I |
News |
Chart |
SEC
View all notes Alert
me of new notes
Company
Profile
|
BIDU
- NASDAQ
Baidu Inc Ads
INTERNET - Internet Information Providers
|
$425.37
|
-2.52
|
1,509,399
70% DAV
2,143,500
|
9/8/2009
(Date
Featured) |
$351.80
(Price
Featured) |
PP = $368.59 |
G |
| MB = $387.02 |
Most Recent Note - 12/4/2009 4:25:48 PM
G - Since quietly rallying to new highs in November it has stalled, but not yet formed a new sound base. It has been consolidating in a very tight trading range near all-time highs, and in the past it has proven resilient near its 50 DMA line. BIDU traded up as much as +23% from its price when featured in yellow in the 9/08/09 Mid-Day BreakOuts Report (read here).
>>> The latest Featured Stock Update with an annotated graph appeared on 11/25/2009. click here.
|
|
C
A
S
I |
News |
Chart |
SEC
View all notes Alert
me of new notes
Company
Profile
|
CAAS
- NASDAQ
China Automotive Systems
AUTOMOTIVE - Auto Parts
|
$20.82
|
-0.29
|
1,113,940
230% DAV
485,200
|
11/30/2009
(Date
Featured) |
$18.84
(Price
Featured) |
PP = $17.62 |
G |
| MB = $18.50 |
Most Recent Note - 12/4/2009 4:28:13 PM
G - Gapped up today and hit a new all-time high, then negatively reversed. It is extended from a sound base under the investment system rules. The Chinese maker of power steering systems was rising from an advanced "3-weeks tight" type of chart pattern as it showed up in yellow in the 11/30/09 mid-day report (read here). Recent quarters show accelerating sales revenues and earnings increases, and it has a good annual earnings history.
>>> The latest Featured Stock Update with an annotated graph appeared on 11/30/2009. click here.
|
|
C
A
S
I |
News |
Chart |
SEC
View all notes Alert
me of new notes
Company
Profile
|
CACC
- NASDAQ
Credit Acceptance Corp
FINANCIAL SERVICES - Credit Services
|
$34.52
|
+0.92
|
25,325
68% DAV
37,100
|
9/29/2009
(Date
Featured) |
$33.48
(Price
Featured) |
PP = $37.10 |
Y |
| MB = $38.96 |
Most Recent Note - 12/4/2009 4:31:05 PM
Y - Gapped up for a small gain today and closed above its 50 DMA line, showing some resilience near that important short-term average line after encountering distributional pressure this week. After a 7-week flat base it is continuing its consolidation above prior chart highs in the $32 area. The Finance - Consumer/Commercial Loans firm has maintained a great track record of annual and quarterly sales revenues and earnings increases. It was featured on 9/29/09 in yellow in the mid-day report (read here).
>>> The latest Featured Stock Update with an annotated graph appeared on 11/27/2009. click here.
|
|
C
A
S
I |
News |
Chart |
SEC
View all notes Alert
me of new notes
Company
Profile
|
CRM
- NYSE
Salesforce.com Inc
INTERNET - Internet Software & Services
|
$65.95
|
+1.26
|
1,461,347
89% DAV
1,644,600
|
8/16/2009
(Date
Featured) |
$47.12
(Price
Featured) |
PP = $45.59 |
G |
| MB = $47.87 |
Most Recent Note - 12/4/2009 4:33:48 PM
G - Gain today on light volume, consolidating above important support at its 50 DMA line near its 52 week high. It has not yet formed a sound new base, and recent distributional pressure raised concerns.
>>> The latest Featured Stock Update with an annotated graph appeared on 11/23/2009. click here.
|
|
C
A
S
I |
News |
Chart |
SEC
View all notes Alert
me of new notes
Company
Profile
|
CTRP
- NASDAQ
Ctrip.com Intl Ltd Adr
LEISURE - Resorts & Casinos
|
$75.26
|
-1.37
|
1,808,441
167% DAV
1,081,700
|
12/1/2009
(Date
Featured) |
$75.38
(Price
Featured) |
PP = $73.91 |
Y |
| MB = $77.61 |
Most Recent Note - 12/4/2009 4:37:02 PM
Y - Loss today on higher volume was indicative of distributional pressure after recently trading above its "max buy" price of $77.60. Featured on 12/01/09 in yellow in the mid-day report (read here). It triggered a technical buy signal as it rose with more than +50% above average volume from a brief consolidation resembling a "high-tight-flag" pattern which it formed after repairing a late-October breach of its 50 DMA line. Fundamentally, its sales revenues and earnings increases have shown acceleration in the 3 most recent quarterly comparisons and rose above the +25% guideline. Based on weak technical action it was dropped from the Featured Stocks list on 6/10/08, when it closed at $49.84, yet it has rebounded very impressively from subsequent lows in the $16 area.
>>> The latest Featured Stock Update with an annotated graph appeared on 12/1/2009. click here.
|
|
C
A
S
I |
News |
Chart |
SEC
View all notes Alert
me of new notes
Company
Profile
|
HEAT
-
|
$14.11
|
-1.23
|
2,283,853
311% DAV
733,900
|
11/17/2009
(Date
Featured) |
$12.00
(Price
Featured) |
PP = $12.61 |
G |
| MB = $13.24 |
Most Recent Note - 12/4/2009 4:38:41 PM
G - Considerable loss today on heavy volume was indicative of distributional pressure, and at intra-day lows it dipped near its "may buy" level. Pulled back from new all-time highs this week after having risen more than +20% in the first 2-3 weeks following its technical breakout. It found support near its pivot point during its recent consolidation, giving investors an opportunity to accumulate shares without chasing it and buying it "extended" from its latest base. First featured in yellow in the 11/17/09 mid-day report (read here) when technically rising from a "double bottom" base, reaching a new all-time high.
>>> The latest Featured Stock Update with an annotated graph appeared on 12/2/2009. click here.
|
|
C
A
S
I |
News |
Chart |
SEC
View all notes Alert
me of new notes
Company
Profile
|
LFT
-
|
$37.46
|
+0.18
|
397,080
87% DAV
457,600
|
11/17/2009
(Date
Featured) |
$31.77
(Price
Featured) |
PP = $33.04 |
G |
| MB = $34.69 |
Most Recent Note - 12/4/2009
G - Small gain today on light volume. Perched near all-time highs, extended after recently rising from a choppy 14-week base. Prior chart highs in the $31 area are an initial support level to watch. A proposed offering of additional shares on 11/16/09 seems well received by the market. Its fundamentals remain strong.
>>> The latest Featured Stock Update with an annotated graph appeared on 12/4/2009. click here.
|
|
C
A
S
I |
News |
Chart |
SEC
View all notes Alert
me of new notes
Company
Profile
|
|
|
|
THESE ARE NOT BUY RECOMMENDATIONS!
Comments contained in the body of this report are technical
opinions only. The material herein has been obtained
from sources believed to be reliable and accurate, however,
its accuracy and completeness cannot be guaranteed.
This site is not an investment advisor, hence it does
not endorse or recommend any securities or other investments.
Any recommendation contained in this report may not
be suitable for all investors and it is not to be deemed
an offer or solicitation on our part with respect to
the purchase or sale of any securities. All trademarks,
service marks and trade names appearing in this report
are the property of their respective owners, and are
likewise used for identification purposes only.
This report is a service available
only to active Paid Premium Members.
You may opt-out of receiving report notifications
at any time. Questions or comments may be submitted
by writing to Premium Membership Services 665 S.E. 10 Street, Suite 201 Deerfield Beach, FL 33441-5634 or by calling 1-800-965-8307
or 954-785-1121.
|
|
|


