You are not logged in.
This means you
CAN ONLY VIEW reports that were published prior to Monday, April 14, 2025.
You
MUST UPGRADE YOUR MEMBERSHIP if you want to see any current reports.
AFTER MARKET UPDATE - FRIDAY, DECEMBER 2ND, 2011
Previous After Market Report Next After Market Report >>>
|
|
|
|
DOW |
-0.61 |
12,019.42 |
-0.01% |
|
Volume |
877,407,140 |
+2% |
|
Volume |
1,610,713,880 |
-9% |
|
NASDAQ |
+0.73 |
2,626.93 |
+0.03% |
|
Advancers |
1,823 |
58% |
|
Advancers |
1,516 |
57% |
|
S&P 500 |
-0.30 |
1,244.28 |
-0.02% |
|
Decliners |
1,200 |
38% |
|
Decliners |
1,000 |
38% |
|
Russell 2000 |
+4.27 |
735.02 |
+0.58% |
|
52 Wk Highs |
115 |
|
|
52 Wk Highs |
44 |
|
|
S&P 600 |
+1.67 |
408.73 |
+0.41% |
|
52 Wk Lows |
14 |
|
|
52 Wk Lows |
42 |
|
|
 |
Indices Finished Big Up Week In Better Technical Shape
Kenneth J. Gruneisen - Passed the CAN SLIM® Master's Exam
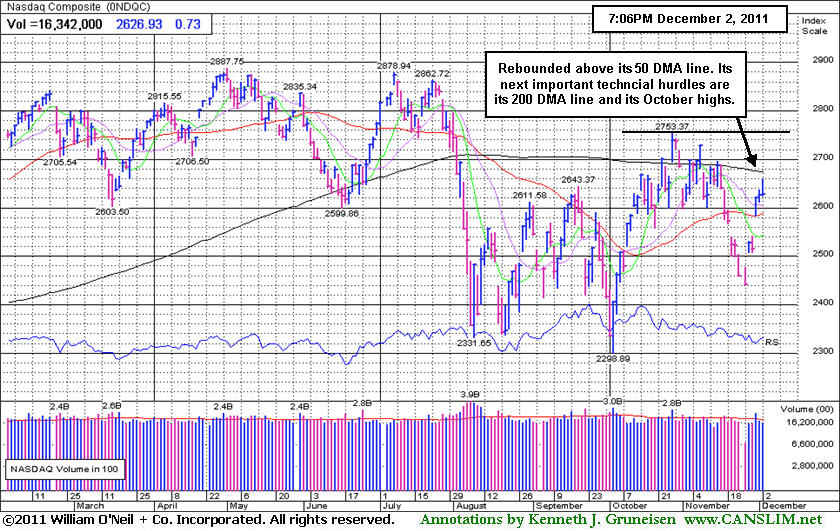
Bulls took another breather, finishing quietly after a stronger start on Friday as the markets capped off the S&P 500 Index's largest weekly rally since March of 2009. For the week, the Dow Jones Industrial Average was up +7.01%, the S&P 500 Index gained +7.39%, and the Nasdaq Composite Index surged +7.59%. Advancers beat decliners by about 3-2 on the NYSE and on the Nasdaq exchange. Volume was reported slightly higher on the NYSE, but lower on the Nasdaq exchange, versus the prior session. New 52-week highs outnumbered new 52-week lows on the NYSE and also on the Nasdaq exchange, marking the first time since October 28th that both exchanges produced more new highs than lows. There were 53 high-ranked companies from the CANSLIM.net Leaders List that made new 52-week highs and appeared on the CANSLIM.net BreakOuts Page, up from the prior session total of 47 stocks. However, there were gains for 7 of the 16 high-ranked companies currently included on the Featured Stocks Page.
Economic data was the focus today. The non-farm payrolls report showed that payrolls climbed 120,000, after a revised 100,000 rise in October. As a result, the unemployment rate dropped to 8.6% from 9%. Europe also garnered attention as Germany and France pushed for strict enforcement of budget rules to counter the region's debt crisis. In addition, Bloomberg reported that the ECB may lend as much as $270 billion to the IMF to ease the sovereign debt crisis.
Financials led the market. JPMorgan Chase & Co (JPM +6.14%) was the biggest winner in the Dow, and Morgan Stanley (MS +6.96%) also rallied for a big gain. Stocks staged a rally this week as global central banks lowered the cost of dollar funding and as China decreased the bank reserve requirement to shore up lending.
Year-to-date, the Dow turned back into the black and is now up +3.82%. The S&P 500 rebounded and is only negative by -1.06%, while the Nasdaq Composite Index is off -0.98%.
Our monthly newsletter CANSLIM.net News will be published soon with an informative review of current market conditions, leading groups, and best buy candidates. Via the Premium Member Homepage links to all prior reports and webcasts are always available.
PICTURED: The Nasdaq Composite Index has rebounded above its 50-day moving average (DMA) line. Its next important technical hurdles are its 200 DMA line and its October highs, with additional resistance due to overhead supply up to the 2,880 area at the year's highs.
|
 Kenneth J. Gruneisen started out as a licensed stockbroker in August 1987, a couple of months prior to the historic stock market crash that took the Dow Jones Industrial Average down -22.6% in a single day. He has published daily fact-based fundamental and technical analysis on high-ranked stocks online for two decades. Through FACTBASEDINVESTING.COM, Kenneth provides educational articles, news, market commentary, and other information regarding proven investment systems that work in good times and bad.
Comments contained in the body of this report are technical opinions only and are not necessarily those of Gruneisen Growth Corp. The material herein has been obtained from sources believed to be reliable and accurate, however, its accuracy and completeness cannot be guaranteed. Our firm, employees, and customers may effect transactions, including transactions contrary to any recommendation herein, or have positions in the securities mentioned herein or options with respect thereto. Any recommendation contained in this report may not be suitable for all investors and it is not to be deemed an offer or solicitation on our part with respect to the purchase or sale of any securities. |
|
 |
Financial and Retail Groups Rose; Defensive Groups Fell
Kenneth J. Gruneisen - Passed the CAN SLIM® Master's Exam
The Retail Index ($RLX +0.44%) and financial stocks were a positive influence as the Broker/Dealer Index ($XBD +1.78%) and Bank Index ($BKX +1.87%) posted solid gains. Meanwhile, defensive groups clearly lagged on Friday as the Gold & Silver Index ($XAU -2.61%) and Healthcare Index ($HMO -0.71%) lost ground. The tech sector also had a negative drift as the Biotechnology Index ($BTK -1.14%), Internet Index ($IIX -0.22%), and Semiconductor Index ($SOX -0.20%) lost ground and only the Networking Index ($NWX +1.05%) posted a gain. The Oil Services Index ($OSX -0.29%) and Integrated Oil Index ($XOI +0.19%) were mixed and little changed.
Charts courtesy www.stockcharts.com
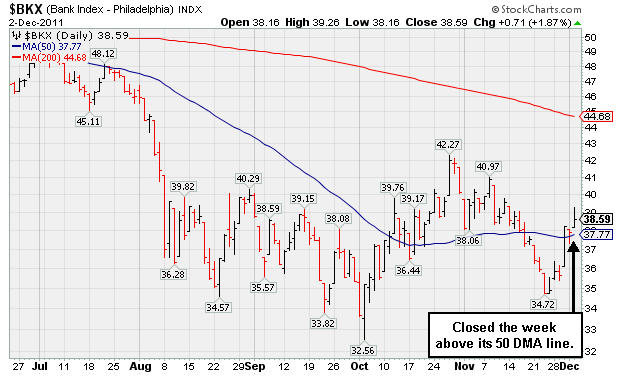
PICTURED 1: The Bank Index ($BKX +1.87%) closed the week above its 50-day moving average (DMA) line, helping its technical stance.
Charts courtesy www.stockcharts.com
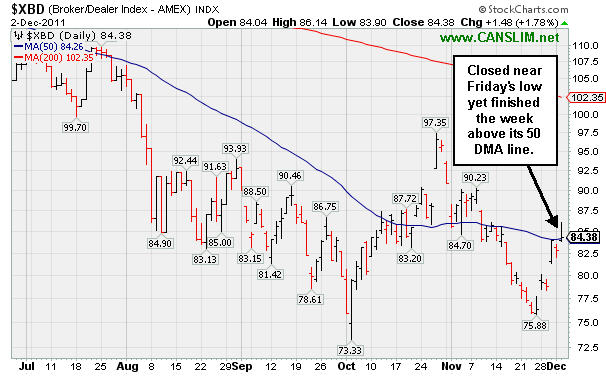
PICTURED 2: The Broker/Dealer Index ($XBD +1.78%) and closed the week above its 50-day moving average (DMA) line, helping its technical stance.
| Oil Services |
$OSX |
230.15 |
-0.68 |
-0.29% |
-6.11% |
| Healthcare |
$HMO |
2,293.74 |
-16.39 |
-0.71% |
+35.56% |
| Integrated Oil |
$XOI |
1,224.77 |
+2.27 |
+0.19% |
+0.96% |
| Semiconductor |
$SOX |
374.57 |
-0.74 |
-0.20% |
-9.05% |
| Networking |
$NWX |
226.87 |
+2.36 |
+1.05% |
-19.13% |
| Internet |
$IIX |
287.03 |
-0.64 |
-0.22% |
-6.73% |
| Broker/Dealer |
$XBD |
84.38 |
+1.48 |
+1.78% |
-30.56% |
| Retail |
$RLX |
532.88 |
+3.10 |
+0.59% |
+4.82% |
| Gold & Silver |
$XAU |
202.28 |
-5.42 |
-2.61% |
-10.72% |
| Bank |
$BKX |
38.64 |
+0.76 |
+2.01% |
-25.99% |
| Biotech |
$BTK |
1,069.06 |
-12.28 |
-1.14% |
-17.61% |
|
|
|
 |
Late Stage Set-Up For Previous Big Gainer
Kenneth J. Gruneisen - Passed the CAN SLIM® Master's Exam
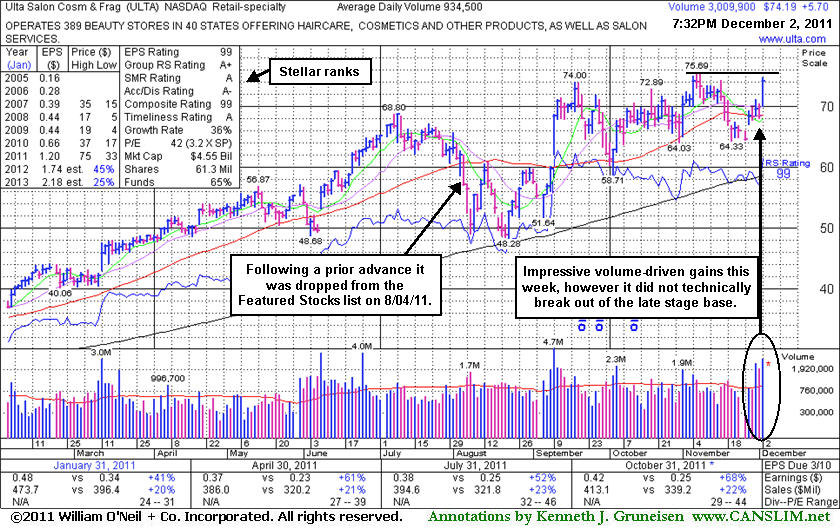
Ulta Salon Cosmetics & Fragrance, Inc. (ULTA +$5.70 or +8.32% to $74.19) gapped up today was highlighted in yellow in the mid-day report with a pivot point based on its 52-week high plus ten cents. It rallied within close striking distance of a new 52-week high. The recent volume-driven gains are impressive, but it did not trigger a new technical buy signal. No resistance remains due to overhead supply and it may be working on a late-stage "square box" type base pattern. Recent lows in the $64 area define near term support below its 50 DMA line.
Its fundamentals (C and A criteria) remain strong. Its last appearance in this FSU section was on 8/04/11 with analysis and an annotated graph under the headline, "Profit Should Be Protected After Featured Stock Produced Great Gains." The damaging loss on 8/04/11 violated its 50-day moving average (DMA) line, raising concerns and triggering a technical sell signal. It was be dropped from the Featured Stocks list. Since first featured in yellow in the 3/12/10 mid-day report, in just over 16 months it had traded up as much as +200%.
The number of top-rated funds with an ownership interest has grown from 376 funds in Dec '10 to 504 funds as of Sep '11 which is an encouraging sign of increasing institutional interest (the I criteria). Management's reported 7% ownership stake is down considerably after the latest offering and since last noted. Its strong quarterly earnings increases above the +25% guideline in the 8 latest comparisons satisfies the C criteria, and its solid annual earnings (A criteria) history is also very reassuring.
 |
|
|
Color Codes Explained :
Y - Better candidates highlighted by our
staff of experts.
G - Previously featured
in past reports as yellow but may no longer be buyable under the
guidelines.
***Last / Change / Volume data in this table is the closing quote data***
Symbol/Exchange
Company Name
Industry Group |
PRICE |
CHANGE
(%Change) |
Day High |
Volume
(% DAV)
(% 50 day avg vol) |
52 Wk Hi
% From Hi |
Featured
Date |
Price
Featured |
Pivot Featured |
|
Max Buy |
ADS
-
NYSE
Alliance Data Sys Corp
COMPUTER SOFTWARE and SERVICES - Information and Delivery Service
|
$104.85
|
+1.52
1.47% |
$105.24
|
766,848
80.73% of 50 DAV
50 DAV is 949,900
|
$107.18
-2.17%
|
10/21/2011
|
$97.94
|
PP = $101.15
|
|
MB = $106.21
|
Most Recent Note - 11/30/2011 11:54:10 AM
Y - Rebounding back above its 50 DMA line and rising toward prior highs. Color code is changed to yellow (no new pivot point cited) based on its resilience and another gap up today.
>>> The latest Featured Stock Update with an annotated graph appeared on 11/17/2011. Click here.
View all notes |
Alert me of new notes |
CANSLIM.net Company Profile |
SEC |
Zacks Reports |
StockTalk |
News |
Chart |
Request a new note
C
A N
S L
I M


|
ALXN
-
NASDAQ
Alexion Pharmaceuticals
DRUGS - Drug Manufacturers - Other
|
$66.98
|
-2.28
-3.29% |
$69.72
|
1,216,659
79.97% of 50 DAV
50 DAV is 1,521,300
|
$70.42
-4.88%
|
11/30/2011
|
$68.66
|
PP = $70.52
|
|
MB = $74.05
|
 Most Recent Note - 12/2/2011 7:55:18 PM
Y - Pulled back today finishing -4.9% off its 52 week high. A new pivot point was cited based on its 52-week high plus ten cents after forming an orderly flat base pattern. Volume-driven gains are needed to trigger a new (or add-on) technical buy signal.
>>> The latest Featured Stock Update with an annotated graph appeared on 11/14/2011. Click here.
View all notes |
Alert me of new notes |
CANSLIM.net Company Profile |
SEC |
Zacks Reports |
StockTalk |
News |
Chart |
Request a new note
C
A N
S L
I M
|
CELG
-
NASDAQ
Celgene Corp
DRUGS - Drug Manufacturers - Major
|
$61.21
|
-1.55
-2.47% |
$63.19
|
4,131,981
107.56% of 50 DAV
50 DAV is 3,841,700
|
$68.25
-10.32%
|
9/16/2011
|
$61.21
|
PP = $62.59
|
|
MB = $65.72
|
Most Recent Note - 12/2/2011 7:56:45 PM
G - Slumped further below its 50 DMA line with a loss today on higher volume indicative of distributional pressure. Gains above its short-term average are needed for its outlook to improve. See the latest FSU analysis for more details and a new annotated graph.
>>> The latest Featured Stock Update with an annotated graph appeared on 12/1/2011. Click here.
View all notes |
Alert me of new notes |
CANSLIM.net Company Profile |
SEC |
Zacks Reports |
StockTalk |
News |
Chart |
Request a new note
C
A N
S L
I M
|
FEIC
-
NASDAQ
F E I Co
ELECTRONICS - Diversified Electronics
|
$40.34
|
-0.05
-0.12% |
$41.43
|
245,647
56.22% of 50 DAV
50 DAV is 436,900
|
$42.25
-4.52%
|
10/28/2011
|
$40.31
|
PP = $40.88
|
|
MB = $42.92
|
Most Recent Note - 11/30/2011 11:45:16 AM
G - Gapped up today, rebounding toward prior highs. It faces resistance due to overhead supply up through the $42 area.
>>> The latest Featured Stock Update with an annotated graph appeared on 11/25/2011. Click here.
View all notes |
Alert me of new notes |
CANSLIM.net Company Profile |
SEC |
Zacks Reports |
StockTalk |
News |
Chart |
Request a new note
C
A N
S L
I M
|
GNC
-
NYSE
G N C Holdings Inc
RETAIL - Drug Stores
|
$27.86
|
+0.17
0.61% |
$28.37
|
631,265
49.15% of 50 DAV
50 DAV is 1,284,300
|
$28.50
-2.25%
|
10/26/2011
|
$24.60
|
PP = $24.80
|
|
MB = $26.04
|
Most Recent Note - 11/30/2011 7:23:05 PM
G - Today it traded heavy volume but didn't make meaningful price progress while churning near its all-time high. Prior chart highs in the $25-26 area define initial support to watch on pullbacks.
>>> The latest Featured Stock Update with an annotated graph appeared on 11/21/2011. Click here.
View all notes |
Alert me of new notes |
CANSLIM.net Company Profile |
SEC |
Zacks Reports |
StockTalk |
News |
Chart |
Request a new note
C
A N
S L
I M
|
Symbol/Exchange
Company Name
Industry Group |
PRICE |
CHANGE
(%Change) |
Day High |
Volume
(% DAV)
(% 50 day avg vol) |
52 Wk Hi
% From Hi |
Featured
Date |
Price
Featured |
Pivot Featured |
|
Max Buy |
HMSY
-
NASDAQ
H M S Holdings Corp
COMPUTER SOFTWARE and SERVICES - Healthcare Information Service
|
$29.92
|
+0.31
1.05% |
$30.72
|
574,809
84.71% of 50 DAV
50 DAV is 678,600
|
$31.99
-6.47%
|
10/27/2011
|
$26.44
|
PP = $28.37
|
|
MB = $29.79
|
Most Recent Note - 12/1/2011 6:51:08 PM
G - Pulled back today on light volume and finished near its "max buy" level. Prior highs in the $27-28 area acted as support during the recent pullback. See the latest FSU analysis for more details and a new annotated weekly graph.
>>> The latest Featured Stock Update with an annotated graph appeared on 11/30/2011. Click here.
View all notes |
Alert me of new notes |
CANSLIM.net Company Profile |
SEC |
Zacks Reports |
StockTalk |
News |
Chart |
Request a new note
C
A N
S L
I M
|
ISRG
-
NASDAQ
Intuitive Surgical Inc
HEALTH SERVICES - Medical Appliances and Equipment
|
$433.85
|
-1.74
-0.40% |
$445.70
|
514,956
124.78% of 50 DAV
50 DAV is 412,700
|
$449.06
-3.39%
|
10/19/2011
|
$424.69
|
PP = $415.29
|
|
MB = $436.05
|
Most Recent Note - 11/30/2011 7:26:55 PM
Y - Gapped up again today for a solid gain on above average. Found support recently well above its 50 DMA line near prior chart highs.
>>> The latest Featured Stock Update with an annotated graph appeared on 11/15/2011. Click here.
View all notes |
Alert me of new notes |
CANSLIM.net Company Profile |
SEC |
Zacks Reports |
StockTalk |
News |
Chart |
Request a new note
C
A N
S L
I M
|
MG
-
NYSE
Mistras Group Inc
DIVERSIFIED SERVICES - Bulding and Faci;ity Management Services
|
$23.61
|
+0.44
1.90% |
$23.71
|
142,784
68.94% of 50 DAV
50 DAV is 207,100
|
$24.01
-1.67%
|
10/28/2011
|
$22.49
|
PP = $23.61
|
|
MB = $24.79
|
Most Recent Note - 11/30/2011 11:49:01 AM
Y - Gapped up again today, rallying above its pivot point, and a strong close with sufficient volume may trigger a proper technical buy signal. Its 50 DMA line and prior highs acted as support.
>>> The latest Featured Stock Update with an annotated graph appeared on 11/11/2011. Click here.
View all notes |
Alert me of new notes |
CANSLIM.net Company Profile |
SEC |
Zacks Reports |
StockTalk |
News |
Chart |
Request a new note
C
A N
S L
I M
|
MKTX
-
NASDAQ
Marketaxess Holdings Inc
FINANCIAL SERVICES - Investment Brokerage - Nationa
|
$28.87
|
+0.17
0.59% |
$29.88
|
100,852
41.66% of 50 DAV
50 DAV is 242,100
|
$31.45
-8.20%
|
10/28/2011
|
$29.79
|
PP = $31.05
|
|
MB = $32.60
|
Most Recent Note - 11/30/2011 7:12:48 PM
G - Gapped up today and posted a gain with slightly above average volume. It still faces previously stubborn resistance in the $31 area.
>>> The latest Featured Stock Update with an annotated graph appeared on 11/23/2011. Click here.
View all notes |
Alert me of new notes |
CANSLIM.net Company Profile |
SEC |
Zacks Reports |
StockTalk |
News |
Chart |
Request a new note
C
A N
S L
I M
|
OSIS
-
NASDAQ
O S I Systems Inc
ELECTRONICS - Semiconductor Equipment and Mate
|
$47.27
|
+0.71
1.52% |
$49.04
|
75,051
50.57% of 50 DAV
50 DAV is 148,400
|
$48.00
-1.52%
|
11/1/2011
|
$42.07
|
PP = $45.57
|
|
MB = $47.85
|
Most Recent Note - 12/1/2011 6:49:23 PM
Y - Pulled back today on lighter than average volume. Its gap gain with +44% above average volume on the prior session cleared its previously cited pivot point confirming a technical buy signal. The recent lows ($42.20 on 11/25/11) defines an important support level to watch. See the latest FSU analysis for more details and a new annotated graph.
>>> The latest Featured Stock Update with an annotated graph appeared on 11/28/2011. Click here.
View all notes |
Alert me of new notes |
CANSLIM.net Company Profile |
SEC |
Zacks Reports |
StockTalk |
News |
Chart |
Request a new note
C
A N
S L
I M
|
Symbol/Exchange
Company Name
Industry Group |
PRICE |
CHANGE
(%Change) |
Day High |
Volume
(% DAV)
(% 50 day avg vol) |
52 Wk Hi
% From Hi |
Featured
Date |
Price
Featured |
Pivot Featured |
|
Max Buy |
RAX
-
NYSE
Rackspace Hosting Inc
INTERNET - Internet Software and; Services
|
$43.01
|
-0.50
-1.15% |
$44.11
|
956,142
60.11% of 50 DAV
50 DAV is 1,590,600
|
$46.50
-7.50%
|
11/8/2011
|
$44.28
|
PP = $46.27
|
|
MB = $48.58
|
Most Recent Note - 11/30/2011 7:08:06 PM
Y - Gapped up today for a 3rd consecutive gain with average volume, rallying from support at its closely coinciding 50 and 200 DMA lines. Subsequent violations would trigger damaging technical sell signals. Its color code is changed to yellow based on its resilience, however it still faces previously stubborn resistance in the $45 area.
>>> The latest Featured Stock Update with an annotated graph appeared on 11/10/2011. Click here.
View all notes |
Alert me of new notes |
CANSLIM.net Company Profile |
SEC |
Zacks Reports |
StockTalk |
News |
Chart |
Request a new note
C
A N
S L
I M
|
SWI
-
NYSE
Solarwinds Inc
COMPUTER SOFTWARE and SERVICES - Application Software
|
$32.13
|
-0.16
-0.50% |
$33.11
|
634,907
54.16% of 50 DAV
50 DAV is 1,172,200
|
$33.06
-2.81%
|
10/27/2011
|
$27.78
|
PP = $25.62
|
|
MB = $26.90
|
Most Recent Note - 11/30/2011 11:43:10 AM
G - Gapped up today for a considerable gain and a new all-time high, getting extended from its prior base. Prior highs in the $25-26 area define initial chart support to watch on pullbacks.
>>> The latest Featured Stock Update with an annotated graph appeared on 11/22/2011. Click here.
View all notes |
Alert me of new notes |
CANSLIM.net Company Profile |
SEC |
Zacks Reports |
StockTalk |
News |
Chart |
Request a new note
C
A N
S L
I M
|
TDG
-
NYSE
Transdigm Group Inc
AEROSPACE/DEFENSE - Aerospace/Defense Products and; Services
|
$96.54
|
-1.14
-1.17% |
$98.71
|
181,388
43.92% of 50 DAV
50 DAV is 413,000
|
$102.73
-6.03%
|
11/9/2011
|
$98.45
|
PP = $95.14
|
|
MB = $99.90
|
Most Recent Note - 11/30/2011 11:57:21 AM
Y - Gapped up today, and it stayed well above its 50 DMA line during its recent consolidation. A subsequent slump below the recent low and its 50 DMA line would trigger technical sell signals.
>>> The latest Featured Stock Update with an annotated graph appeared on 11/9/2011. Click here.
View all notes |
Alert me of new notes |
CANSLIM.net Company Profile |
SEC |
Zacks Reports |
StockTalk |
News |
Chart |
Request a new note
C
A N
S L
I M
|
UA
-
NYSE
Under Armour Inc Cl A
CONSUMER NON-DURABLES - Textile - Apparel Clothing
|
$81.84
|
-0.02
-0.02% |
$84.86
|
894,524
67.34% of 50 DAV
50 DAV is 1,328,400
|
$87.40
-6.36%
|
10/25/2011
|
$82.43
|
PP = $80.80
|
|
MB = $84.84
|
Most Recent Note - 11/30/2011 12:00:32 PM
G - Gapped up today rallying toward prior highs. Subsequent weakness exceeding the recent low ($73.55 on 11/21/11) would raise concerns and trigger a technical sell signal.
>>> The latest Featured Stock Update with an annotated graph appeared on 11/29/2011. Click here.
View all notes |
Alert me of new notes |
CANSLIM.net Company Profile |
SEC |
Zacks Reports |
StockTalk |
News |
Chart |
Request a new note
C
A N
S L
I M
|
ULTA
-
NASDAQ
Ulta Salon Cosm & Frag
SPECIALTY RETAIL - Specialty Retail, Other
|
$74.19
|
+5.70
8.32% |
$74.79
|
3,010,294
284.42% of 50 DAV
50 DAV is 1,058,400
|
$75.69
-1.98%
|
12/2/2011
|
$72.88
|
PP = $75.79
|
|
MB = $79.58
|
Most Recent Note - 12/2/2011 1:24:47 PM
Y - Gapped up today and it is rallying within close striking distance of a new 52-week high. No resistance remains due to overhead supply and it may be working on a late-stage "square box" type base pattern. Its fundamentals (C and A criteria) remain strong. Color code is changed to yellow with new pivot point based on its 52-week high plus 10 cents.
>>> The latest Featured Stock Update with an annotated graph appeared on 12/2/2011. Click here.
View all notes |
Alert me of new notes |
CANSLIM.net Company Profile |
SEC |
Zacks Reports |
StockTalk |
News |
Chart |
Request a new note
C
A N
S L
I M
|
Symbol/Exchange
Company Name
Industry Group |
PRICE |
CHANGE
(%Change) |
Day High |
Volume
(% DAV)
(% 50 day avg vol) |
52 Wk Hi
% From Hi |
Featured
Date |
Price
Featured |
Pivot Featured |
|
Max Buy |
V
-
NYSE
Visa Inc Cl A
DIVERSIFIED SERVICES - Business/Management Services
|
$97.20
|
-0.56
-0.57% |
$98.60
|
3,231,986
60.92% of 50 DAV
50 DAV is 5,305,100
|
$97.03
0.18%
|
10/24/2011
|
$94.21
|
PP = $94.85
|
|
MB = $99.59
|
Most Recent Note - 11/30/2011 12:48:14 PM
Y - Gapped up today challenging its 52-week high without great volume conviction helping it rally. Proof of serious institutional demand requires at least +50% heavier than average volume behind a meaningful gain.
>>> The latest Featured Stock Update with an annotated graph appeared on 11/18/2011. Click here.
View all notes |
Alert me of new notes |
CANSLIM.net Company Profile |
SEC |
Zacks Reports |
StockTalk |
News |
Chart |
Request a new note
C
A N
S L
I M
|
|
|
|
THESE ARE NOT BUY RECOMMENDATIONS!
Comments contained in the body of this report are technical
opinions only. The material herein has been obtained
from sources believed to be reliable and accurate, however,
its accuracy and completeness cannot be guaranteed.
This site is not an investment advisor, hence it does
not endorse or recommend any securities or other investments.
Any recommendation contained in this report may not
be suitable for all investors and it is not to be deemed
an offer or solicitation on our part with respect to
the purchase or sale of any securities. All trademarks,
service marks and trade names appearing in this report
are the property of their respective owners, and are
likewise used for identification purposes only.
This report is a service available
only to active Paid Premium Members.
You may opt-out of receiving report notifications
at any time. Questions or comments may be submitted
by writing to Premium Membership Services 665 S.E. 10 Street, Suite 201 Deerfield Beach, FL 33441-5634 or by calling 1-800-965-8307
or 954-785-1121.
|
|
|

