You are not logged in.
This means you
CAN ONLY VIEW reports that were published prior to Monday, April 14, 2025.
You
MUST UPGRADE YOUR MEMBERSHIP if you want to see any current reports.
AFTER MARKET UPDATE - MONDAY, DECEMBER 1ST, 2014
Previous After Market Report Next After Market Report >>>
|
|
|
|
DOW |
-51.44 |
17,776.80 |
-0.29% |
|
Volume |
855,754,360 |
+35% |
|
Volume |
1,717,777,150 |
+87% |
|
NASDAQ |
-64.28 |
4,727.35 |
-1.34% |
|
Advancers |
696 |
22% |
|
Advancers |
618 |
20% |
|
S&P 500 |
-14.12 |
2,053.44 |
-0.68% |
|
Decliners |
2,427 |
76% |
|
Decliners |
2,429 |
78% |
|
Russell 2000 |
-19.18 |
1,154.05 |
-1.63% |
|
52 Wk Highs |
144 |
|
|
52 Wk Highs |
58 |
|
|
S&P 600 |
-9.41 |
667.41 |
-1.39% |
|
52 Wk Lows |
240 |
|
|
52 Wk Lows |
169 |
|
|
 |
Breadth Negative as Major Averages Fell With Higher Volume Totals
Kenneth J. Gruneisen - Passed the CAN SLIM® Master's Exam
The major averages fell on Monday. The S&P 500 declined 14 points to 2,053. The NASDAQ Composite lost 64 points to 4,727. There were higher volume totals on the NYSE and on the Nasdaq exchange. Decliners led advancers by more than a 3-1 margin on the NYSE and by nearly 4-1 on the Nasdaq exchange. There were 30 high-ranked companies from the CANSLIM.net Leaders List that made new 52-week highs and appeared on the CANSLIM.net BreakOuts Page, down abruptly from the prior session total of 128 stocks. The new 52-week lows totals expanded and outnumbered new 52-week highs on both the NYSE and on the Nasdaq exchange. There was only one gainer among the 12 high-ranked companies currently on the Featured Stocks Page. A "confirmed uptrend" for the market (M criteria) has been repeatedly noted in this daily Market Commentary since large gains were noted on 10/21/14 backed by higher volume totals as leadership (stocks hitting new 52-week highs) expanded.
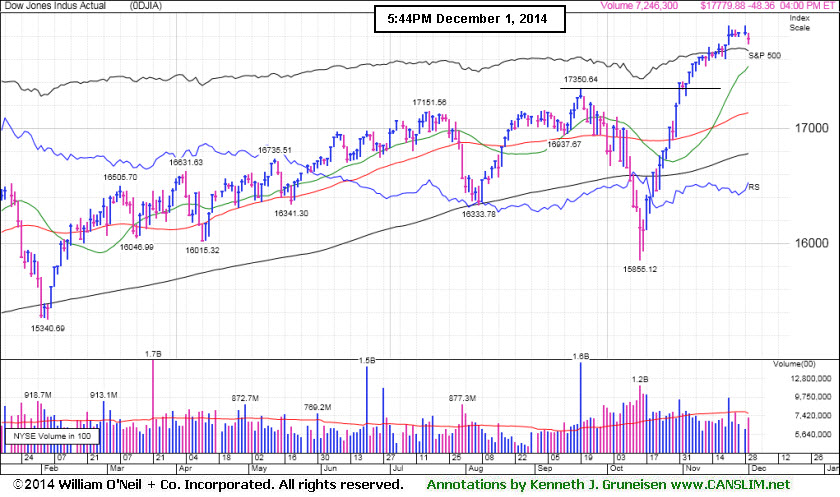
PICTURED: The Dow retreated from a record high as it lost 51 points to 17,776.
More signs of slowdown in China overshadowed positive U.S. economic data and a rebound in oil prices. On the economic front, China's factory activity slowed more than anticipated in November, while an ISM report showed U.S. manufacturing unexpectedly grew at the second-strongest pace since April 2011.
Eight of the 10 sectors in the S&P 500 declined. Industrials and materials were among the worst performing groups. General Electric (GE -1.77%) Shares of Ecolab (ECL -4.27%). Apple (AAPL -3.25%), tech and consumer stocks also weighed on the market. Retailers fell as a report from the National Retail Federation showed consumers spent 11% less than last year over the holiday weekend. Target (TGT -1.69% and Best Buy (BBY -2.5%) slid. Energy advanced as WTI crude rose +4.8% to $69.35 a barrel, rebounding from Friday's -10% drop. Exxon Mobil (XOM +2.0%).
Monetary policy comments garnered some attention. New York Fed President Dudley said a mid-2015 hike in interest rates is a reasonable expectation and the sharp drop in oil prices will benefit the U.S. economy.
Treasuries pared last week’s gains. The 10-year note fell 14/32 to yield 2.21%.
Disciplined investors know that new buying efforts may be made under the fact-based investment system only in stocks meeting all key criteria. The Featured Stocks Page shows the most action-worthy candidates and their latest notes and a Headline Link directs members to the latest detailed analysis with data-packed graphs annotated by a Certified expert along with links to additional resources. The Premium Member Homepage includes "dynamic archives" to all prior pay reports published.
|
 Kenneth J. Gruneisen started out as a licensed stockbroker in August 1987, a couple of months prior to the historic stock market crash that took the Dow Jones Industrial Average down -22.6% in a single day. He has published daily fact-based fundamental and technical analysis on high-ranked stocks online for two decades. Through FACTBASEDINVESTING.COM, Kenneth provides educational articles, news, market commentary, and other information regarding proven investment systems that work in good times and bad.
Comments contained in the body of this report are technical opinions only and are not necessarily those of Gruneisen Growth Corp. The material herein has been obtained from sources believed to be reliable and accurate, however, its accuracy and completeness cannot be guaranteed. Our firm, employees, and customers may effect transactions, including transactions contrary to any recommendation herein, or have positions in the securities mentioned herein or options with respect thereto. Any recommendation contained in this report may not be suitable for all investors and it is not to be deemed an offer or solicitation on our part with respect to the purchase or sale of any securities. |
|
 |
Gold & Silver Index Rose While Most Groups Were Lower
Kenneth J. Gruneisen - Passed the CAN SLIM® Master's Exam
The Retail Index ($RLX -1.54%) and financial shares were negative influences on the major averages as the Bank Index ($BKX -1.47%) and Broker/Dealer Index ($XBD -0.85%) ended lower. The tech sector faced pressure as the Semiconductor Index ($SOX -1.32%), Biotechnology Index ($BTK -1.14%), and Networking Index ($NWX -0.76%) ended unanimously lower. Energy-related shares were mixed as the Oil Services Index ($OSX -1.57%) fell while the Integrated Oil Index ($XOI +0.95%) rose.
Charts courtesy www.stockcharts.com
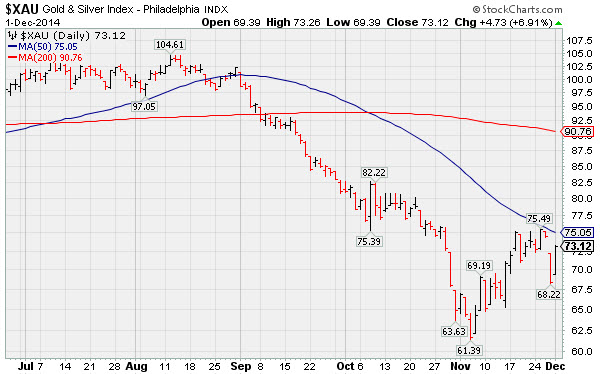
PICTURED: The Gold & Silver Index ($XAU +6.90%) bounced back from Friday's large -8.11% loss. The retreat came after meeting resistance at its 50-day moving average line while recovering from November's multi-year lows.
| Oil Services |
$OSX |
212.33 |
-3.39 |
-1.57% |
-24.45% |
| Integrated Oil |
$XOI |
1,348.55 |
+12.65 |
+0.95% |
-10.28% |
| Semiconductor |
$SOX |
676.69 |
-9.05 |
-1.32% |
+26.48% |
| Networking |
$NWX |
346.93 |
-2.66 |
-0.76% |
+7.10% |
| Broker/Dealer |
$XBD |
175.30 |
-1.51 |
-0.85% |
+9.18% |
| Retail |
$RLX |
995.82 |
-15.53 |
-1.54% |
+5.96% |
| Gold & Silver |
$XAU |
73.12 |
+4.72 |
+6.90% |
-13.11% |
| Bank |
$BKX |
71.61 |
-1.07 |
-1.47% |
+3.39% |
| Biotech |
$BTK |
3,398.50 |
-39.21 |
-1.14% |
+45.83% |
|
|
|
 |
Under Accumulation But Extended From Sound Base
Kenneth J. Gruneisen - Passed the CAN SLIM® Master's Exam
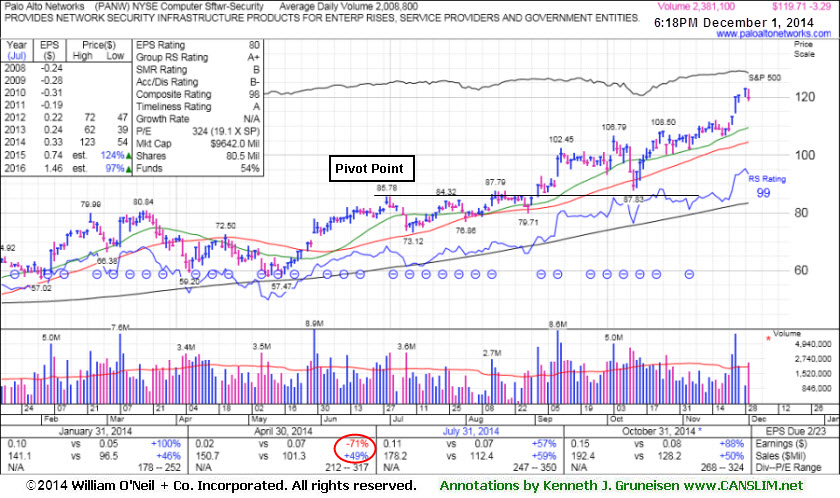
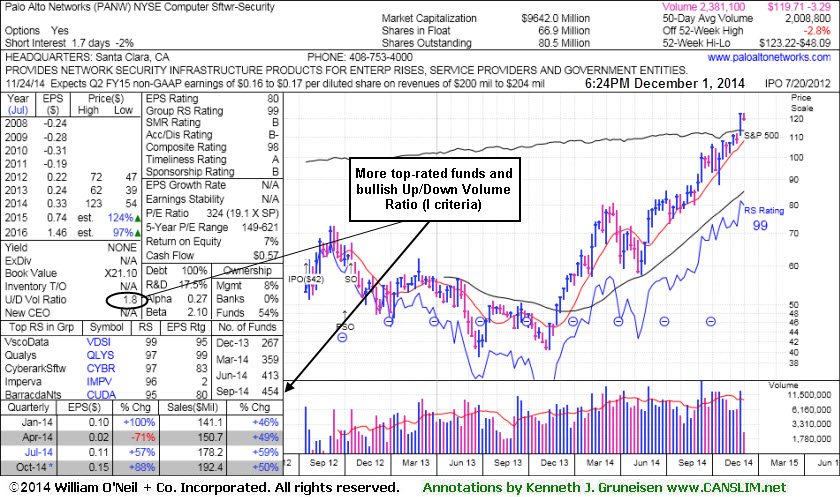
Palo Alto Networks (PANW -$3.29 or -2.67% to $119.71) pulled back from its all-time high with today's loss on near average volume. It has not formed a sound base lately, and the 50-day moving average (DMA) line defines near-term support to watch.
The number of top-rated funds owning its shares rose from 246 in Jun '13 to 454 in Sep '14, a reassuring sign concerning the I criteria. Its small supply (S criteria) of 66.9 million shares in the public float is another favorable characteristic. Its current Up/Down Volume Ratio of 1.8 is an unbiased indication its shares have been under accumulation over the past 50 days. PANW was last shown in this FSU section with annotated graphs on 11/13/14 under the headline, "Finished Near Session Low With Small Gain on Light Volume". Disciplined investors avoid chasing extended stocks more the +5% above prior highs and they always limit losses by selling any stock that falls more than -7% from their purchase price.
It reported earnings +88% on +50% sales revenues for the Oct '14 quarter. The Computer Software - Security firm has an Earnings Per Share (EPS) Rating of 80. Reviewing prior reports with annotated graphs carefully, it appears that the Apr '14 quarter now shows a -71% earnings comparison versus the year ago period. Previous annotated graphs published showed a more favorable comparison with strong sales revenues increases and earnings above the +25% minimum guideline satisfying the C criteria. It is unclear what prompted the apparent adjustment in the numbers as reported by the graph provider, however members are reminded that the fact-based investment system suggests only buying stocks showing strong quarterly and annual earnings (A criteria) increases.
|
|
|
Color Codes Explained :
Y - Better candidates highlighted by our
staff of experts.
G - Previously featured
in past reports as yellow but may no longer be buyable under the
guidelines.
***Last / Change / Volume data in this table is the closing quote data***
Symbol/Exchange
Company Name
Industry Group |
PRICE |
CHANGE
(%Change) |
Day High |
Volume
(% DAV)
(% 50 day avg vol) |
52 Wk Hi
% From Hi |
Featured
Date |
Price
Featured |
Pivot Featured |
|
Max Buy |
ACT
-
NYSE
Actavis plc
Medical-Generic Drugs
|
$263.07
|
-7.54
-2.79% |
$269.34
|
2,748,692
84.99% of 50 DAV
50 DAV is 3,234,000
|
$272.75
-3.55%
|
6/20/2014
|
$216.53
|
PP = $230.87
|
|
MB = $242.41
|
 Most Recent Note - 12/1/2014 6:34:20 PM
G - Quietly consolidating after spiking to new 52-week highs with volume-driven gains following news it plans to acquire Allergan (AGN) for $66 Billion. Did not form a sound base, and it is extended from prior highs in the $249 area defining near-term support.
>>> FEATURED STOCK ARTICLE : Perched at Highs Following Spike on Acquisition Plans - 11/24/2014
View all notes |
Set NEW NOTE alert |
CANSLIM.net Company Profile |
SEC
News |
Chart |
Request a new note
C
A N
S L
I M


|
AFSI
-
NASDAQ
Amtrust Financial Svcs
INSURANCE - Property and; Casualty Insurance
|
$51.68
|
+0.36
0.70% |
$52.39
|
850,683
81.48% of 50 DAV
50 DAV is 1,044,000
|
$53.80
-3.94%
|
10/17/2014
|
$45.24
|
PP = $46.02
|
|
MB = $48.32
|
Most Recent Note - 12/1/2014 6:48:00 PM
G - Still holding its ground near its 52-week high. Prior highs near $46 coincide with its 50 DMA line defining important near-term support.
>>> FEATURED STOCK ARTICLE : No Sound Base Formed, Yet Little Resistance Remains - 11/21/2014
View all notes |
Set NEW NOTE alert |
CANSLIM.net Company Profile |
SEC
News |
Chart |
Request a new note
C
A N
S L
I M
|
ALXN
-
NASDAQ
Alexion Pharmaceuticals
DRUGS - Drug Manufacturers - Other
|
$192.51
|
-2.39
-1.23% |
$195.68
|
825,217
69.82% of 50 DAV
50 DAV is 1,182,000
|
$197.64
-2.60%
|
10/23/2014
|
$184.01
|
PP = $185.53
|
|
MB = $194.81
|
Most Recent Note - 11/28/2014 2:13:55 PM
G - Color code is changed to green while quietly trading above its "max buy" level and near all-time highs. Recent lows near $185 define initial support to watch above its 50 DMA line. See the latest FSU analysis for more details and new annotated graphs.
>>> FEATURED STOCK ARTICLE : Quietly Consolidating Near All-Time High - 11/28/2014
View all notes |
Set NEW NOTE alert |
CANSLIM.net Company Profile |
SEC
News |
Chart |
Request a new note
C
A N
S L
I M
|
BIDU
-
NASDAQ
Baidu Inc Ads
INTERNET - Internet Information Providers
|
$236.61
|
-8.50
-3.47% |
$242.00
|
4,184,176
110.40% of 50 DAV
50 DAV is 3,790,000
|
$251.99
-6.10%
|
10/30/2014
|
$234.08
|
PP = $231.51
|
|
MB = $243.09
|
Most Recent Note - 12/1/2014 12:02:12 PM
Y - Color code is changed to yellow while retreating below its "max buy" level. Prior highs near $230 define near-term support to watch above its 50 DMA line.
>>> FEATURED STOCK ARTICLE : Consolidating Back Below "Max Buy" Level - 11/17/2014
View all notes |
Set NEW NOTE alert |
CANSLIM.net Company Profile |
SEC
News |
Chart |
Request a new note
C
A N
S L
I M
|
EPAM
-
NYSE
Epam Systems Inc
COMPUTER SOFTWARE and SERVICES - Information Technology Service
|
$49.41
|
-1.62
-3.17% |
$51.04
|
336,463
83.28% of 50 DAV
50 DAV is 404,000
|
$52.29
-5.51%
|
10/23/2014
|
$45.21
|
PP = $46.09
|
|
MB = $48.39
|
Most Recent Note - 12/1/2014 6:41:26 PM
G - Pulled back today on higher (but below average) volume. Prior highs in the $44 area define support along with its 50 DMA line ($45.50).
>>> FEATURED STOCK ARTICLE : Quiet Gain For New High Close - 11/26/2014
View all notes |
Set NEW NOTE alert |
CANSLIM.net Company Profile |
SEC
News |
Chart |
Request a new note
C
A N
S L
I M
|
Symbol/Exchange
Company Name
Industry Group |
PRICE |
CHANGE
(%Change) |
Day High |
Volume
(% DAV)
(% 50 day avg vol) |
52 Wk Hi
% From Hi |
Featured
Date |
Price
Featured |
Pivot Featured |
|
Max Buy |
FB
-
NASDAQ
Facebook Inc Cl A
INTERNET
|
$75.10
|
-2.60
-3.35% |
$77.31
|
31,716,912
84.04% of 50 DAV
50 DAV is 37,742,000
|
$81.16
-7.47%
|
9/9/2014
|
$76.67
|
PP = $76.84
|
|
MB = $80.68
|
Most Recent Note - 12/1/2014 6:46:27 PM
G - Its color code is changed to green after slumping back below its 50 DMA line today hurting its technical stance and near-term outlook.
>>> FEATURED STOCK ARTICLE : Following Violation 50-Day Average Acted as Resistance - 11/14/2014
View all notes |
Set NEW NOTE alert |
CANSLIM.net Company Profile |
SEC
News |
Chart |
Request a new note
C
A N
S L
I M
|
FLT
-
NYSE
Fleetcor Technologies
DIVERSIFIED SERVICES - Business/Management Services
|
$146.54
|
-5.35
-3.52% |
$151.35
|
1,629,711
221.43% of 50 DAV
50 DAV is 736,000
|
$160.40
-8.64%
|
10/31/2014
|
$148.50
|
PP = $146.29
|
|
MB = $153.60
|
Most Recent Note - 12/1/2014 12:11:22 PM
Y - Color code is changed to yellow while undercutting prior highs in the $146-149 area raising concerns with a big loss today on higher volume, testing support at its 50 DMA line. More damaging losses may trigger a worrisome technical sell signal.
>>> FEATURED STOCK ARTICLE : Consolidation Continues Above Prior Highs - 11/18/2014
View all notes |
Set NEW NOTE alert |
CANSLIM.net Company Profile |
SEC
News |
Chart |
Request a new note
C
A N
S L
I M
|
ILMN
-
NASDAQ
Illumina Inc
DRUGS - Biotechnology
|
$189.63
|
-1.26
-0.66% |
$190.89
|
798,645
63.64% of 50 DAV
50 DAV is 1,255,000
|
$197.37
-3.92%
|
10/22/2014
|
$188.77
|
PP = $182.27
|
|
MB = $191.38
|
Most Recent Note - 12/1/2014 6:44:33 PM
Y - Volume totals have been cooling while consolidating well above prior highs near $182 and above its 50 DMA line. Damaging losses below those levels would raise concerns and trigger technical sell signals.
>>> FEATURED STOCK ARTICLE : Quietly Consolidating Back Below "Max Buy" Level - 11/25/2014
View all notes |
Set NEW NOTE alert |
CANSLIM.net Company Profile |
SEC
News |
Chart |
Request a new note
C
A N
S L
I M
|
NBCB
-
NASDAQ
First N B C Bank Hldg
Banks-Southeast
|
$35.21
|
-1.19
-3.27% |
$36.56
|
140,196
175.25% of 50 DAV
50 DAV is 80,000
|
$38.18
-7.78%
|
10/31/2014
|
$36.31
|
PP = $35.93
|
|
MB = $37.73
|
Most Recent Note - 12/1/2014 6:39:39 PM
Y - Down today with above average volume while slumping back into its prior base with a damaging loss raising concerns. Prior highs near $34 define near-term support to watch below its 50 DMA line ($34.92) on pullbacks.
>>> FEATURED STOCK ARTICLE : Fifth Consecutive Loss While Retreating From Highs - 11/19/2014
View all notes |
Set NEW NOTE alert |
CANSLIM.net Company Profile |
SEC
News |
Chart |
Request a new note
C
A N
S L
I M
|
PANW
-
NYSE
Palo Alto Networks
Computer Sftwr-Security
|
$119.71
|
-3.29
-2.67% |
$123.07
|
2,381,199
118.59% of 50 DAV
50 DAV is 2,008,000
|
$123.22
-2.85%
|
7/30/2014
|
$84.21
|
PP = $85.88
|
|
MB = $90.17
|
Most Recent Note - 12/1/2014 6:36:10 PM
G - Pulled back from all-time highs with higher volume today. It did not form a sound base, and the 50 DMA line defines near-term support to watch. Reported earnings +88% on +50% sales revenues for the Oct '14 quarter. See the latest FSU analysis for more details and new annotated graphs.
>>> FEATURED STOCK ARTICLE : Under Accumulation But Extended From Sound Base - 12/1/2014
View all notes |
Set NEW NOTE alert |
CANSLIM.net Company Profile |
SEC
News |
Chart |
Request a new note
C
A N
S L
I M
|
Symbol/Exchange
Company Name
Industry Group |
PRICE |
CHANGE
(%Change) |
Day High |
Volume
(% DAV)
(% 50 day avg vol) |
52 Wk Hi
% From Hi |
Featured
Date |
Price
Featured |
Pivot Featured |
|
Max Buy |
SNCR
-
NASDAQ
Synchronoss Technologies
COMPUTER SOFTWARE andamp; SERVICES - Application Software
|
$41.87
|
-0.96
-2.24% |
$43.28
|
675,954
101.95% of 50 DAV
50 DAV is 663,000
|
$54.05
-22.53%
|
10/27/2014
|
$46.40
|
PP = $47.81
|
|
MB = $50.20
|
Most Recent Note - 12/1/2014 6:37:22 PM
G - Slumped again today on higher (near average) volume. Remains below its 50 DMA line following a damaging volume-driven loss that triggered a technical sell signal. Prior lows in the $41 area recently acted as support, but a rebound above the 50 DMA line is needed for its outlook to improve.
>>> FEATURED STOCK ARTICLE : Loss on Heavy Volume a Sign of Distributional Pressure - 11/12/2014
View all notes |
Set NEW NOTE alert |
CANSLIM.net Company Profile |
SEC
News |
Chart |
Request a new note
C
A N
S L
I M
|
STRT
-
NASDAQ
Strattec Security Corp
AUTOMOTIVE - Auto Parts
|
$100.71
|
-3.05
-2.94% |
$104.00
|
26,095
100.37% of 50 DAV
50 DAV is 26,000
|
$110.96
-9.24%
|
11/20/2014
|
$105.76
|
PP = $109.54
|
|
MB = $115.02
|
Most Recent Note - 12/1/2014 6:43:35 PM
Y - Fell for a 4th consecutive loss on higher volume today. After forming an advanced "3-weeks tight" base it has not produced the volume-driven gains for new highs needed to trigger a new (or add-on) technical buy signal. Prior highs coincide with its 50 DMA line defining important near-term support to watch on pullbacks.
>>> FEATURED STOCK ARTICLE : Formed New Advanced "3-Weeks Tight" Base - 11/20/2014
View all notes |
Set NEW NOTE alert |
CANSLIM.net Company Profile |
SEC
News |
Chart |
Request a new note
C
A N
S L
I M
|
|
|
|
THESE ARE NOT BUY RECOMMENDATIONS!
Comments contained in the body of this report are technical
opinions only. The material herein has been obtained
from sources believed to be reliable and accurate, however,
its accuracy and completeness cannot be guaranteed.
This site is not an investment advisor, hence it does
not endorse or recommend any securities or other investments.
Any recommendation contained in this report may not
be suitable for all investors and it is not to be deemed
an offer or solicitation on our part with respect to
the purchase or sale of any securities. All trademarks,
service marks and trade names appearing in this report
are the property of their respective owners, and are
likewise used for identification purposes only.
This report is a service available
only to active Paid Premium Members.
You may opt-out of receiving report notifications
at any time. Questions or comments may be submitted
by writing to Premium Membership Services 665 S.E. 10 Street, Suite 201 Deerfield Beach, FL 33441-5634 or by calling 1-800-965-8307
or 954-785-1121.
|
|
|

