You are not logged in.
This means you
CAN ONLY VIEW reports that were published prior to Wednesday, April 9, 2025.
You
MUST UPGRADE YOUR MEMBERSHIP if you want to see any current reports.
AFTER MARKET UPDATE - TUESDAY, DECEMBER 2ND, 2014
Previous After Market Report Next After Market Report >>>
|
|
|
|
DOW |
+102.75 |
17,879.55 |
+0.58% |
|
Volume |
794,837,870 |
-7% |
|
Volume |
1,694,019,640 |
-1% |
|
NASDAQ |
+28.46 |
4,755.81 |
+0.60% |
|
Advancers |
2,057 |
64% |
|
Advancers |
1,895 |
66% |
|
S&P 500 |
+13.11 |
2,066.55 |
+0.64% |
|
Decliners |
1,044 |
33% |
|
Decliners |
893 |
31% |
|
Russell 2000 |
+14.40 |
1,168.45 |
+1.25% |
|
52 Wk Highs |
116 |
|
|
52 Wk Highs |
72 |
|
|
S&P 600 |
+7.18 |
674.59 |
+1.08% |
|
52 Wk Lows |
120 |
|
|
52 Wk Lows |
95 |
|
|
 |
Market Rallied With Less Volume and Mediocre Leadership
Kenneth J. Gruneisen - Passed the CAN SLIM® Master's Exam
Stocks finished higher on Tuesday. The Dow climbed 102 points to 17,879, a record high. The S&P 500 rebounded from the worst day in five weeks yesterday, as it gained 13 points to 2,066. The NASDAQ advanced 28 points to 4,755. There were lighter volume totals on the NYSE and on the Nasdaq exchange. Breadth was positive as advancers led decliners by a 2-1 margin on the NYSE and on the Nasdaq exchange. There were 37 high-ranked companies from the CANSLIM.net Leaders List that made new 52-week highs and appeared on the CANSLIM.net BreakOuts Page, up from the prior session total of 30 stocks. However, for a 2nd consecutive session the new 52-week lows totals outnumbered new 52-week highs on both the NYSE and on the Nasdaq exchange. There were also only 5 gainers among the 12 high-ranked companies currently on the Featured Stocks Page. A "confirmed uptrend" for the market (M criteria) has been repeatedly noted in this daily Market Commentary since large gains were noted on 10/21/14 backed by higher volume totals as leadership (stocks hitting new 52-week highs) expanded.
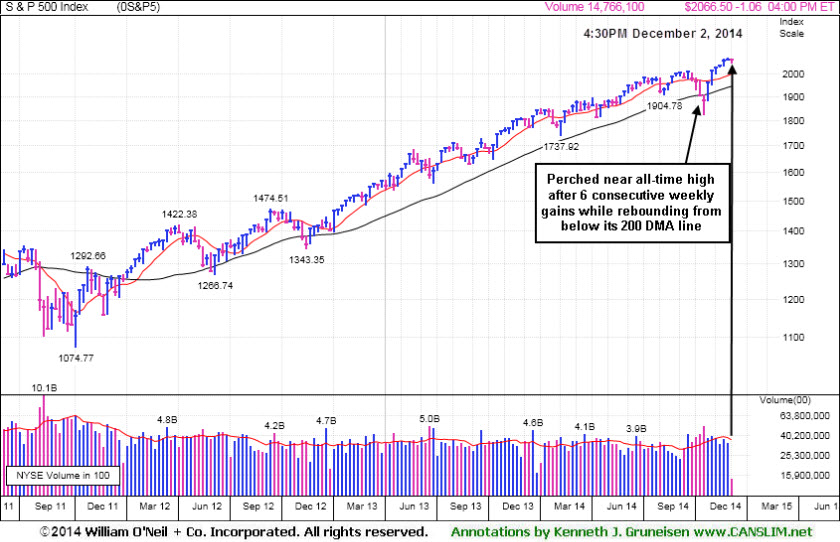
PICTURED: The S&P 500 Index is perched near its all-time high following 6 consecutive weekly gains while rebounding from below its 200-day moving average (DMA) line.
The major averages gained, as investors focused on economic data and central banks. A measure of construction spending surged 1.1% in October and was revised higher for September. Meanwhile, a report showed that auto sales grew in November by the most since July. Separately, a gauge of business conditions in New York unexpectedly rose by the most in 16 months. Turning to the Fed, investors heard from Regional President Dudley, Vice Chairman Stanley Fischer and Chairwoman Yellen.
At the close 9 of the 10 sectors in the S&P 500 finished in positive territory. Energy stocks were outperformers, despite a drop in the price of crude. Exxon Mobil (XOM +2%) rose and Chevron (CVX +2.1%) gained ground after announcing it began production in a new oil field. Positive sales data helped the new General Motors Company (GM +1%) climb. Telecom limited gains, as AT&T (T -2.2%) fell on reports of stiff competition.
Treasuries finished lower. The benchmark 10-year note lost 15/32 to yield 2.29%. In commodities, WTI crude on the NYMEX fell 2.5% to $67.30 per barrel.
Disciplined investors know that new buying efforts may be made under the fact-based investment system only in stocks meeting all key criteria. The Featured Stocks Page shows the most action-worthy candidates and their latest notes and a Headline Link directs members to the latest detailed analysis with data-packed graphs annotated by a Certified expert along with links to additional resources. The Premium Member Homepage includes "dynamic archives" to all prior pay reports published.
|
 Kenneth J. Gruneisen started out as a licensed stockbroker in August 1987, a couple of months prior to the historic stock market crash that took the Dow Jones Industrial Average down -22.6% in a single day. He has published daily fact-based fundamental and technical analysis on high-ranked stocks online for two decades. Through FACTBASEDINVESTING.COM, Kenneth provides educational articles, news, market commentary, and other information regarding proven investment systems that work in good times and bad.
Comments contained in the body of this report are technical opinions only and are not necessarily those of Gruneisen Growth Corp. The material herein has been obtained from sources believed to be reliable and accurate, however, its accuracy and completeness cannot be guaranteed. Our firm, employees, and customers may effect transactions, including transactions contrary to any recommendation herein, or have positions in the securities mentioned herein or options with respect thereto. Any recommendation contained in this report may not be suitable for all investors and it is not to be deemed an offer or solicitation on our part with respect to the purchase or sale of any securities. |
|
 |
Financial, Biotech, Semiconductor, and Retail Groups Rose
Kenneth J. Gruneisen - Passed the CAN SLIM® Master's Exam
Financial shares were a positive influence on the major averages on Tuesday as the Bank Index ($BKX +1.24%) and the Broker/Dealer Index ($XBD +1.40%) both ratcheted higher. The Integrated Oil Index ($XOI +1.90%) posted a solid gain while the Oil Services Index ($OSX -0.47%) edged lower. The Biotechnology Index ($BTK +1.56%) led the tech sector and the Semiconductor Index ($SOX +0.69%) posted a modest gain, but the Networking Index ($NWX -0.32%) edged lower. The Gold & Silver Index ($XAU -3.35%) was a standout decliner.
Charts courtesy www.stockcharts.com
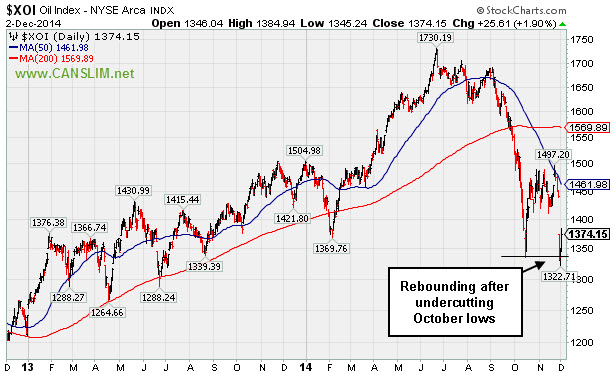
PICTURED: The integrated Oil Index ($XOI +1.90%) is rebounding after undercutting its October lows.
| Oil Services |
$OSX |
211.33 |
-1.00 |
-0.47% |
-24.80% |
| Integrated Oil |
$XOI |
1,374.15 |
+25.61 |
+1.90% |
-8.58% |
| Semiconductor |
$SOX |
681.35 |
+4.66 |
+0.69% |
+27.35% |
| Networking |
$NWX |
345.84 |
-1.10 |
-0.32% |
+6.76% |
| Broker/Dealer |
$XBD |
177.75 |
+2.46 |
+1.40% |
+10.71% |
| Retail |
$RLX |
999.09 |
+3.27 |
+0.33% |
+6.31% |
| Gold & Silver |
$XAU |
70.67 |
-2.45 |
-3.35% |
-16.02% |
| Bank |
$BKX |
72.50 |
+0.89 |
+1.24% |
+4.68% |
| Biotech |
$BTK |
3,451.49 |
+52.99 |
+1.56% |
+48.11% |
|
|
|
 |
Distributional Action Followed Blast Higher After Latest Good Earnings Report
Kenneth J. Gruneisen - Passed the CAN SLIM® Master's Exam
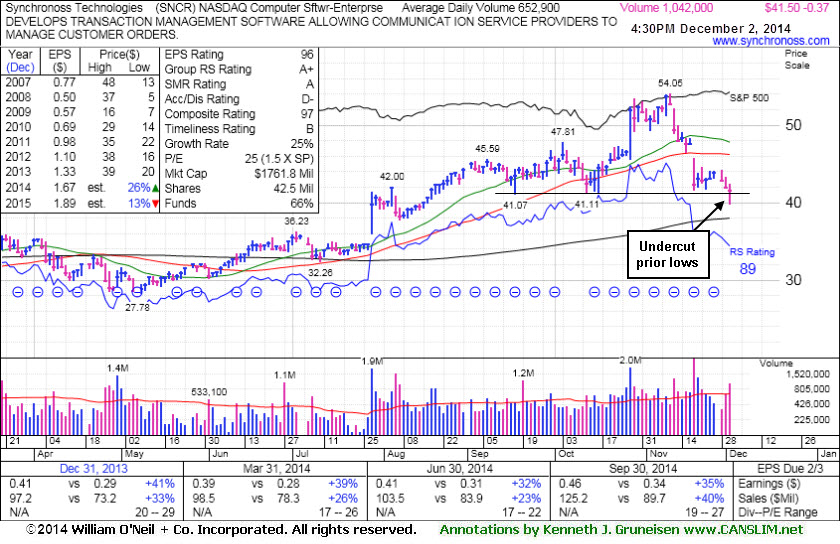
Synchronoss Technologies (SNCR -$0.37 or -0.91% to $41.50) finished near the middle of its intra-day range but it was down again today and with above average volume. In the process it slumped further below its 50-day moving average (DMA) line and undercut prior lows in the $41 area raising greater concerns. It will be dropped from the Featured Stocks list tonight.
Disciplined investors limit losses by selling any stock with falls more than -7% from their purchase price. SNCR was last shown in this FSU section on 11/12/14 with annotated graphs under the headline, "Loss on Heavy Volume a Sign of Distributional Pressure". It gapped down on 11/19/14 with a damaging loss on even higher volume noted while violating its 50 DMA line - triggering a worrisome technical sell signal.
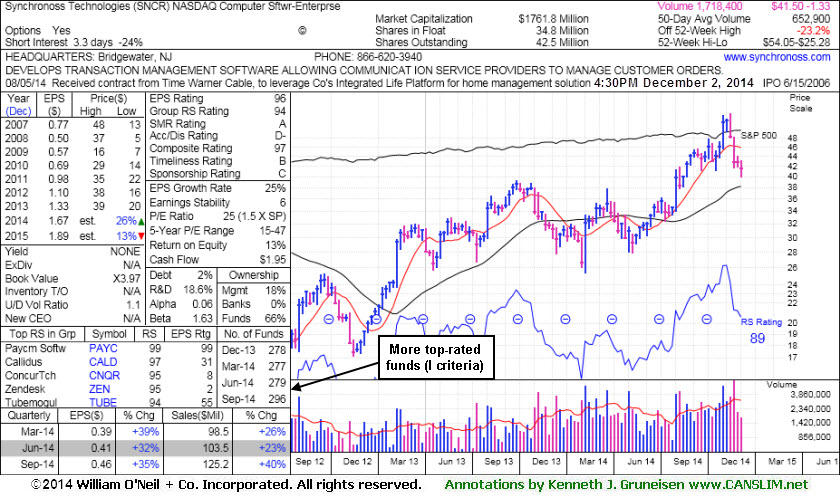
SNCR was highlighted in yellow in the 10/27/14 mid-day report (read here). It blasted higher on the next session after the high-ranked Computer Software - Enterprise firm reported earnings +35% on +40% sales revenues for the Sep '14 quarter. Prior quarterly earnings had been above the +25% minimum guideline (C criteria) of the fact-based system, and it has a strong annual earnings (A criteria) history. The number of top-rated funds owning its shares rose from 277 in Mar '14 to 296 in Sep '14, a reassuring sign concerning the I criteria.
|
|
|
Color Codes Explained :
Y - Better candidates highlighted by our
staff of experts.
G - Previously featured
in past reports as yellow but may no longer be buyable under the
guidelines.
***Last / Change / Volume data in this table is the closing quote data***
Symbol/Exchange
Company Name
Industry Group |
PRICE |
CHANGE
(%Change) |
Day High |
Volume
(% DAV)
(% 50 day avg vol) |
52 Wk Hi
% From Hi |
Featured
Date |
Price
Featured |
Pivot Featured |
|
Max Buy |
ACT
-
NYSE
Actavis plc
Medical-Generic Drugs
|
$264.21
|
+1.14
0.43% |
$265.11
|
2,367,487
73.62% of 50 DAV
50 DAV is 3,216,000
|
$272.75
-3.13%
|
6/20/2014
|
$216.53
|
PP = $230.87
|
|
MB = $242.41
|
Most Recent Note - 12/1/2014 6:34:20 PM
G - Quietly consolidating after spiking to new 52-week highs with volume-driven gains following news it plans to acquire Allergan (AGN) for $66 Billion. Did not form a sound base, and it is extended from prior highs in the $249 area defining near-term support.
>>> FEATURED STOCK ARTICLE : Perched at Highs Following Spike on Acquisition Plans - 11/24/2014
View all notes |
Set NEW NOTE alert |
CANSLIM.net Company Profile |
SEC
News |
Chart |
Request a new note
C
A N
S L
I M


|
AFSI
-
NASDAQ
Amtrust Financial Svcs
INSURANCE - Property and; Casualty Insurance
|
$51.61
|
-0.07
-0.14% |
$52.21
|
888,883
85.72% of 50 DAV
50 DAV is 1,037,000
|
$53.80
-4.07%
|
10/17/2014
|
$45.24
|
PP = $46.02
|
|
MB = $48.32
|
Most Recent Note - 12/1/2014 6:48:00 PM
G - Still holding its ground near its 52-week high. Prior highs near $46 coincide with its 50 DMA line defining important near-term support.
>>> FEATURED STOCK ARTICLE : No Sound Base Formed, Yet Little Resistance Remains - 11/21/2014
View all notes |
Set NEW NOTE alert |
CANSLIM.net Company Profile |
SEC
News |
Chart |
Request a new note
C
A N
S L
I M
|
ALXN
-
NASDAQ
Alexion Pharmaceuticals
DRUGS - Drug Manufacturers - Other
|
$200.79
|
+8.28
4.30% |
$202.04
|
1,827,202
160.85% of 50 DAV
50 DAV is 1,136,000
|
$197.64
1.59%
|
10/23/2014
|
$184.01
|
PP = $185.53
|
|
MB = $194.81
|
 Most Recent Note - 12/2/2014 5:37:48 PM
G - Rallied to new highs today with a volume-driven gain from a brief consolidation, not a sufficient length base. Recent lows near $185 define initial support to watch above its 50 DMA line.
>>> FEATURED STOCK ARTICLE : Quietly Consolidating Near All-Time High - 11/28/2014
View all notes |
Set NEW NOTE alert |
CANSLIM.net Company Profile |
SEC
News |
Chart |
Request a new note
C
A N
S L
I M
|
BIDU
-
NASDAQ
Baidu Inc Ads
INTERNET - Internet Information Providers
|
$234.74
|
-1.87
-0.79% |
$238.74
|
2,564,084
68.47% of 50 DAV
50 DAV is 3,745,000
|
$251.99
-6.85%
|
10/30/2014
|
$234.08
|
PP = $231.51
|
|
MB = $243.09
|
Most Recent Note - 12/1/2014 12:02:12 PM
Y - Color code is changed to yellow while retreating below its "max buy" level. Prior highs near $230 define near-term support to watch above its 50 DMA line.
>>> FEATURED STOCK ARTICLE : Consolidating Back Below "Max Buy" Level - 11/17/2014
View all notes |
Set NEW NOTE alert |
CANSLIM.net Company Profile |
SEC
News |
Chart |
Request a new note
C
A N
S L
I M
|
EPAM
-
NYSE
Epam Systems Inc
COMPUTER SOFTWARE and SERVICES - Information Technology Service
|
$50.05
|
+0.64
1.30% |
$50.10
|
236,904
58.79% of 50 DAV
50 DAV is 403,000
|
$52.29
-4.28%
|
10/23/2014
|
$45.21
|
PP = $46.09
|
|
MB = $48.39
|
Most Recent Note - 12/1/2014 6:41:26 PM
G - Pulled back today on higher (but below average) volume. Prior highs in the $44 area define support along with its 50 DMA line ($45.50).
>>> FEATURED STOCK ARTICLE : Quiet Gain For New High Close - 11/26/2014
View all notes |
Set NEW NOTE alert |
CANSLIM.net Company Profile |
SEC
News |
Chart |
Request a new note
C
A N
S L
I M
|
Symbol/Exchange
Company Name
Industry Group |
PRICE |
CHANGE
(%Change) |
Day High |
Volume
(% DAV)
(% 50 day avg vol) |
52 Wk Hi
% From Hi |
Featured
Date |
Price
Featured |
Pivot Featured |
|
Max Buy |
FB
-
NASDAQ
Facebook Inc Cl A
INTERNET
|
$75.46
|
+0.36
0.48% |
$75.91
|
16,724,407
45.39% of 50 DAV
50 DAV is 36,844,000
|
$81.16
-7.02%
|
9/9/2014
|
$76.67
|
PP = $76.84
|
|
MB = $80.68
|
Most Recent Note - 12/1/2014 6:46:27 PM
G - Its color code is changed to green after slumping back below its 50 DMA line today hurting its technical stance and near-term outlook.
>>> FEATURED STOCK ARTICLE : Following Violation 50-Day Average Acted as Resistance - 11/14/2014
View all notes |
Set NEW NOTE alert |
CANSLIM.net Company Profile |
SEC
News |
Chart |
Request a new note
C
A N
S L
I M
|
FLT
-
NYSE
Fleetcor Technologies
DIVERSIFIED SERVICES - Business/Management Services
|
$146.49
|
-0.05
-0.03% |
$148.49
|
704,175
93.02% of 50 DAV
50 DAV is 757,000
|
$160.40
-8.67%
|
10/31/2014
|
$148.50
|
PP = $146.29
|
|
MB = $153.60
|
Most Recent Note - 12/1/2014 12:11:22 PM
Y - Color code is changed to yellow while undercutting prior highs in the $146-149 area raising concerns with a big loss today on higher volume, testing support at its 50 DMA line. More damaging losses may trigger a worrisome technical sell signal.
>>> FEATURED STOCK ARTICLE : Consolidation Continues Above Prior Highs - 11/18/2014
View all notes |
Set NEW NOTE alert |
CANSLIM.net Company Profile |
SEC
News |
Chart |
Request a new note
C
A N
S L
I M
|
ILMN
-
NASDAQ
Illumina Inc
DRUGS - Biotechnology
|
$188.17
|
-1.46
-0.77% |
$190.89
|
1,184,660
97.66% of 50 DAV
50 DAV is 1,213,000
|
$197.37
-4.66%
|
10/22/2014
|
$188.77
|
PP = $182.27
|
|
MB = $191.38
|
Most Recent Note - 12/1/2014 6:44:33 PM
Y - Volume totals have been cooling while consolidating well above prior highs near $182 and above its 50 DMA line. Damaging losses below those levels would raise concerns and trigger technical sell signals.
>>> FEATURED STOCK ARTICLE : Quietly Consolidating Back Below "Max Buy" Level - 11/25/2014
View all notes |
Set NEW NOTE alert |
CANSLIM.net Company Profile |
SEC
News |
Chart |
Request a new note
C
A N
S L
I M
|
NBCB
-
NASDAQ
First N B C Bank Hldg
Banks-Southeast
|
$35.28
|
+0.07
0.20% |
$35.50
|
142,771
180.72% of 50 DAV
50 DAV is 79,000
|
$38.18
-7.60%
|
10/31/2014
|
$36.31
|
PP = $35.93
|
|
MB = $37.73
|
Most Recent Note - 12/2/2014 12:44:50 PM
Y - Volume-driven loss on the prior session raised concerns. Undercut prior highs near $34 and its 50 DMA line briefly today then found prompt support and managed an encouraging "positive reversal". More damaging losses would raise serious concerns and trigger a worrisome technical sell signal.
>>> FEATURED STOCK ARTICLE : Fifth Consecutive Loss While Retreating From Highs - 11/19/2014
View all notes |
Set NEW NOTE alert |
CANSLIM.net Company Profile |
SEC
News |
Chart |
Request a new note
C
A N
S L
I M
|
PANW
-
NYSE
Palo Alto Networks
Computer Sftwr-Security
|
$117.70
|
-2.01
-1.68% |
$120.61
|
1,767,121
87.74% of 50 DAV
50 DAV is 2,014,000
|
$123.22
-4.48%
|
7/30/2014
|
$84.21
|
PP = $85.88
|
|
MB = $90.17
|
Most Recent Note - 12/1/2014 6:36:10 PM
G - Pulled back from all-time highs with higher volume today. It did not form a sound base, and the 50 DMA line defines near-term support to watch. Reported earnings +88% on +50% sales revenues for the Oct '14 quarter. See the latest FSU analysis for more details and new annotated graphs.
>>> FEATURED STOCK ARTICLE : Under Accumulation But Extended From Sound Base - 12/1/2014
View all notes |
Set NEW NOTE alert |
CANSLIM.net Company Profile |
SEC
News |
Chart |
Request a new note
C
A N
S L
I M
|
Symbol/Exchange
Company Name
Industry Group |
PRICE |
CHANGE
(%Change) |
Day High |
Volume
(% DAV)
(% 50 day avg vol) |
52 Wk Hi
% From Hi |
Featured
Date |
Price
Featured |
Pivot Featured |
|
Max Buy |
SNCR
-
NASDAQ
Synchronoss Technologies
COMPUTER SOFTWARE andamp; SERVICES - Application Software
|
$41.49
|
-0.38
-0.91% |
$42.43
|
1,162,927
178.36% of 50 DAV
50 DAV is 652,000
|
$54.05
-23.24%
|
10/27/2014
|
$46.40
|
PP = $47.81
|
|
MB = $50.20
|
Most Recent Note - 12/2/2014 5:35:13 PM
Slumped further below its 50 DMA line with another volume-driven loss today. It will be dropped from the Featured Stocks list tonight. Prior damaging losses were noted as they triggered technical sell signals. See the latest FSU analysis for more details and new annotated graphs.
>>> FEATURED STOCK ARTICLE : Distributional Action Followed Blast Higher After Latest Good Earnings Report - 12/2/2014
View all notes |
Set NEW NOTE alert |
CANSLIM.net Company Profile |
SEC
News |
Chart |
Request a new note
C
A N
S L
I M
|
STRT
-
NASDAQ
Strattec Security Corp
AUTOMOTIVE - Auto Parts
|
$100.00
|
-0.71
-0.70% |
$101.78
|
41,454
165.82% of 50 DAV
50 DAV is 25,000
|
$110.96
-9.88%
|
11/20/2014
|
$105.76
|
PP = $109.54
|
|
MB = $115.02
|
Most Recent Note - 12/2/2014 5:39:11 PM
Y - Fell for a 5th consecutive loss on even higher volume today, a sign of distributional pressure. After forming an advanced "3-weeks tight" base it has not produced the volume-driven gains for new highs needed to trigger a new (or add-on) technical buy signal. Prior highs coincide with its 50 DMA line defining important near-term support to watch on pullbacks.
>>> FEATURED STOCK ARTICLE : Formed New Advanced "3-Weeks Tight" Base - 11/20/2014
View all notes |
Set NEW NOTE alert |
CANSLIM.net Company Profile |
SEC
News |
Chart |
Request a new note
C
A N
S L
I M
|
|
|
|
THESE ARE NOT BUY RECOMMENDATIONS!
Comments contained in the body of this report are technical
opinions only. The material herein has been obtained
from sources believed to be reliable and accurate, however,
its accuracy and completeness cannot be guaranteed.
This site is not an investment advisor, hence it does
not endorse or recommend any securities or other investments.
Any recommendation contained in this report may not
be suitable for all investors and it is not to be deemed
an offer or solicitation on our part with respect to
the purchase or sale of any securities. All trademarks,
service marks and trade names appearing in this report
are the property of their respective owners, and are
likewise used for identification purposes only.
This report is a service available
only to active Paid Premium Members.
You may opt-out of receiving report notifications
at any time. Questions or comments may be submitted
by writing to Premium Membership Services 665 S.E. 10 Street, Suite 201 Deerfield Beach, FL 33441-5634 or by calling 1-800-965-8307
or 954-785-1121.
|
|
|

