You are not logged in.
This means you
CAN ONLY VIEW reports that were published prior to Monday, April 14, 2025.
You
MUST UPGRADE YOUR MEMBERSHIP if you want to see any current reports.
AFTER MARKET UPDATE - THURSDAY, DECEMBER 1ST, 2011
Previous After Market Report Next After Market Report >>>
|
|
|
|
DOW |
-25.65 |
12,020.03 |
-0.21% |
|
Volume |
856,078,020 |
-49% |
|
Volume |
1,778,103,500 |
-25% |
|
NASDAQ |
+5.86 |
2,626.20 |
+0.22% |
|
Advancers |
1,195 |
38% |
|
Advancers |
932 |
35% |
|
S&P 500 |
-2.38 |
1,244.58 |
-0.19% |
|
Decliners |
1,821 |
58% |
|
Decliners |
1,603 |
61% |
|
Russell 2000 |
-6.67 |
730.75 |
-0.90% |
|
52 Wk Highs |
104 |
|
|
52 Wk Highs |
40 |
|
|
S&P 600 |
-3.42 |
407.06 |
-0.83% |
|
52 Wk Lows |
18 |
|
|
52 Wk Lows |
58 |
|
|
 |
Major Averages Ended Mixed With Volume Totals Cooling
Kenneth J. Gruneisen - Passed the CAN SLIM® Master's Exam
The major averages ended mixed and little changed on Thursday. Decliners led advancers by about 3-2 on the NYSE and on the Nasdaq exchange. Volume totals cooled substantially on the NYSE and on the Nasdaq exchange versus the prior session. New 52-week highs outnumbered new 52-week lows on the NYSE, meanwhile new lows outnumbered new highs on the Nasdaq exchange. There were 47 high-ranked companies from the CANSLIM.net Leaders List that made new 52-week highs and appeared on the CANSLIM.net BreakOuts Page, down from the prior session total of 56 stocks. However, there were gains for 9 of the 15 high-ranked companies currently included on the Featured Stocks Page, a better bias than the broader market.
Investors took some profits and economic data did little to impress on Thursday. U.S. manufacturing grew at the fastest pace in five months, but China's factory sector fell for the first time in almost three years. Separate data showed more Americans than forecast filed unemployment benefit applications last week. This came ahead of Friday's all-important nonfarm payroll number which is expected to show a gain of 122,000 in November. Comments out of Europe were also in focus as ECB President Mario Draghi hinting that the bank would be willing to expand the scope of its bond-purchase program.
Financials were hit the hardest as the Massachusetts Attorney General filed a lawsuit against five national mortgage lenders. Meanwhile, technology finished with minor gains as shares of Yahoo! Inc (YHOO +3.31%) rose on reports that a private-equity group might make a bid for the search engine. Commodities were also active as copper fell for the first time in four days on concern that demand will slow after Chinese manufacturing fell.
Our monthly newsletter CANSLIM.net News will be published soon with an informative review of current market conditions, leading groups, and best buy candidates. Via the Premium Member Homepage links to all prior reports and webcasts are always available.
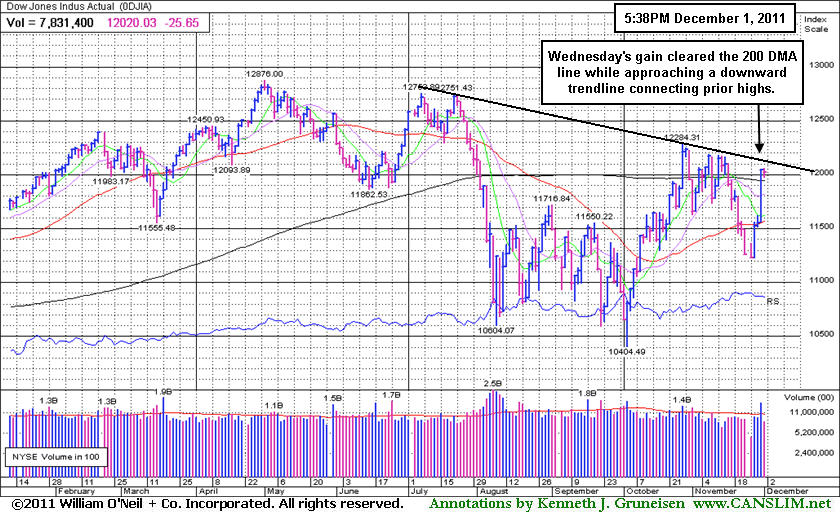
PICTURED: The Dow Jones Industrial Average held its ground after rallying above its 200-day moving average (DMA) line toward a downward trendline connecting prior highs with Wednesday's big gain. The S&P 500 Index and the Nasdaq Composite Index have collectively rallied above their 50-day moving average (DMA) lines with the Dow, but only the Dow is above its important longer-term average.
|
 Kenneth J. Gruneisen started out as a licensed stockbroker in August 1987, a couple of months prior to the historic stock market crash that took the Dow Jones Industrial Average down -22.6% in a single day. He has published daily fact-based fundamental and technical analysis on high-ranked stocks online for two decades. Through FACTBASEDINVESTING.COM, Kenneth provides educational articles, news, market commentary, and other information regarding proven investment systems that work in good times and bad.
Comments contained in the body of this report are technical opinions only and are not necessarily those of Gruneisen Growth Corp. The material herein has been obtained from sources believed to be reliable and accurate, however, its accuracy and completeness cannot be guaranteed. Our firm, employees, and customers may effect transactions, including transactions contrary to any recommendation herein, or have positions in the securities mentioned herein or options with respect thereto. Any recommendation contained in this report may not be suitable for all investors and it is not to be deemed an offer or solicitation on our part with respect to the purchase or sale of any securities. |
|
 |
Financial Shares Drop While Tech Sector Mostly Positive
Kenneth J. Gruneisen - Passed the CAN SLIM® Master's Exam
The Broker/Dealer Index ($XBD -1.29%) and Bank Index ($BKX -0.84%) were a negative influence on the major averages. The Retail Index ($RLX +0.45%) and most tech groups gained ground including the Internet Index ($IIX +0.29%), Biotechnology Index ($BTK +0.43%), and Semiconductor Index ($SOX +0.53%). The weakness in the Networking Index ($NWX -0.83%) and the Healthcare Index ($HMO -0.68%) offset gains elsewhere. Commodity-linked groups also had a slightly negative bias as the Gold & Silver Index ($XAU -0.29%), Oil Services Index ($OSX -0.08%), and Integrated Oil Index ($XOI -0.83%) lost some ground.
Charts courtesy www.stockcharts.com
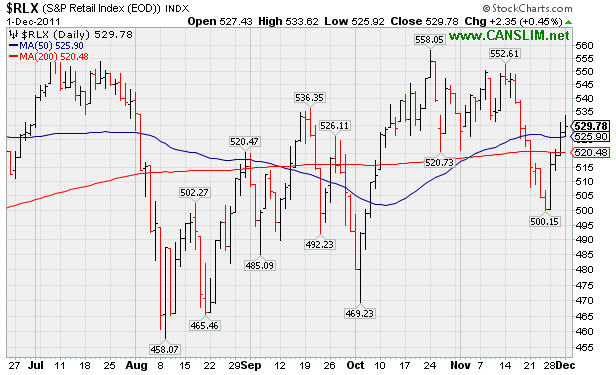
PICTURED: The Retail Index ($RLX +0.45%) posted a 4th consecutive gain. Its technical stance improved greatly by rebounding above its 50-day and 200-day moving average (DMA) lines.
| Oil Services |
$OSX |
230.83 |
-0.18 |
-0.08% |
-5.83% |
| Healthcare |
$HMO |
2,310.13 |
-15.70 |
-0.68% |
+36.53% |
| Integrated Oil |
$XOI |
1,222.49 |
-10.26 |
-0.83% |
+0.77% |
| Semiconductor |
$SOX |
375.31 |
+1.99 |
+0.53% |
-8.87% |
| Networking |
$NWX |
224.52 |
-1.88 |
-0.83% |
-19.97% |
| Internet |
$IIX |
287.67 |
+0.83 |
+0.29% |
-6.52% |
| Broker/Dealer |
$XBD |
82.90 |
-1.08 |
-1.29% |
-31.78% |
| Retail |
$RLX |
529.78 |
+2.35 |
+0.45% |
+4.21% |
| Gold & Silver |
$XAU |
207.70 |
-0.60 |
-0.29% |
-8.33% |
| Bank |
$BKX |
37.88 |
-0.32 |
-0.84% |
-27.45% |
| Biotech |
$BTK |
1,081.33 |
+4.59 |
+0.43% |
-16.67% |
|
|
|
 |
Rebound Above 50-Day Moving Average Needed For Outlook To Improve
Kenneth J. Gruneisen - Passed the CAN SLIM® Master's Exam
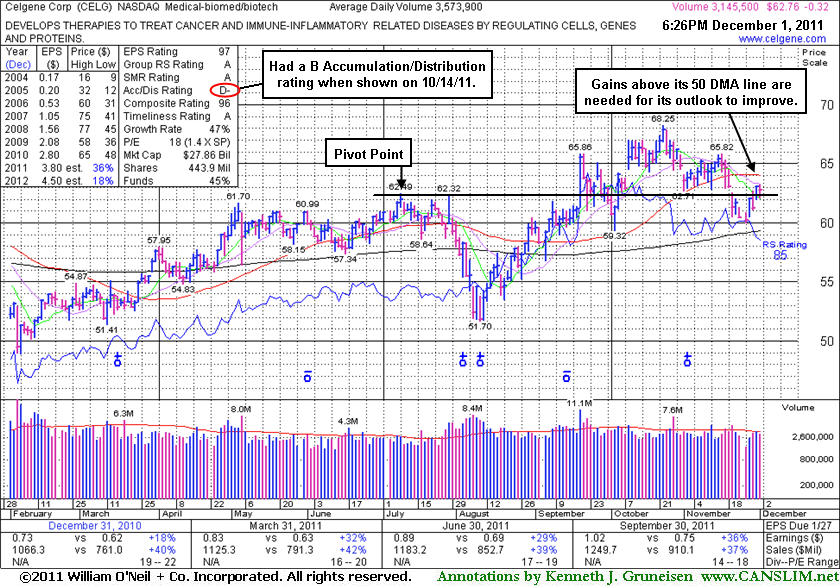
Celgene Corp (CELG -$0.32 or -0.51% to $62.76) is consolidating below its 50-day moving average (DMA) line which may now act as resistance, meanwhile gains above that important short-term average are needed for its outlook to improve. Following its last appearance in this FSU section on 11/07/11 with an annotated graph under the headline, "Consolidation May Be Considered a Secondary Buy Point", it continued consolidating below its "max buy" level and just above its 50-day moving average (DMA) line. Prior highs were noted as important near-term chart support to watch where - "any subsequent violations would raise concerns and trigger technical sell signals." On 11/18/11 it was noted - "Today's 3rd consecutive loss led to a violation of its 50 DMA line raising concerns. A damaging violation of its recent chart low ($62.71 on 11/01/11) would raise greater concerns and trigger a worrisome technical sell signals." It gapped down the next day, and it has been unable to repair the technical damage thus far. As always, disciplined investors limit losses if any stock ever falls more that -7% from their buy point.
When an investor misses a proper technical buy point they often will get additional opportunities to accumulate that same company's shares within the fact-based system's guidelines. New buying efforts may be justified under the fact-based system's guidelines with an ideal "secondary buy point" between the first successful test of support near a stock's 50 DMA line, on up to as much as +5% above its latest high. However, historic studies have shown that investors' odds are most favorable when buying fresh breakouts while the stock is rising above its pivot point, rather than buying when a stock is pulling back into the ideal buying range.
|
|
|
Color Codes Explained :
Y - Better candidates highlighted by our
staff of experts.
G - Previously featured
in past reports as yellow but may no longer be buyable under the
guidelines.
***Last / Change / Volume data in this table is the closing quote data***
Symbol/Exchange
Company Name
Industry Group |
PRICE |
CHANGE
(%Change) |
Day High |
Volume
(% DAV)
(% 50 day avg vol) |
52 Wk Hi
% From Hi |
Featured
Date |
Price
Featured |
Pivot Featured |
|
Max Buy |
ADS
-
NYSE
Alliance Data Sys Corp
COMPUTER SOFTWARE and SERVICES - Information and Delivery Service
|
$103.33
|
+0.92
0.90% |
$104.47
|
907,812
95.57% of 50 DAV
50 DAV is 949,900
|
$107.18
-3.59%
|
10/21/2011
|
$97.94
|
PP = $101.15
|
|
MB = $106.21
|
Most Recent Note - 11/30/2011 11:54:10 AM
Y - Rebounding back above its 50 DMA line and rising toward prior highs. Color code is changed to yellow (no new pivot point cited) based on its resilience and another gap up today.
>>> The latest Featured Stock Update with an annotated graph appeared on 11/17/2011. Click here.
View all notes |
Alert me of new notes |
CANSLIM.net Company Profile |
SEC |
Zacks Reports |
StockTalk |
News |
Chart |
Request a new note
C
A N
S L
I M


|
ALXN
-
NASDAQ
Alexion Pharmaceuticals
DRUGS - Drug Manufacturers - Other
|
$69.26
|
+0.60
0.87% |
$69.27
|
798,721
52.50% of 50 DAV
50 DAV is 1,521,300
|
$70.42
-1.65%
|
11/30/2011
|
$68.66
|
PP = $70.52
|
|
MB = $74.05
|
Most Recent Note - 11/30/2011 7:18:01 PM
Y - Rallied within close striking distance of its 52 week high with today's gain on average volume. A new pivot point is cited based on its 52-week high plus ten cents after forming an orderly flat base pattern. Volume-driven gains are needed to trigger a new (or add-on) technical buy signal.
>>> The latest Featured Stock Update with an annotated graph appeared on 11/14/2011. Click here.
View all notes |
Alert me of new notes |
CANSLIM.net Company Profile |
SEC |
Zacks Reports |
StockTalk |
News |
Chart |
Request a new note
C
A N
S L
I M
|
CELG
-
NASDAQ
Celgene Corp
DRUGS - Drug Manufacturers - Major
|
$62.76
|
-0.32
-0.51% |
$63.21
|
3,151,107
82.02% of 50 DAV
50 DAV is 3,841,700
|
$68.25
-8.04%
|
9/16/2011
|
$61.21
|
PP = $62.59
|
|
MB = $65.72
|
 Most Recent Note - 12/1/2011 6:52:51 PM
G - It remains below its 50 DMA line which may now act as resistance. Gains above its short-term average are needed for its outlook to improve. See the latest FSU analysis for more details and a new annotated graph.
>>> The latest Featured Stock Update with an annotated graph appeared on 12/1/2011. Click here.
View all notes |
Alert me of new notes |
CANSLIM.net Company Profile |
SEC |
Zacks Reports |
StockTalk |
News |
Chart |
Request a new note
C
A N
S L
I M
|
FEIC
-
NASDAQ
F E I Co
ELECTRONICS - Diversified Electronics
|
$40.39
|
+0.03
0.07% |
$40.63
|
287,757
65.86% of 50 DAV
50 DAV is 436,900
|
$42.25
-4.40%
|
10/28/2011
|
$40.31
|
PP = $40.88
|
|
MB = $42.92
|
Most Recent Note - 11/30/2011 11:45:16 AM
G - Gapped up today, rebounding toward prior highs. It faces resistance due to overhead supply up through the $42 area.
>>> The latest Featured Stock Update with an annotated graph appeared on 11/25/2011. Click here.
View all notes |
Alert me of new notes |
CANSLIM.net Company Profile |
SEC |
Zacks Reports |
StockTalk |
News |
Chart |
Request a new note
C
A N
S L
I M
|
GNC
-
NYSE
G N C Holdings Inc
RETAIL - Drug Stores
|
$27.69
|
+0.42
1.54% |
$28.01
|
1,115,376
86.85% of 50 DAV
50 DAV is 1,284,300
|
$28.50
-2.84%
|
10/26/2011
|
$24.60
|
PP = $24.80
|
|
MB = $26.04
|
Most Recent Note - 11/30/2011 7:23:05 PM
G - Today it traded heavy volume but didn't make meaningful price progress while churning near its all-time high. Prior chart highs in the $25-26 area define initial support to watch on pullbacks.
>>> The latest Featured Stock Update with an annotated graph appeared on 11/21/2011. Click here.
View all notes |
Alert me of new notes |
CANSLIM.net Company Profile |
SEC |
Zacks Reports |
StockTalk |
News |
Chart |
Request a new note
C
A N
S L
I M
|
Symbol/Exchange
Company Name
Industry Group |
PRICE |
CHANGE
(%Change) |
Day High |
Volume
(% DAV)
(% 50 day avg vol) |
52 Wk Hi
% From Hi |
Featured
Date |
Price
Featured |
Pivot Featured |
|
Max Buy |
HMSY
-
NASDAQ
H M S Holdings Corp
COMPUTER SOFTWARE and SERVICES - Healthcare Information Service
|
$29.61
|
-0.72
-2.37% |
$30.66
|
568,146
83.72% of 50 DAV
50 DAV is 678,600
|
$31.99
-7.44%
|
10/27/2011
|
$26.44
|
PP = $28.37
|
|
MB = $29.79
|
Most Recent Note - 12/1/2011 6:51:08 PM
G - Pulled back today on light volume and finished near its "max buy" level. Prior highs in the $27-28 area acted as support during the recent pullback. See the latest FSU analysis for more details and a new annotated weekly graph.
>>> The latest Featured Stock Update with an annotated graph appeared on 11/30/2011. Click here.
View all notes |
Alert me of new notes |
CANSLIM.net Company Profile |
SEC |
Zacks Reports |
StockTalk |
News |
Chart |
Request a new note
C
A N
S L
I M
|
ISRG
-
NASDAQ
Intuitive Surgical Inc
HEALTH SERVICES - Medical Appliances and Equipment
|
$435.59
|
+1.38
0.32% |
$438.56
|
421,134
102.04% of 50 DAV
50 DAV is 412,700
|
$449.06
-3.00%
|
10/19/2011
|
$424.69
|
PP = $415.29
|
|
MB = $436.05
|
Most Recent Note - 11/30/2011 7:26:55 PM
Y - Gapped up again today for a solid gain on above average. Found support recently well above its 50 DMA line near prior chart highs.
>>> The latest Featured Stock Update with an annotated graph appeared on 11/15/2011. Click here.
View all notes |
Alert me of new notes |
CANSLIM.net Company Profile |
SEC |
Zacks Reports |
StockTalk |
News |
Chart |
Request a new note
C
A N
S L
I M
|
MG
-
NYSE
Mistras Group Inc
DIVERSIFIED SERVICES - Bulding and Faci;ity Management Services
|
$23.17
|
-0.36
-1.53% |
$24.12
|
124,059
59.90% of 50 DAV
50 DAV is 207,100
|
$24.01
-3.50%
|
10/28/2011
|
$22.49
|
PP = $23.61
|
|
MB = $24.79
|
Most Recent Note - 11/30/2011 11:49:01 AM
Y - Gapped up again today, rallying above its pivot point, and a strong close with sufficient volume may trigger a proper technical buy signal. Its 50 DMA line and prior highs acted as support.
>>> The latest Featured Stock Update with an annotated graph appeared on 11/11/2011. Click here.
View all notes |
Alert me of new notes |
CANSLIM.net Company Profile |
SEC |
Zacks Reports |
StockTalk |
News |
Chart |
Request a new note
C
A N
S L
I M
|
MKTX
-
NASDAQ
Marketaxess Holdings Inc
FINANCIAL SERVICES - Investment Brokerage - Nationa
|
$28.70
|
-0.24
-0.83% |
$29.36
|
130,290
53.82% of 50 DAV
50 DAV is 242,100
|
$31.45
-8.74%
|
10/28/2011
|
$29.79
|
PP = $31.05
|
|
MB = $32.60
|
Most Recent Note - 11/30/2011 7:12:48 PM
G - Gapped up today and posted a gain with slightly above average volume. It still faces previously stubborn resistance in the $31 area.
>>> The latest Featured Stock Update with an annotated graph appeared on 11/23/2011. Click here.
View all notes |
Alert me of new notes |
CANSLIM.net Company Profile |
SEC |
Zacks Reports |
StockTalk |
News |
Chart |
Request a new note
C
A N
S L
I M
|
OSIS
-
NASDAQ
O S I Systems Inc
ELECTRONICS - Semiconductor Equipment and Mate
|
$46.56
|
-1.25
-2.61% |
$48.00
|
106,195
71.56% of 50 DAV
50 DAV is 148,400
|
$47.83
-2.65%
|
11/1/2011
|
$42.07
|
PP = $45.57
|
|
MB = $47.85
|
Most Recent Note - 12/1/2011 6:49:23 PM
Y - Pulled back today on lighter than average volume. Its gap gain with +44% above average volume on the prior session cleared its previously cited pivot point confirming a technical buy signal. The recent lows ($42.20 on 11/25/11) defines an important support level to watch. See the latest FSU analysis for more details and a new annotated graph.
>>> The latest Featured Stock Update with an annotated graph appeared on 11/28/2011. Click here.
View all notes |
Alert me of new notes |
CANSLIM.net Company Profile |
SEC |
Zacks Reports |
StockTalk |
News |
Chart |
Request a new note
C
A N
S L
I M
|
Symbol/Exchange
Company Name
Industry Group |
PRICE |
CHANGE
(%Change) |
Day High |
Volume
(% DAV)
(% 50 day avg vol) |
52 Wk Hi
% From Hi |
Featured
Date |
Price
Featured |
Pivot Featured |
|
Max Buy |
RAX
-
NYSE
Rackspace Hosting Inc
INTERNET - Internet Software and; Services
|
$43.51
|
+0.13
0.30% |
$43.97
|
1,329,496
83.58% of 50 DAV
50 DAV is 1,590,600
|
$46.50
-6.42%
|
11/8/2011
|
$44.28
|
PP = $46.27
|
|
MB = $48.58
|
Most Recent Note - 11/30/2011 7:08:06 PM
Y - Gapped up today for a 3rd consecutive gain with average volume, rallying from support at its closely coinciding 50 and 200 DMA lines. Subsequent violations would trigger damaging technical sell signals. Its color code is changed to yellow based on its resilience, however it still faces previously stubborn resistance in the $45 area.
>>> The latest Featured Stock Update with an annotated graph appeared on 11/10/2011. Click here.
View all notes |
Alert me of new notes |
CANSLIM.net Company Profile |
SEC |
Zacks Reports |
StockTalk |
News |
Chart |
Request a new note
C
A N
S L
I M
|
SWI
-
NYSE
Solarwinds Inc
COMPUTER SOFTWARE and SERVICES - Application Software
|
$32.29
|
-0.50
-1.52% |
$33.14
|
720,158
61.44% of 50 DAV
50 DAV is 1,172,200
|
$33.06
-2.33%
|
10/27/2011
|
$27.78
|
PP = $25.62
|
|
MB = $26.90
|
Most Recent Note - 11/30/2011 11:43:10 AM
G - Gapped up today for a considerable gain and a new all-time high, getting extended from its prior base. Prior highs in the $25-26 area define initial chart support to watch on pullbacks.
>>> The latest Featured Stock Update with an annotated graph appeared on 11/22/2011. Click here.
View all notes |
Alert me of new notes |
CANSLIM.net Company Profile |
SEC |
Zacks Reports |
StockTalk |
News |
Chart |
Request a new note
C
A N
S L
I M
|
TDG
-
NYSE
Transdigm Group Inc
AEROSPACE/DEFENSE - Aerospace/Defense Products and; Services
|
$97.68
|
+1.26
1.31% |
$98.00
|
322,510
78.09% of 50 DAV
50 DAV is 413,000
|
$102.73
-4.92%
|
11/9/2011
|
$98.45
|
PP = $95.14
|
|
MB = $99.90
|
Most Recent Note - 11/30/2011 11:57:21 AM
Y - Gapped up today, and it stayed well above its 50 DMA line during its recent consolidation. A subsequent slump below the recent low and its 50 DMA line would trigger technical sell signals.
>>> The latest Featured Stock Update with an annotated graph appeared on 11/9/2011. Click here.
View all notes |
Alert me of new notes |
CANSLIM.net Company Profile |
SEC |
Zacks Reports |
StockTalk |
News |
Chart |
Request a new note
C
A N
S L
I M
|
UA
-
NYSE
Under Armour Inc Cl A
CONSUMER NON-DURABLES - Textile - Apparel Clothing
|
$81.86
|
+0.53
0.65% |
$82.39
|
896,364
67.48% of 50 DAV
50 DAV is 1,328,400
|
$87.40
-6.34%
|
10/25/2011
|
$82.43
|
PP = $80.80
|
|
MB = $84.84
|
Most Recent Note - 11/30/2011 12:00:32 PM
G - Gapped up today rallying toward prior highs. Subsequent weakness exceeding the recent low ($73.55 on 11/21/11) would raise concerns and trigger a technical sell signal.
>>> The latest Featured Stock Update with an annotated graph appeared on 11/29/2011. Click here.
View all notes |
Alert me of new notes |
CANSLIM.net Company Profile |
SEC |
Zacks Reports |
StockTalk |
News |
Chart |
Request a new note
C
A N
S L
I M
|
V
-
NYSE
Visa Inc Cl A
DIVERSIFIED SERVICES - Business/Management Services
|
$97.76
|
+0.79
0.81% |
$98.26
|
4,760,526
89.73% of 50 DAV
50 DAV is 5,305,100
|
$97.03
0.75%
|
10/24/2011
|
$94.21
|
PP = $94.85
|
|
MB = $99.59
|
Most Recent Note - 11/30/2011 12:48:14 PM
Y - Gapped up today challenging its 52-week high without great volume conviction helping it rally. Proof of serious institutional demand requires at least +50% heavier than average volume behind a meaningful gain.
>>> The latest Featured Stock Update with an annotated graph appeared on 11/18/2011. Click here.
View all notes |
Alert me of new notes |
CANSLIM.net Company Profile |
SEC |
Zacks Reports |
StockTalk |
News |
Chart |
Request a new note
C
A N
S L
I M
|
Symbol/Exchange
Company Name
Industry Group |
PRICE |
CHANGE
(%Change) |
Day High |
Volume
(% DAV)
(% 50 day avg vol) |
52 Wk Hi
% From Hi |
Featured
Date |
Price
Featured |
Pivot Featured |
|
Max Buy |
|
|
|
THESE ARE NOT BUY RECOMMENDATIONS!
Comments contained in the body of this report are technical
opinions only. The material herein has been obtained
from sources believed to be reliable and accurate, however,
its accuracy and completeness cannot be guaranteed.
This site is not an investment advisor, hence it does
not endorse or recommend any securities or other investments.
Any recommendation contained in this report may not
be suitable for all investors and it is not to be deemed
an offer or solicitation on our part with respect to
the purchase or sale of any securities. All trademarks,
service marks and trade names appearing in this report
are the property of their respective owners, and are
likewise used for identification purposes only.
This report is a service available
only to active Paid Premium Members.
You may opt-out of receiving report notifications
at any time. Questions or comments may be submitted
by writing to Premium Membership Services 665 S.E. 10 Street, Suite 201 Deerfield Beach, FL 33441-5634 or by calling 1-800-965-8307
or 954-785-1121.
|
|
|

