***Last / Change / Volume data in this table is the closing quote data***
Symbol/Exchange
Company Name
Industry Group |
PRICE |
CHANGE
(%Change) |
Day High |
Volume
(% DAV)
(% 50 day avg vol) |
52 Wk Hi
% From Hi |
Featured
Date |
Price
Featured |
Pivot Featured |
|
Max Buy |
ABV
-
NYSE
Comp De Bebidas Adr
FOOD and BEVERAGE - Beverages - Brewers
|
$136.97
|
+3.31
2.48% |
$138.55
|
522,525
80.56% of 50 DAV
50 DAV is 648,600
|
$145.36
-5.77%
|
11/4/2010
|
$142.35
|
PP = $143.63
|
|
MB = $150.81
|
 Most Recent Note - 12/1/2010 5:14:16 PM
G - Posted a gain on light volume today, finding support near its 50 DMA line. Color code was changed to green following recent distributional pressure after stalling.
>>> The latest Featured Stock Update with an annotated graph appeared on 10/11/2010. Click here.
View all notes |
Alert me of new notes |
CANSLIM.net Company Profile |
SEC |
Zacks Reports |
StockTalk |
News |
Chart |
Request a new note
C
A N
S L
I M


|
ARUN
-
NASDAQ
Aruba Networks Inc
COMPUTER HARDWARE - Networking andamp; Communication Dev
|
$22.91
|
+1.67
7.85% |
$23.05
|
6,962,834
279.19% of 50 DAV
50 DAV is 2,493,900
|
$24.28
-5.64%
|
8/30/2010
|
$18.12
|
PP = $18.51
|
|
MB = $19.44
|
Most Recent Note - 12/1/2010 5:14:56 PM
G - Considerable gain today with heavy volume promptly repaired the prior session's 50 DMA line violation, a sign of great institutional support. It made a stand near an upward trendline connecting May - November lows previously noted as support to watch.
>>> The latest Featured Stock Update with an annotated graph appeared on 10/26/2010. Click here.
View all notes |
Alert me of new notes |
CANSLIM.net Company Profile |
SEC |
Zacks Reports |
StockTalk |
News |
Chart |
Request a new note
C
A N
S L
I M
|
BIDU
-
NASDAQ
Baidu Inc Ads
INTERNET - Internet Information Providers
|
$106.81
|
+1.76
1.68% |
$107.92
|
6,835,217
55.09% of 50 DAV
50 DAV is 12,407,900
|
$115.04
-7.15%
|
9/17/2010
|
$85.73
|
PP = $88.42
|
|
MB = $92.84
|
Most Recent Note - 12/1/2010 5:16:56 PM
G - Posted a small gain today with light volume, and volume totals have been cooling while consolidating near its 50 DMA line. Any damaging violation of its short-term average or recent chart low ($103.11 on 11/16/10) would raise greater concerns and trigger technical sell signals. BIDU has been noted as a riskier "late stage" candidate, yet could produce more climactic gains.
>>> The latest Featured Stock Update with an annotated graph appeared on 11/30/2010. Click here.
View all notes |
Alert me of new notes |
CANSLIM.net Company Profile |
SEC |
Zacks Reports |
StockTalk |
News |
Chart |
Request a new note
C
A N
S L
I M
|
CACC
-
NASDAQ
Credit Acceptance Corp
FINANCIAL SERVICES - Credit Services
|
$61.89
|
-0.18
-0.29% |
$62.00
|
21,525
89.69% of 50 DAV
50 DAV is 24,000
|
$63.45
-2.46%
|
11/22/2010
|
$59.97
|
PP = $62.00
|
|
MB = $65.10
|
Most Recent Note - 12/1/2010 5:20:32 PM
Y - Another small loss today with light volume has its slumping slightly under its pivot point, yet the M criteria has now been reconfirmed by a solid follow-through day. Its 11/29/10 gain with +69% above average volume helped it rally above the pivot point of a "double bottom" type base pattern, meeting the guidelines for a new (or add-on) technical buy signal. Additional volume driven gains would be a reassuring sign.
>>> The latest Featured Stock Update with an annotated graph appeared on 10/29/2010. Click here.
View all notes |
Alert me of new notes |
CANSLIM.net Company Profile |
SEC |
Zacks Reports |
StockTalk |
News |
Chart |
Request a new note
C
A N
S L
I M
|
CIS
-
NYSE
Camelot Info Systems Ads
COMPUTER SOFTWARE andamp; SERVICES - Information Technology Service
|
$24.68
|
+1.79
7.82% |
$24.89
|
654,432
230.84% of 50 DAV
50 DAV is 283,500
|
$23.09
6.89%
|
11/26/2010
|
$18.93
|
PP = $19.72
|
|
MB = $20.71
|
Most Recent Note - 12/1/2010 5:21:17 PM
G - Strong action today for the major averages (M criteria) was a solid follow-through day offering investors an important reassurance. This Chinese Computer Software firm hit yet another new 52-week high, and its color code was changed to green after it quickly got extended from a sound base.
>>> The latest Featured Stock Update with an annotated graph appeared on 11/26/2010. Click here.
View all notes |
Alert me of new notes |
CANSLIM.net Company Profile |
SEC |
Zacks Reports |
StockTalk |
News |
Chart |
Request a new note
C
A N
S L
I M
|
Symbol/Exchange
Company Name
Industry Group |
PRICE |
CHANGE
(%Change) |
Day High |
Volume
(% DAV)
(% 50 day avg vol) |
52 Wk Hi
% From Hi |
Featured
Date |
Price
Featured |
Pivot Featured |
|
Max Buy |
CMG
-
NYSE
Chipotle Mexican Grill
LEISURE - Restaurants
|
$258.82
|
+0.33
0.13% |
$262.00
|
1,266,555
147.33% of 50 DAV
50 DAV is 859,700
|
$262.78
-1.51%
|
9/1/2010
|
$158.31
|
PP = $155.52
|
|
MB = $163.30
|
Most Recent Note - 12/1/2010 5:22:46 PM
G - Up for a 8th consecutive session today, recently inching higher with small gains. It is extended from any sound base pattern. Its 50 DMA line (now $205) defines the nearest chart support level.
>>> The latest Featured Stock Update with an annotated graph appeared on 10/28/2010. Click here.
View all notes |
Alert me of new notes |
CANSLIM.net Company Profile |
SEC |
Zacks Reports |
StockTalk |
News |
Chart |
Request a new note
C
A N
S L
I M
|
CTRP
-
NASDAQ
Ctrip.Com Intl Ltd Adr
LEISURE - Resorts and Casinos
|
$42.73
|
-1.05
-2.39% |
$45.48
|
4,648,365
225.31% of 50 DAV
50 DAV is 2,063,100
|
$53.16
-19.62%
|
9/24/2010
|
$46.75
|
PP = $47.11
|
|
MB = $49.47
|
Most Recent Note - 12/1/2010 5:27:16 PM
G - Down again today on heavier volume, indicating more worrisome distributional pressure after violating the previously noted low on the prior session. Based on mounting technical damage (finished -19.6% off its 52-week high) it will be dropped from the Featured Stocks list tonight. Only a subsequent rebound above its 50 DMA line would help its outlook.
>>> The latest Featured Stock Update with an annotated graph appeared on 11/22/2010. Click here.
View all notes |
Alert me of new notes |
CANSLIM.net Company Profile |
SEC |
Zacks Reports |
StockTalk |
News |
Chart |
Request a new note
C
A N
S L
I M
|
DECK
-
NASDAQ
Deckers Outdoor Corp
CONSUMER NON-DURABLES - Textile - Apparel Footwear
|
$79.94
|
+3.04
3.95% |
$80.00
|
3,985,457
312.83% of 50 DAV
50 DAV is 1,274,000
|
$77.37
3.32%
|
10/27/2010
|
$54.16
|
PP = $54.86
|
|
MB = $57.60
|
Most Recent Note - 12/1/2010 2:39:51 PM
G - Gapped up today for a 10th consecutive gain, rallying to new all-time high territory. It has been noted as extended from its latest sound base. Prior highs and its 50 DMA line define the nearest chart support.
>>> The latest Featured Stock Update with an annotated graph appeared on 10/27/2010. Click here.
View all notes |
Alert me of new notes |
CANSLIM.net Company Profile |
SEC |
Zacks Reports |
StockTalk |
News |
Chart |
Request a new note
C
A N
S L
I M
|
EZPW
-
NASDAQ
Ezcorp Inc Cl A
SPECIALTY RETAIL - Specialty Retail, Other
|
$26.26
|
+1.10
4.37% |
$26.42
|
417,886
140.09% of 50 DAV
50 DAV is 298,300
|
$26.14
0.46%
|
11/5/2010
|
$24.02
|
PP = $23.85
|
|
MB = $25.04
|
Most Recent Note - 12/1/2010 5:29:27 PM
G - Solid gain for a new all-time high, getting extended from a sound base pattern. Prior highs in the $22-23 area define chart support to watch near its 50 DMA line.
>>> The latest Featured Stock Update with an annotated graph appeared on 11/6/2010. Click here.
View all notes |
Alert me of new notes |
CANSLIM.net Company Profile |
SEC |
Zacks Reports |
StockTalk |
News |
Chart |
Request a new note
C
A N
S L
I M
|
FFIV
-
NASDAQ
F 5 Networks Inc
INTERNET - Internet Software and Services
|
$138.96
|
+7.08
5.37% |
$139.88
|
3,797,201
133.76% of 50 DAV
50 DAV is 2,838,900
|
$136.00
2.18%
|
6/16/2010
|
$74.50
|
PP = $74.10
|
|
MB = $77.81
|
Most Recent Note - 12/1/2010 5:30:14 PM
G - Closed near the session high after another volume-driven gain for a new all-time high. Extended from any sound base pattern. Prior highs in the $112 area define initial chart support.
>>> The latest Featured Stock Update with an annotated graph appeared on 11/15/2010. Click here.
View all notes |
Alert me of new notes |
CANSLIM.net Company Profile |
SEC |
Zacks Reports |
StockTalk |
News |
Chart |
Request a new note
C
A N
S L
I M
|
Symbol/Exchange
Company Name
Industry Group |
PRICE |
CHANGE
(%Change) |
Day High |
Volume
(% DAV)
(% 50 day avg vol) |
52 Wk Hi
% From Hi |
Featured
Date |
Price
Featured |
Pivot Featured |
|
Max Buy |
FOSL
-
NASDAQ
Fossil Inc
CONSUMER DURABLES - Recreational Goods, Other
|
$68.25
|
+0.60
0.89% |
$68.98
|
782,725
99.53% of 50 DAV
50 DAV is 786,400
|
$70.07
-2.60%
|
11/26/2010
|
$69.10
|
PP = $70.17
|
|
MB = $73.68
|
Most Recent Note - 12/1/2010 5:32:07 PM
Y - Holding its ground perched near its all-time high. Color code was changed to yellow after an advanced "3-weeks tight" pattern was identified following a considerable rally from its prior base. Disciplined investors will resist the temptation to get in "early" while watching for a convincing breakout as a critical reassurance before new (or add-on) buying efforts are justified under the investment system guidelines. An upward trendline connecting its July-October lows defines support to watch above its 50 DMA line.
>>> The latest Featured Stock Update with an annotated graph appeared on 11/29/2010. Click here.
View all notes |
Alert me of new notes |
CANSLIM.net Company Profile |
SEC |
Zacks Reports |
StockTalk |
News |
Chart |
Request a new note
C
A N
S L
I M
|
HMSY
-
NASDAQ
H M S Holdings Corp
COMPUTER SOFTWARE and SERVICES - Healthcare Information Service
|
$64.38
|
+1.37
2.17% |
$64.75
|
175,635
84.12% of 50 DAV
50 DAV is 208,800
|
$64.09
0.45%
|
11/19/2010
|
$61.89
|
PP = $63.01
|
|
MB = $66.16
|
Most Recent Note - 12/1/2010 5:33:30 PM
Y - Volume total was light today as it traded further above its pivot point for another new 52-week high. Volume did not meet the guideline to trigger a proper new (or add-on) technical buy signal. Its 50 DMA line defines important support to watch.
>>> The latest Featured Stock Update with an annotated graph appeared on 11/19/2010. Click here.
View all notes |
Alert me of new notes |
CANSLIM.net Company Profile |
SEC |
Zacks Reports |
StockTalk |
News |
Chart |
Request a new note
C
A N
S L
I M
|
HS
-
NYSE
Healthspring Inc
HEALTH SERVICES - Health Care Plans
|
$27.84
|
+1.01
3.76% |
$28.06
|
449,721
68.00% of 50 DAV
50 DAV is 661,400
|
$29.80
-6.58%
|
8/27/2010
|
$19.91
|
PP = $19.75
|
|
MB = $20.74
|
Most Recent Note - 12/1/2010 5:35:55 PM
G - Gain today with below average volume helped it promptly repair a 50 DMA line violation. It tested that important short-term average for the first time since August, meanwhile any more damaging losses would raise concerns and trigger a technical sell signal.
>>> The latest Featured Stock Update with an annotated graph appeared on 10/22/2010. Click here.
View all notes |
Alert me of new notes |
CANSLIM.net Company Profile |
SEC |
Zacks Reports |
StockTalk |
News |
Chart |
Request a new note
C
A N
S L
I M
|
IGTE
-
NASDAQ
Igate Corp
COMPUTER SOFTWARE and SERVICES - Information Technology Service
|
$19.32
|
-0.68
-3.40% |
$20.35
|
2,321,559
337.78% of 50 DAV
50 DAV is 687,300
|
$24.99
-22.69%
|
10/26/2010
|
$17.29
|
PP = $19.55
|
|
MB = $20.53
|
Most Recent Note - 12/1/2010 5:41:14 PM
G - Ended near the session low today with a loss on above average volume. It traded 9 times average volume and sliced below its 50 DMA line, triggering a technical sell signal on 11/30/10 with its largest point loss on largest volume ever. Based on technical damage (now -22.7% off its 52-week high) it will be dropped from the Featured Stocks list tonight.
>>> The latest Featured Stock Update with an annotated graph appeared on 11/11/2010. Click here.
View all notes |
Alert me of new notes |
CANSLIM.net Company Profile |
SEC |
Zacks Reports |
StockTalk |
News |
Chart |
Request a new note
C
A N
S L
I M
|
JOBS
-
NASDAQ
Fifty One Job Inc Ads
DIVERSIFIED SERVICES - Staffing and; Outsourcing Service
|
$53.00
|
+2.26
4.45% |
$53.70
|
236,097
117.05% of 50 DAV
50 DAV is 201,700
|
$51.84
2.24%
|
10/13/2010
|
$42.07
|
PP = $40.60
|
|
MB = $42.63
|
Most Recent Note - 12/1/2010 5:42:14 PM
G - Gapped up today for a new 52-week high. It is extended from a sound base, and its 50 DMA line defines important support to watch.
>>> The latest Featured Stock Update with an annotated graph appeared on 11/16/2010. Click here.
View all notes |
Alert me of new notes |
CANSLIM.net Company Profile |
SEC |
Zacks Reports |
StockTalk |
News |
Chart |
Request a new note
C
A N
S L
I M
|
Symbol/Exchange
Company Name
Industry Group |
PRICE |
CHANGE
(%Change) |
Day High |
Volume
(% DAV)
(% 50 day avg vol) |
52 Wk Hi
% From Hi |
Featured
Date |
Price
Featured |
Pivot Featured |
|
Max Buy |
LFT
-
NYSE
Longtop Financl Tech Ads
COMPUTER SOFTWARE and SERVICES - Business Software and Services
|
$39.59
|
+0.03
0.08% |
$40.62
|
861,150
159.06% of 50 DAV
50 DAV is 541,400
|
$42.86
-7.63%
|
11/5/2010
|
$41.83
|
PP = $40.96
|
|
MB = $43.01
|
Most Recent Note - 12/1/2010 5:45:25 PM
Y - Perched -7.6% off its all-time high, it closed near today's session low while higher volume without meaningful price progress was indicative of more worrisome distributional pressure. Its latest slump below its pivot point raised concerns while it is still consolidating above support near its 50 DMA line.
>>> The latest Featured Stock Update with an annotated graph appeared on 10/14/2010. Click here.
View all notes |
Alert me of new notes |
CANSLIM.net Company Profile |
SEC |
Zacks Reports |
StockTalk |
News |
Chart |
Request a new note
C
A N
S L
I M
|
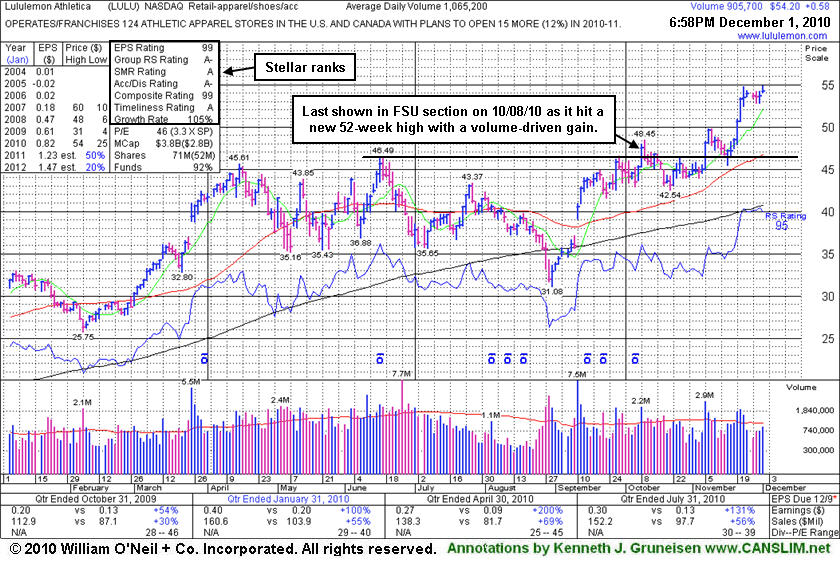
LULU
-
NASDAQ
Lululemon Athletica
MANUFACTURING - Textile Manufacturing
|
$54.20
|
+0.58
1.08% |
$54.86
|
905,675
84.86% of 50 DAV
50 DAV is 1,067,300
|
$54.77
-1.04%
|
10/8/2010
|
$47.66
|
PP = $46.67
|
|
MB = $49.00
|
Most Recent Note - 12/1/2010 5:47:36 PM
G - Volume total was below average today as it touched a new 52-week high after a tight consolidation following volume-driven gains. Prior highs in the $46-48 area define chart support to watch along with its 50 DMA line.
>>> The latest Featured Stock Update with an annotated graph appeared on 12/1/2010. Click here.
View all notes |
Alert me of new notes |
CANSLIM.net Company Profile |
SEC |
Zacks Reports |
StockTalk |
News |
Chart |
Request a new note
C
A N
S L
I M
|
MWIV
-
NASDAQ
M W I Veterinary Supply
HEALTH SERVICES - Medical Instruments and; Supplies
|
$62.24
|
+1.14
1.87% |
$62.87
|
52,366
92.36% of 50 DAV
50 DAV is 56,700
|
$63.94
-2.66%
|
11/4/2010
|
$61.79
|
PP = $59.60
|
|
MB = $62.58
|
Most Recent Note - 12/1/2010 5:49:05 PM
Y - Gap up gain today on below average volume for its best ever close. Its 50 DMA line has been repeatedly noted as a very important support level. It stalled after hitting its all-time high on 11/04/10, yet held its ground stubbornly above its short-term average.
>>> The latest Featured Stock Update with an annotated graph appeared on 11/2/2010. Click here.
View all notes |
Alert me of new notes |
CANSLIM.net Company Profile |
SEC |
Zacks Reports |
StockTalk |
News |
Chart |
Request a new note
C
A N
S L
I M
|
NEOG
-
NASDAQ
Neogen Corp
DRUGS - Diagnostic Substances
|
$38.41
|
+1.26
3.39% |
$38.88
|
142,630
179.86% of 50 DAV
50 DAV is 79,300
|
$37.97
1.17%
|
9/1/2010
|
$30.79
|
PP = $30.49
|
|
MB = $32.01
|
Most Recent Note - 12/1/2010 5:50:51 PM
G - Gapped up for a gain today with above average volume to a new all-time high. It is extended from any sound base, and its 50 DMA line recently has been a reliable support level.
>>> The latest Featured Stock Update with an annotated graph appeared on 10/13/2010. Click here.
View all notes |
Alert me of new notes |
CANSLIM.net Company Profile |
SEC |
Zacks Reports |
StockTalk |
News |
Chart |
Request a new note
C
A N
S L
I M
|
NFLX
-
NASDAQ
Netflix Inc
SPECIALTY RETAIL - Music and Video Stores
|
$200.14
|
-5.76
-2.80% |
$209.24
|
10,672,271
184.32% of 50 DAV
50 DAV is 5,790,100
|
$206.80
-3.22%
|
11/9/2010
|
$173.10
|
PP = $184.84
|
|
MB = $194.08
|
Most Recent Note - 12/1/2010 5:53:21 PM
G - Extended from its latest base, it reversed into the red after hitting a new all-time high today and closed near the session low for a loss with above average volume. Prior highs near $184 define initial chart support to watch above its 50 DMA line.
>>> The latest Featured Stock Update with an annotated graph appeared on 11/24/2010. Click here.
View all notes |
Alert me of new notes |
CANSLIM.net Company Profile |
SEC |
Zacks Reports |
StockTalk |
News |
Chart |
Request a new note
C
A N
S L
I M
|
Symbol/Exchange
Company Name
Industry Group |
PRICE |
CHANGE
(%Change) |
Day High |
Volume
(% DAV)
(% 50 day avg vol) |
52 Wk Hi
% From Hi |
Featured
Date |
Price
Featured |
Pivot Featured |
|
Max Buy |
NTAP
-
NASDAQ
Netapp Inc
COMPUTER HARDWARE - Data Storage Devices
|
$52.19
|
+1.26
2.47% |
$52.29
|
6,763,872
93.24% of 50 DAV
50 DAV is 7,253,900
|
$57.96
-9.96%
|
9/8/2010
|
$46.98
|
PP = $44.99
|
|
MB = $47.24
|
Most Recent Note - 12/1/2010 5:56:22 PM
G - Gapped up and rallied back above its 50 DMA line with near average volume. It is not near a sound base pattern, but the gain above its short-term average improves its technical stance.
>>> The latest Featured Stock Update with an annotated graph appeared on 11/3/2010. Click here.
View all notes |
Alert me of new notes |
CANSLIM.net Company Profile |
SEC |
Zacks Reports |
StockTalk |
News |
Chart |
Request a new note
C
A N
S L
I M
|
ORCL
-
NASDAQ
Oracle Corp
COMPUTER SOFTWARE and SERVICES - Application Software
|
$27.65
|
+0.61
2.24% |
$27.70
|
34,765,114
98.84% of 50 DAV
50 DAV is 35,174,800
|
$29.82
-7.28%
|
9/20/2010
|
$27.32
|
PP = $26.73
|
|
MB = $28.07
|
Most Recent Note - 12/1/2010 5:57:22 PM
G- Gapped up today but it remains below its 50 DMA line, leaving concerns. Gains above its short-term average are needed for its outlook to improve.
>>> The latest Featured Stock Update with an annotated graph appeared on 11/18/2010. Click here.
View all notes |
Alert me of new notes |
CANSLIM.net Company Profile |
SEC |
Zacks Reports |
StockTalk |
News |
Chart |
Request a new note
C
A N
S L
I M
|
PAY
-
NYSE
Verifone Systems Inc
COMPUTER HARDWARE - Transaction Automation Systems
|
$35.90
|
+1.15
3.31% |
$35.93
|
2,142,589
161.61% of 50 DAV
50 DAV is 1,325,800
|
$35.94
-0.11%
|
11/29/2010
|
$33.96
|
PP = $36.04
|
|
MB = $37.84
|
Most Recent Note - 12/1/2010 5:59:35 PM
Y - Matched its 52-week high today with a solid gain after gapping up backed by +61% above average volume. Color code was changed to yellow with new pivot point cited based on its 52-week high plus ten cents. A subsequent breakout could trigger a new (or add-on) technical buy signal, meanwhile patience and discipline are paramount. As previously noted, it has formed an advanced "ascending base" pattern after an impressive rally from its 7/26/10 breakout.
>>> The latest Featured Stock Update with an annotated graph appeared on 10/25/2010. Click here.
View all notes |
Alert me of new notes |
CANSLIM.net Company Profile |
SEC |
Zacks Reports |
StockTalk |
News |
Chart |
Request a new note
C
A N
S L
I M
|
RAX
-
NYSE
Rackspace Hosting Inc
INTERNET - Internet Software and; Services
|
$30.00
|
+0.83
2.85% |
$30.49
|
2,387,861
90.37% of 50 DAV
50 DAV is 2,642,200
|
$29.46
1.83%
|
9/21/2010
|
$22.84
|
PP = $23.61
|
|
MB = $24.79
|
Most Recent Note - 12/1/2010 6:00:31 PM
G - Hit another new all-time high today. Volume totals have been below average in recent weeks. No resistance remains due to overhead supply, but it is extended from any sound base.
>>> The latest Featured Stock Update with an annotated graph appeared on 11/17/2010. Click here.
View all notes |
Alert me of new notes |
CANSLIM.net Company Profile |
SEC |
Zacks Reports |
StockTalk |
News |
Chart |
Request a new note
C
A N
S L
I M
|
ROVI
-
NASDAQ
Rovi Corp
COMPUTER SOFTWARE andamp; SERVICES - Security Software andamp; Services
|
$54.95
|
-0.22
-0.40% |
$56.10
|
1,300,362
88.47% of 50 DAV
50 DAV is 1,469,800
|
$55.58
-1.13%
|
10/29/2010
|
$49.99
|
PP = $53.10
|
|
MB = $55.76
|
Most Recent Note - 12/1/2010 6:03:17 PM
Y - Reversed for a small loss on average volume after a small gap up helped it touch another new 52-week high today. It has recently wedged higher without great volume conviction. Confirming gains on heavy volume could trigger new (or add-on) technical buy signals. Meanwhile, its 50 DMA line defines important support to watch.
>>> The latest Featured Stock Update with an annotated graph appeared on 10/20/2010. Click here.
View all notes |
Alert me of new notes |
CANSLIM.net Company Profile |
SEC |
Zacks Reports |
StockTalk |
News |
Chart |
Request a new note
C
A N
S L
I M
|
Symbol/Exchange
Company Name
Industry Group |
PRICE |
CHANGE
(%Change) |
Day High |
Volume
(% DAV)
(% 50 day avg vol) |
52 Wk Hi
% From Hi |
Featured
Date |
Price
Featured |
Pivot Featured |
|
Max Buy |
SHOO
-
NASDAQ
Steven Madden Limited
CONSUMER NON-DURABLES - Textile - Apparel Footwear
|
$46.33
|
+1.08
2.39% |
$46.76
|
369,344
105.26% of 50 DAV
50 DAV is 350,900
|
$46.75
-0.90%
|
11/23/2010
|
$44.61
|
PP = $44.95
|
|
MB = $47.20
|
Most Recent Note - 12/1/2010 6:04:42 PM
Y - Touched another new 2010 high today with a gain on near average volume. Its 11/29/10 gain above the new pivot point cited with twice average volume met the guidelines for a new (or add-on) technical buy signal. No resistance remains due to overhead supply
>>> The latest Featured Stock Update with an annotated graph appeared on 11/23/2010. Click here.
View all notes |
Alert me of new notes |
CANSLIM.net Company Profile |
SEC |
Zacks Reports |
StockTalk |
News |
Chart |
Request a new note
C
A N
S L
I M
|
SLW
-
NYSE
Silver Wheaton Corp
METALS and; MINING - Silver
|
$37.90
|
+1.01
2.74% |
$38.20
|
10,097,250
106.48% of 50 DAV
50 DAV is 9,482,700
|
$37.26
1.72%
|
8/25/2010
|
$21.40
|
PP = $21.99
|
|
MB = $23.09
|
Most Recent Note - 12/1/2010 6:05:24 PM
G - Up today for 3rd consecutive gain and another new all-time high. It is extended from any sound base, and the recent low ($30.52 on 11/16/10) defines initial support above its 50 DMA line.
>>> The latest Featured Stock Update with an annotated graph appeared on 10/18/2010. Click here.
View all notes |
Alert me of new notes |
CANSLIM.net Company Profile |
SEC |
Zacks Reports |
StockTalk |
News |
Chart |
Request a new note
C
A N
S L
I M
|
UA
-
NYSE
Under Armour Inc Cl A
CONSUMER NON-DURABLES - Textile - Apparel Clothing
|
$57.90
|
+0.17
0.29% |
$59.08
|
651,125
90.67% of 50 DAV
50 DAV is 718,100
|
$58.69
-1.35%
|
9/9/2010
|
$39.99
|
PP = $40.10
|
|
MB = $42.11
|
Most Recent Note - 12/1/2010 6:06:04 PM
G - Hit yet another new 52-week high today, but closed near the session low. The high-ranked Apparel - Clothing firm is very extended from any sound base and well above support at its 50 DMA line.
>>> The latest Featured Stock Update with an annotated graph appeared on 11/4/2010. Click here.
View all notes |
Alert me of new notes |
CANSLIM.net Company Profile |
SEC |
Zacks Reports |
StockTalk |
News |
Chart |
Request a new note
C
A N
S L
I M
|
ULTA
-
NASDAQ
Ulta Salon Cosm & Frag
SPECIALTY RETAIL - Specialty Retail, Other
|
$36.47
|
+1.52
4.35% |
$36.71
|
857,002
190.19% of 50 DAV
50 DAV is 450,600
|
$35.96
1.42%
|
9/3/2010
|
$26.36
|
PP = $25.89
|
|
MB = $27.18
|
Most Recent Note - 12/1/2010 6:06:43 PM
G - Today's gain with heavier volume helped it hit another new all-time high. It is extended from any recent base, meanwhile, its 50 DMA line defines initial support to watch.
>>> The latest Featured Stock Update with an annotated graph appeared on 11/1/2010. Click here.
View all notes |
Alert me of new notes |
CANSLIM.net Company Profile |
SEC |
Zacks Reports |
StockTalk |
News |
Chart |
Request a new note
C
A N
S L
I M
|
VIT
-
NYSE
Vanceinfo Tech Inc Ads
COMPUTER SOFTWARE and SERVICES - Business Software and Services
|
$39.22
|
+1.61
4.28% |
$39.09
|
657,879
101.73% of 50 DAV
50 DAV is 646,700
|
$38.43
2.06%
|
7/8/2010
|
$25.20
|
PP = $26.58
|
|
MB = $27.91
|
Most Recent Note - 12/1/2010 6:08:11 PM
G - Gap up gain on near average volume for a new all-time high. Completed a Public Offering on 11/23/10. It 50 DMA line has acted as support recently, but it has not formed a sound base.
>>> The latest Featured Stock Update with an annotated graph appeared on 10/21/2010. Click here.
View all notes |
Alert me of new notes |
CANSLIM.net Company Profile |
SEC |
Zacks Reports |
StockTalk |
News |
Chart |
Request a new note
C
A N
S L
I M
|
Symbol/Exchange
Company Name
Industry Group |
PRICE |
CHANGE
(%Change) |
Day High |
Volume
(% DAV)
(% 50 day avg vol) |
52 Wk Hi
% From Hi |
Featured
Date |
Price
Featured |
Pivot Featured |
|
Max Buy |