You are not logged in.
This means you
CAN ONLY VIEW reports that were published prior to Monday, April 14, 2025.
You
MUST UPGRADE YOUR MEMBERSHIP if you want to see any current reports.
AFTER MARKET UPDATE - FRIDAY, NOVEMBER 30TH, 2012
Previous After Market Report Next After Market Report >>>
|
|
|
|
DOW |
+3.76 |
13,025.58 |
+0.03% |
|
Volume |
1,179,716,280 |
+73% |
|
Volume |
1,978,900,830 |
+16% |
|
NASDAQ |
-1.79 |
3,010.24 |
-0.06% |
|
Advancers |
1,658 |
53% |
|
Advancers |
1,219 |
47% |
|
S&P 500 |
+0.23 |
1,416.18 |
+0.02% |
|
Decliners |
1,359 |
43% |
|
Decliners |
1,230 |
48% |
|
Russell 2000 |
-1.28 |
821.92 |
-0.16% |
|
52 Wk Highs |
127 |
|
|
52 Wk Highs |
49 |
|
|
S&P 600 |
-1.34 |
462.15 |
-0.29% |
|
52 Wk Lows |
9 |
|
|
52 Wk Lows |
25 |
|
|
 |
Major Averages Ended November Mixed Led By Nasdaq Composite Index
Kenneth J. Gruneisen - Passed the CAN SLIM® Master's Exam
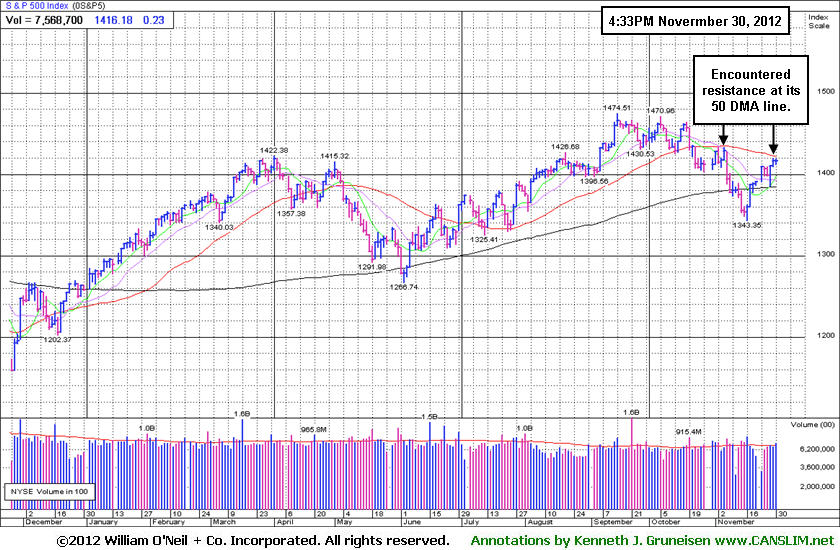
For the month of November, the Dow fell -0.5%, the S&P 500 rose +0.3% and the Nasdaq Composite gained +1.1%. Volume totals on Friday were reported higher than the prior session total on the Nasdaq exchange and on the NYSE. Advancers narrowly led decliners on the NYSE while they were more evenly mixed on the Nasdaq exchange. The total number of stocks hitting new 52-week highs solidly outnumbered new 52-week lows on both the NYSE and the Nasdaq exchange. There were 41 high-ranked companies from the CANSLIM.net Leaders List making new 52-week highs and appearing on the CANSLIM.net BreakOuts Page, down from the prior session total of 66 stocks. Any sustainable rally requires a healthy crop of companies hitting new 52-week highs, so it is encouraging to see meaningful leadership present. There were gains for 5 of the 10 high-ranked companies currently included on the Featured Stocks Page.
Weak updates on the consumer kept investors cautious. Spending unexpectedly declined to the lowest level since May and incomes stagnated in October. The euro zone was also in focus after German lawmakers approved the latest bailout for Greece which is intended to cut the country's debt load.
The major averages ended a choppy trading session essentially unchanged amid continued uncertainty surrounding fiscal cliff discussions. Today’s economic data failed to lift the market. Consumer spending fell 0.2% in October. On the manufacturing front, activity in the Midwest region expanded for the first time since August with the Chicago PMI gaining to 50.4 in November.
YUM! Brands Inc (YUM -9.92%) was a notable decliner as the owner of Taco Bell tumbled $7.39 to $67.08 after lowering its earnings growth forecast. Utilities were the best performing sector with Duke Energy Corp (DUK +2.29%) on the rise.
The 10-year note was unchanged to yield 1.61%.
The market direction (M criteria) has shifted to a "confirmed uptrend" following Friday's gain of +1.4% by the Nasdaq Composite Index. The gain was recognized as a "follow-through day" on Day 5 of the rally attempt while writers for the newspaper stated that it was sufficient that the abbreviated session's volume was running at a higher pace. New buying efforts may now be justified in worthy high-ranked leaders as a result of last week's constructive gains coupled with healthy leadership and a respectable number of stocks hitting new 52-week highs. See the noteworthy companies included on the Featured Stocks Page.
Watch for an announcement via email concerning the next WEBCAST. The webcast will also be available via an updated link highlighted at the top of the Premium Member Homepage.
PICTURED: The S&P 500 Index has encountered resistance at its 50-day moving average (DMA) line. Clearing that important short-term average would be an encouraging improvement in the benchmark index's technical stance
|
 Kenneth J. Gruneisen started out as a licensed stockbroker in August 1987, a couple of months prior to the historic stock market crash that took the Dow Jones Industrial Average down -22.6% in a single day. He has published daily fact-based fundamental and technical analysis on high-ranked stocks online for two decades. Through FACTBASEDINVESTING.COM, Kenneth provides educational articles, news, market commentary, and other information regarding proven investment systems that work in good times and bad.
Comments contained in the body of this report are technical opinions only and are not necessarily those of Gruneisen Growth Corp. The material herein has been obtained from sources believed to be reliable and accurate, however, its accuracy and completeness cannot be guaranteed. Our firm, employees, and customers may effect transactions, including transactions contrary to any recommendation herein, or have positions in the securities mentioned herein or options with respect thereto. Any recommendation contained in this report may not be suitable for all investors and it is not to be deemed an offer or solicitation on our part with respect to the purchase or sale of any securities. |
|
 |
Retail, Healthcare, and Oil Services Indexes Edged Higher
Kenneth J. Gruneisen - Passed the CAN SLIM® Master's Exam
The Retail Index ($RLX +0.53%) helped the major averages along with modest gains from the Oil Services Index ($OSX +0.34%) and the Healthcare Index ($HMO +0.37%). The Gold & Silver Index ($XAU -0.96%) and Biotechnology Index ($BTK -0.49%) had a slightly negative bias. Financial shares were mixed and little changed as the Bank Index ($BKX -0.21%) edged lower and the Broker/Dealer Index ($XBD +0.31%) edged higher. The Internet Index ($IIX -0.23%), Semiconductor Index ($SOX -0.13%), and the Networking Index ($NWX +0.17%) also showed little direction
Charts courtesy www.stockcharts.com

PICTURED: The Integrated Oil Index ($XOI -0.15%) is below its downward sloping 50-day and 200-day moving average (DMA) lines. Gains above the recent high would end the worrisome streak of lower highs and lower lows.
| Oil Services |
$OSX |
218.50 |
+0.75 |
+0.34% |
+1.03% |
| Healthcare |
$HMO |
2,481.28 |
+9.23 |
+0.37% |
+8.75% |
| Integrated Oil |
$XOI |
1,216.57 |
-1.82 |
-0.15% |
-1.02% |
| Semiconductor |
$SOX |
374.35 |
-0.48 |
-0.13% |
+2.72% |
| Networking |
$NWX |
211.53 |
+0.36 |
+0.17% |
-1.69% |
| Internet |
$IIX |
321.27 |
-0.75 |
-0.23% |
+14.03% |
| Broker/Dealer |
$XBD |
87.42 |
+0.27 |
+0.31% |
+4.99% |
| Retail |
$RLX |
675.98 |
+3.54 |
+0.53% |
+29.20% |
| Gold & Silver |
$XAU |
170.20 |
-1.65 |
-0.96% |
-5.78% |
| Bank |
$BKX |
48.56 |
-0.10 |
-0.21% |
+23.31% |
| Biotech |
$BTK |
1,538.93 |
-7.59 |
-0.49% |
+41.00% |
|
|
|
 |
Holding Ground new 52-Week High After Negative Reversal
Kenneth J. Gruneisen - Passed the CAN SLIM® Master's Exam
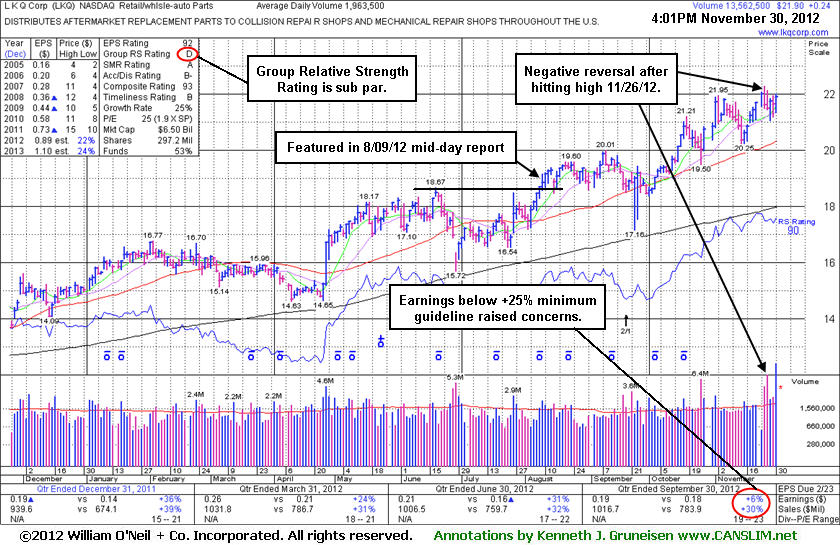
L K Q Corp (LKQ +$0.24 or +1.1% to $21.90) is still holding its ground near its 52-week high today following a worrisome "negative reversal" and finish near the session low on 11/26/12 followed by additional losses on above average volume. It has shown resilience and stayed well above its 50-day moving average (DMA) line since its last appearance in this FSU section on 11/14/12 with an annotated graph under the headline, "Consolidating Following Sub Par Earnings Report". No resistance remains due to overhead supply and it could tally more meaningful gains. Disciplined investors may sooner look for a more ideal buy candidate without any fundamental flaws now that the market (M criteria) has resumed its rally.
Earnings were reported +6% on +30% sales revenues for the Sep '12 quarter (see red circle) and noted as below the +25% minimum earnings guideline (C criteria) while recently raising fundamental concerns. Another lingering concern is the group's below average Group Relative Strength Rating (D) while other leaders in the group have struggled in recent months. Ownership by top-rated funds rose from 456 in Sep '11 to 578 in Sep '12, a reassuring sign concerning the I criteria. The company has maintained a strong annual earnings (A criteria) growth history. It changed its ticker symbol (from LKQX) and found support above its 200 DMA line in recent months. It had survived but failed to impress since dropped from the Featured Stocks list on 4/09/08.
 |
|
|
Color Codes Explained :
Y - Better candidates highlighted by our
staff of experts.
G - Previously featured
in past reports as yellow but may no longer be buyable under the
guidelines.
***Last / Change / Volume data in this table is the closing quote data***
Symbol/Exchange
Company Name
Industry Group |
PRICE |
CHANGE
(%Change) |
Day High |
Volume
(% DAV)
(% 50 day avg vol) |
52 Wk Hi
% From Hi |
Featured
Date |
Price
Featured |
Pivot Featured |
|
Max Buy |
CFNL
-
NASDAQ
Cardinal Financial Corp
BANKING - Regional - Southeast Banks
|
$15.00
|
+0.00
0.00% |
$15.05
|
320,687
182.11% of 50 DAV
50 DAV is 176,100
|
$16.21
-7.46%
|
8/17/2012
|
$12.84
|
PP = $13.31
|
|
MB = $13.98
|
Most Recent Note - 11/28/2012 12:39:30 PM
G - Enduring more distributional pressure this week, consolidating near prior highs and its 50 DMA line defining near-term chart support where violations may trigger technical sell signals.
>>> The latest Featured Stock Update with an annotated graph appeared on 11/20/2012. Click here.
View all notes |
Alert me of new notes |
CANSLIM.net Company Profile |
SEC |
Zacks Reports |
StockTalk |
News |
Chart |
Request a new note
C
A N
S L
I M


|
CMCSA
-
NASDAQ
Comcast Corp Cl A
MEDIA - CATV Systems
|
$37.20
|
+0.34
0.91% |
$37.27
|
11,697,717
93.86% of 50 DAV
50 DAV is 12,462,600
|
$37.96
-2.02%
|
6/11/2012
|
$29.94
|
PP = $30.98
|
|
MB = $32.53
|
Most Recent Note - 11/26/2012 5:51:11 PM
G - Consolidating above its 50 DMA line, however its latest consolidation is too brief to be considered a sound new base pattern.
>>> The latest Featured Stock Update with an annotated graph appeared on 11/19/2012. Click here.
View all notes |
Alert me of new notes |
CANSLIM.net Company Profile |
SEC |
Zacks Reports |
StockTalk |
News |
Chart |
Request a new note
C
A N
S L
I M
|
GPX
-
NYSE
G P Strategies Corp
DIVERSIFIED SERVICES - Education and Training Services
|
$20.05
|
-0.38
-1.86% |
$20.48
|
69,110
117.53% of 50 DAV
50 DAV is 58,800
|
$21.44
-6.48%
|
10/8/2012
|
$20.00
|
PP = $20.77
|
|
MB = $21.81
|
Most Recent Note - 11/27/2012 11:18:41 AM
G - Still holding its ground stubbornly with volume totals cooling while hovering near its 52-week high. Earnings +0% on +12% sales revenues for the Sep '12 quarter, below the +25% minimum earnings guideline (C criteria) raised fundamental concerns. Deterioration leading to a close below its old high close ($20.27 on 8/17/12) would negate the recent technical breakout, and a violation of its 50 DMA line would be a more worrisome sell signal.
>>> The latest Featured Stock Update with an annotated graph appeared on 11/15/2012. Click here.
View all notes |
Alert me of new notes |
CANSLIM.net Company Profile |
SEC |
Zacks Reports |
StockTalk |
News |
Chart |
Request a new note
C
A N
S L
I M
|
LKQ
-
NASDAQ
L K Q Corp
WHOLESALE - Auto Parts
|
$21.90
|
+0.24
1.11% |
$22.00
|
14,117,195
718.98% of 50 DAV
50 DAV is 1,963,500
|
$22.29
-1.73%
|
8/9/2012
|
$18.97
|
PP = $18.72
|
|
MB = $19.66
|
 Most Recent Note - 11/30/2012 4:43:41 PM
G - Holding its ground near its 52-week high today following a worrisome "negative reversal" and finish near the session low on 11/26/12 followed by additional losses on above average volume. Results below the +25% minimum earnings guideline (C criteria) for Sep '12 recently raised fundamental concerns. See the latest FSU analysis for more details and a new annotated graph.
>>> The latest Featured Stock Update with an annotated graph appeared on 11/30/2012. Click here.
View all notes |
Alert me of new notes |
CANSLIM.net Company Profile |
SEC |
Zacks Reports |
StockTalk |
News |
Chart |
Request a new note
C
A N
S L
I M
|
MIDD
-
NASDAQ
Middleby Corp
MANUFACTURING - Diversified Machinery
|
$127.39
|
-0.96
-0.75% |
$128.43
|
90,536
127.52% of 50 DAV
50 DAV is 71,000
|
$128.96
-1.22%
|
10/8/2012
|
$118.46
|
PP = $122.67
|
|
MB = $128.80
|
Most Recent Note - 11/26/2012 5:55:09 PM
Y - Consolidating in a tight trading range near its all-time high. Recently reported earnings +23% on +18% sales for the Sep '12 quarter, below the +25% minimum earnings guideline (C criteria), raising fundamental concerns.
>>> The latest Featured Stock Update with an annotated graph appeared on 11/16/2012. Click here.
View all notes |
Alert me of new notes |
CANSLIM.net Company Profile |
SEC |
Zacks Reports |
StockTalk |
News |
Chart |
Request a new note
C
A N
S L
I M
|
Symbol/Exchange
Company Name
Industry Group |
PRICE |
CHANGE
(%Change) |
Day High |
Volume
(% DAV)
(% 50 day avg vol) |
52 Wk Hi
% From Hi |
Featured
Date |
Price
Featured |
Pivot Featured |
|
Max Buy |
RAX
-
NYSE
Rackspace Hosting Inc
INTERNET - Internet Software and; Services
|
$69.12
|
+0.08
0.12% |
$69.22
|
1,063,234
64.83% of 50 DAV
50 DAV is 1,640,100
|
$70.00
-1.26%
|
11/26/2012
|
$66.26
|
PP = $67.18
|
|
MB = $70.54
|
Most Recent Note - 11/28/2012 5:14:49 PM
Y - Today's gain above its pivot point with +34% above average volume was below the bare minimum guideline for volume necessary to trigger a proper technical buy signal. Confirming gains with volume would be a welcome reassurance, and disciplined investors may be wise to use a tactic called "pyramiding" to allow the market action to dictate their weighting in new buys while always limiting losses by selling if any stock ever falls more than -7% from their purchase price. See latest FSU analysis for more details and a new annotated graph.
>>> The latest Featured Stock Update with an annotated graph appeared on 11/27/2012. Click here.
View all notes |
Alert me of new notes |
CANSLIM.net Company Profile |
SEC |
Zacks Reports |
StockTalk |
News |
Chart |
Request a new note
C
A N
S L
I M
|
RGR
-
NYSE
Sturm Ruger & Co Inc
CONSUMER DURABLES - Sporting Goods
|
$58.59
|
-1.21
-2.02% |
$60.11
|
939,865
205.57% of 50 DAV
50 DAV is 457,200
|
$60.02
-2.38%
|
11/20/2012
|
$52.23
|
PP = $52.65
|
|
MB = $55.28
|
Most Recent Note - 11/30/2012 12:29:20 PM
G - Perched at its 52-week high today following 8 consecutive volume-driven gains. It is extended from its previously noted base and may form a high handle on its larger 7-month cup shaped base, however the minimum length for a proper handle is 1 week for it to be recognized as a valid cup-with-handle base. Prior highs near $52 define initial chart support to watch where violations may trigger technical sell signals.
>>> The latest Featured Stock Update with an annotated graph appeared on 11/21/2012. Click here.
View all notes |
Alert me of new notes |
CANSLIM.net Company Profile |
SEC |
Zacks Reports |
StockTalk |
News |
Chart |
Request a new note
C
A N
S L
I M
|
RNF
-
NYSE
Rentech Nitrogen Ptnr Lp
CHEMICALS - Agricultural Chemicals
|
$39.91
|
+0.31
0.78% |
$40.08
|
191,147
49.00% of 50 DAV
50 DAV is 390,100
|
$41.15
-3.01%
|
11/1/2012
|
$39.11
|
PP = $40.15
|
|
MB = $42.16
|
Most Recent Note - 11/28/2012 5:21:02 PM
Y - It has tallied 4 consecutive gains with below average volume, recently indicating lackluster buying demand from the institutional crowd. Disciplined investors may watch for volume-driven gains for a new high close to trigger a technical buy signal.
>>> The latest Featured Stock Update with an annotated graph appeared on 11/26/2012. Click here.
View all notes |
Alert me of new notes |
CANSLIM.net Company Profile |
SEC |
Zacks Reports |
StockTalk |
News |
Chart |
Request a new note
C
A N
S L
I M
|
VSI
-
NYSE
Vitamin Shoppe Inc
SPECIALTY RETAIL - Specialty Retail, Other
|
$59.26
|
-0.57
-0.95% |
$59.80
|
205,956
83.62% of 50 DAV
50 DAV is 246,300
|
$61.89
-4.25%
|
10/15/2012
|
$57.82
|
PP = $60.08
|
|
MB = $63.08
|
Most Recent Note - 11/29/2012 1:07:13 PM
Y -Perched within close striking distance of its 52-week high with volume totals cooling in recent weeks. The $61 area has been a stubborn resistance level in recent months. It released better than expected earnings +35% on +14% sales revenues for the Sep '12 quarter.
>>> The latest Featured Stock Update with an annotated graph appeared on 11/12/2012. Click here.
View all notes |
Alert me of new notes |
CANSLIM.net Company Profile |
SEC |
Zacks Reports |
StockTalk |
News |
Chart |
Request a new note
C
A N
S L
I M
|
WPI
-
NYSE
Watson Pharmaceuticals
DRUGS - Drugs - Generic
|
$88.01
|
+0.24
0.27% |
$88.24
|
964,655
123.61% of 50 DAV
50 DAV is 780,400
|
$90.00
-2.21%
|
8/24/2012
|
$82.90
|
PP = $81.10
|
|
MB = $85.16
|
Most Recent Note - 11/29/2012 1:05:50 PM
G - Consolidating above its 50 DMA line with little resistance remaining due to overhead supply. Quarterly comparisons for sales revenues and earnings increases have shown sequential deceleration in its growth rate raising some fundamental concerns, as recently noted.
>>> The latest Featured Stock Update with an annotated graph appeared on 11/23/2012. Click here.
View all notes |
Alert me of new notes |
CANSLIM.net Company Profile |
SEC |
Zacks Reports |
StockTalk |
News |
Chart |
Request a new note
C
A N
S L
I M
|
Symbol/Exchange
Company Name
Industry Group |
PRICE |
CHANGE
(%Change) |
Day High |
Volume
(% DAV)
(% 50 day avg vol) |
52 Wk Hi
% From Hi |
Featured
Date |
Price
Featured |
Pivot Featured |
|
Max Buy |
|
|
|
THESE ARE NOT BUY RECOMMENDATIONS!
Comments contained in the body of this report are technical
opinions only. The material herein has been obtained
from sources believed to be reliable and accurate, however,
its accuracy and completeness cannot be guaranteed.
This site is not an investment advisor, hence it does
not endorse or recommend any securities or other investments.
Any recommendation contained in this report may not
be suitable for all investors and it is not to be deemed
an offer or solicitation on our part with respect to
the purchase or sale of any securities. All trademarks,
service marks and trade names appearing in this report
are the property of their respective owners, and are
likewise used for identification purposes only.
This report is a service available
only to active Paid Premium Members.
You may opt-out of receiving report notifications
at any time. Questions or comments may be submitted
by writing to Premium Membership Services 665 S.E. 10 Street, Suite 201 Deerfield Beach, FL 33441-5634 or by calling 1-800-965-8307
or 954-785-1121.
|
|
|

