You are not logged in.
This means you
CAN ONLY VIEW reports that were published prior to Friday, April 11, 2025.
You
MUST UPGRADE YOUR MEMBERSHIP if you want to see any current reports.
AFTER MARKET UPDATE - THURSDAY, NOVEMBER 29TH, 2012
Previous After Market Report Next After Market Report >>>
|
|
|
|
DOW |
+36.71 |
13,021.82 |
+0.28% |
|
Volume |
682,467,180 |
-4% |
|
Volume |
1,703,058,760 |
+3% |
|
NASDAQ |
+20.25 |
3,012.03 |
+0.68% |
|
Advancers |
2,173 |
69% |
|
Advancers |
1,790 |
70% |
|
S&P 500 |
+6.02 |
1,415.95 |
+0.43% |
|
Decliners |
846 |
27% |
|
Decliners |
676 |
26% |
|
Russell 2000 |
+9.70 |
823.20 |
+1.19% |
|
52 Wk Highs |
162 |
|
|
52 Wk Highs |
71 |
|
|
S&P 600 |
+4.97 |
463.49 |
+1.08% |
|
52 Wk Lows |
6 |
|
|
52 Wk Lows |
24 |
|
|
 |
Leadership Expanded Encouragingly as Major Averages Rose
Kenneth J. Gruneisen - Passed the CAN SLIM® Master's Exam
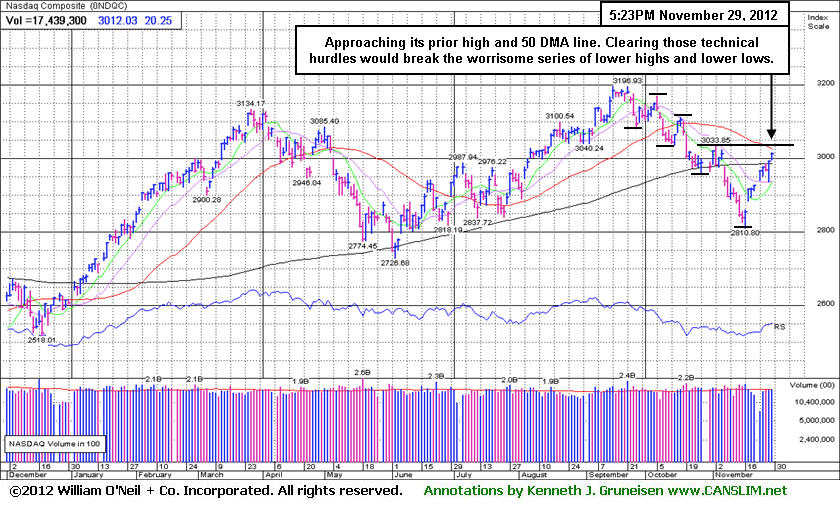
The major averages rose for a second day as positive economic data offset uncertainty surrounding the looming fiscal cliff. Thursday's volume totals were reported mixed, higher than the prior session total on the Nasdaq exchange but slightly lower on the NYSE. Advancers led decliners almost a 3-1 margin on the NYSE and on the Nasdaq exchange. The total number of stocks hitting new 52-week highs solidly outnumbered new 52-week lows on both the NYSE and the Nasdaq exchange. There were 66 high-ranked companies from the CANSLIM.net Leaders List making new 52-week highs and appearing on the CANSLIM.net BreakOuts Page, doubling the prior session total of 33 stocks. Any sustainable rally requires a healthy crop of companies hitting new 52-week highs, so it was a very encouraging sign that leadership expanded. There were gains for 6 of the 10 high-ranked companies currently included on the Featured Stocks Page.
Before the open, third-quarter GDP was revised to 2.7% from the initial 2.0% reading. On the jobs front, weekly initial jobless claims declined 23,000 to 393,000. Pending home sales unexpectedly increased 5.2% in October. The market pared gains after House Speaker John Boehner said no meaningful progress has been made in budget negotiations.
Health care and telecom were the best performing sectors. Express Scripts Holding Co (ESRX +2.09%) and AT&T Inc (T +0.92%) posted small . Material stocks also outperformed. Freeport McMoRan Copper and Gold Inc (FCX +1.82%) as metal prices advanced. Dow component The Walt Disney Co (DIS +1.06%) rose after raising its annual dividend. Shares of high-end retailer Tiffany & Co (TIF -6.17%) retreated after reporting disappointing quarterly results that fell short of analyst projections. Department store Kohl's Corp (KSS -11.98%) dropped after posting weaker-than expected November sales.
The 10-year note was up 1/16 to yield 1.62%.
The market direction (M criteria) has shifted to a "confirmed uptrend" following Friday's gain of +1.4% by the Nasdaq Composite Index. The gain was recognized as a "follow-through day" on Day 5 of the rally attempt while writers for the newspaper stated that it was sufficient that the abbreviated session's volume was running at a higher pace. New buying efforts may now be justified in worthy high-ranked leaders as a result of last week's constructive gains coupled with healthy leadership and a respectable number of stocks hitting new 52-week highs. See the noteworthy companies included on the Featured Stocks Page.
Watch for an announcement via email concerning the next WEBCAST. The webcast will also be available via an updated link highlighted at the top of the Premium Member Homepage.
PICTURED: The Nasdaq Composite Index posted a solid gain. It is approaching its prior high and 50-day moving average (DMA) line. Clearing those near-term technical resistance hurdles would break the worrisome series of lower highs and lower lows, which would be an encouraging improvement in the market's technical stance.
|
 Kenneth J. Gruneisen started out as a licensed stockbroker in August 1987, a couple of months prior to the historic stock market crash that took the Dow Jones Industrial Average down -22.6% in a single day. He has published daily fact-based fundamental and technical analysis on high-ranked stocks online for two decades. Through FACTBASEDINVESTING.COM, Kenneth provides educational articles, news, market commentary, and other information regarding proven investment systems that work in good times and bad.
Comments contained in the body of this report are technical opinions only and are not necessarily those of Gruneisen Growth Corp. The material herein has been obtained from sources believed to be reliable and accurate, however, its accuracy and completeness cannot be guaranteed. Our firm, employees, and customers may effect transactions, including transactions contrary to any recommendation herein, or have positions in the securities mentioned herein or options with respect thereto. Any recommendation contained in this report may not be suitable for all investors and it is not to be deemed an offer or solicitation on our part with respect to the purchase or sale of any securities. |
|
 |
Tech, Financial, and Commodity-Linked Groups Rose
Kenneth J. Gruneisen - Passed the CAN SLIM® Master's Exam
The Retail Index ($RLX -0.46%) created a negative drag on the major averages while modest gains from financials helped the cause and the Bank Index ($BKX +0.33%) and Broker/Dealer Index ($XBD +0.42%) edged higher. Commodity-linked groups had a slightly positive bias as the Gold & Silver Index ($XAU +0.27%) and the Integrated Oil Index ($XOI +0.22%) inched higher and the Oil Services Index ($OSX +1.00%) posted a decent gain. The tech sector saw solid gains from the Internet Index ($IIX +1.15%), Networking Index ($NWX +1.22%), and the Biotechnology Index ($BTK +1.73%), meanwhile the Semiconductor Index ($SOX +0.27%) lagged with a smaller gain.
Charts courtesy www.stockcharts.com
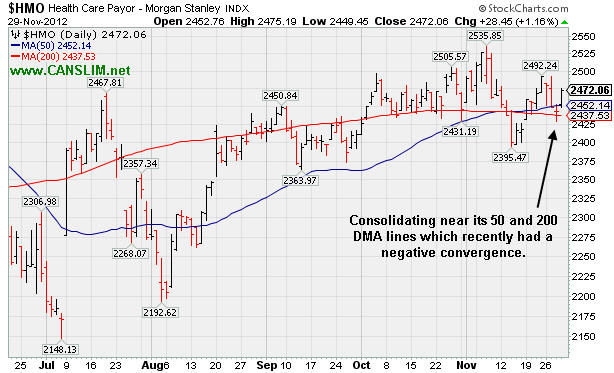
PICTURED: The Healthcare Index ($HMO +1.16%) is currently consolidating near its 50-day and 200-day moving average (DMA) lines which recently had a negative convergence.
| Oil Services |
$OSX |
217.75 |
+2.16 |
+1.00% |
+0.68% |
| Healthcare |
$HMO |
2,472.06 |
+28.45 |
+1.16% |
+8.35% |
| Integrated Oil |
$XOI |
1,218.40 |
+2.66 |
+0.22% |
-0.87% |
| Semiconductor |
$SOX |
374.83 |
+1.00 |
+0.27% |
+2.85% |
| Networking |
$NWX |
211.17 |
+2.54 |
+1.22% |
-1.86% |
| Internet |
$IIX |
322.03 |
+3.66 |
+1.15% |
+14.30% |
| Broker/Dealer |
$XBD |
87.15 |
+0.37 |
+0.42% |
+4.66% |
| Retail |
$RLX |
672.44 |
-3.09 |
-0.46% |
+28.52% |
| Gold & Silver |
$XAU |
171.85 |
+0.46 |
+0.27% |
-4.87% |
| Bank |
$BKX |
48.66 |
+0.16 |
+0.33% |
+23.57% |
| Biotech |
$BTK |
1,546.52 |
+26.32 |
+1.73% |
+41.70% |
|
|
|
 |
Previously Featured Stock Faltering Since Dropped
Kenneth J. Gruneisen - Passed the CAN SLIM® Master's Exam
When the number of stocks included on the Featured Stocks page is low, and those currently listed have all received recent analysis in this FSU section, we occasionally go back to revisit a previously featured stock that was dropped. Today we will have another look at a stock that was dropped from the Featured Stocks list back on July 17, 2012. Bargain hunting is not suggested under the fact-based system, so don't get any ridiculous notions while we review what has recently transpired.
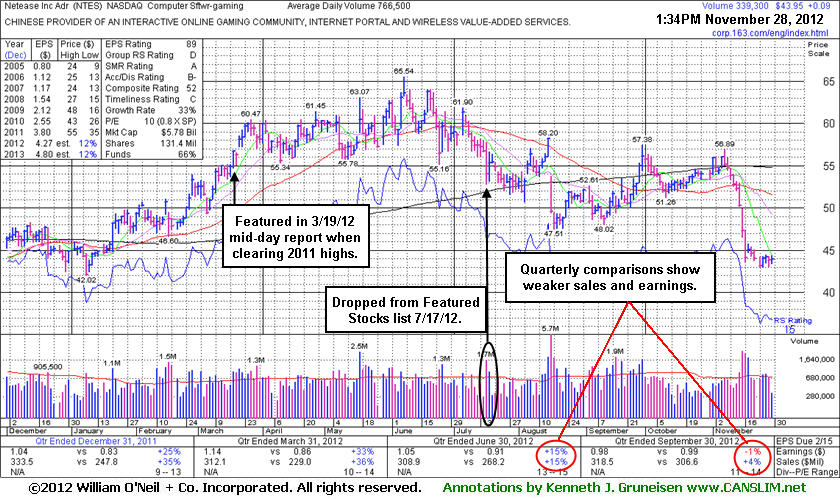
Netease.com Inc (NTES) fell from $54.05 to as low as last week's $42.94 since it was last noted 7/17/2012 6:14:23 PM - "Violated prior lows in the $55 area today and triggered a more worrisome technical sell signal while slumping toward its 200 DMA line. It faces overhead supply that may act as resistance up through the $65 area. Based on weak action it ended -17.5% off its 52-week high and it will be dropped from the Featured Stocks list tonight." That evening's FSU analysis included more details and a new annotated graph under the headline, "Damaging Loss on Higher Volume Triggers Worrisome Sell Signal".
Its Relative Strength Rating was a 81 at that time, near the minimum guideline for buy candidates. It has slumped to 15. Today it faces a far greater amount of overhead supply that may act as resistance up through the $65 area if ever it attempts to rebound. The number of top-rated funds owning its shares fell from 290 in Jun '12 to 276 in Sep '12, not a reassuring trend concerning the I criteria.
In the months after it was featured in yellow at $56.18 in the 3/19/12 mid-day report (read here) the Computer Software - Gaming firm made some upward progress. However, today this serves as yet another example where a company's deteriorating technical action has been accompanied by deteriorating fundamentals. Notice the -1% earnings on +4% sales revenues in the Sep '12 quarter, marking its weakest quarterly results in years.
|
|
|
Color Codes Explained :
Y - Better candidates highlighted by our
staff of experts.
G - Previously featured
in past reports as yellow but may no longer be buyable under the
guidelines.
***Last / Change / Volume data in this table is the closing quote data***
Symbol/Exchange
Company Name
Industry Group |
PRICE |
CHANGE
(%Change) |
Day High |
Volume
(% DAV)
(% 50 day avg vol) |
52 Wk Hi
% From Hi |
Featured
Date |
Price
Featured |
Pivot Featured |
|
Max Buy |
CFNL
-
NASDAQ
Cardinal Financial Corp
BANKING - Regional - Southeast Banks
|
$15.00
|
-0.02
-0.13% |
$15.15
|
207,858
120.08% of 50 DAV
50 DAV is 173,100
|
$16.21
-7.46%
|
8/17/2012
|
$12.84
|
PP = $13.31
|
|
MB = $13.98
|
Most Recent Note - 11/28/2012 12:39:30 PM
G - Enduring more distributional pressure this week, consolidating near prior highs and its 50 DMA line defining near-term chart support where violations may trigger technical sell signals.
>>> The latest Featured Stock Update with an annotated graph appeared on 11/20/2012. Click here.
View all notes |
Alert me of new notes |
CANSLIM.net Company Profile |
SEC |
Zacks Reports |
StockTalk |
News |
Chart |
Request a new note
C
A N
S L
I M


|
CMCSA
-
NASDAQ
Comcast Corp Cl A
MEDIA - CATV Systems
|
$36.86
|
+0.20
0.55% |
$36.90
|
11,437,606
91.91% of 50 DAV
50 DAV is 12,444,400
|
$37.96
-2.90%
|
6/11/2012
|
$29.94
|
PP = $30.98
|
|
MB = $32.53
|
Most Recent Note - 11/26/2012 5:51:11 PM
G - Consolidating above its 50 DMA line, however its latest consolidation is too brief to be considered a sound new base pattern.
>>> The latest Featured Stock Update with an annotated graph appeared on 11/19/2012. Click here.
View all notes |
Alert me of new notes |
CANSLIM.net Company Profile |
SEC |
Zacks Reports |
StockTalk |
News |
Chart |
Request a new note
C
A N
S L
I M
|
GPX
-
NYSE
G P Strategies Corp
DIVERSIFIED SERVICES - Education and Training Services
|
$20.43
|
+0.05
0.25% |
$20.64
|
24,848
41.97% of 50 DAV
50 DAV is 59,200
|
$21.44
-4.71%
|
10/8/2012
|
$20.00
|
PP = $20.77
|
|
MB = $21.81
|
Most Recent Note - 11/27/2012 11:18:41 AM
G - Still holding its ground stubbornly with volume totals cooling while hovering near its 52-week high. Earnings +0% on +12% sales revenues for the Sep '12 quarter, below the +25% minimum earnings guideline (C criteria) raised fundamental concerns. Deterioration leading to a close below its old high close ($20.27 on 8/17/12) would negate the recent technical breakout, and a violation of its 50 DMA line would be a more worrisome sell signal.
>>> The latest Featured Stock Update with an annotated graph appeared on 11/15/2012. Click here.
View all notes |
Alert me of new notes |
CANSLIM.net Company Profile |
SEC |
Zacks Reports |
StockTalk |
News |
Chart |
Request a new note
C
A N
S L
I M
|
LKQ
-
NASDAQ
L K Q Corp
WHOLESALE - Auto Parts
|
$21.66
|
-0.10
-0.46% |
$21.95
|
2,701,288
139.64% of 50 DAV
50 DAV is 1,934,400
|
$22.29
-2.80%
|
8/9/2012
|
$18.97
|
PP = $18.72
|
|
MB = $19.66
|
Most Recent Note - 11/27/2012 12:13:09 PM
G - Holding its ground near its 52-week high today following a worrisome "negative reversal" and finish near the session low with a loss on above average volume. Results below the +25% minimum earnings guideline (C criteria) for Sep '12 recently raised fundamental concerns.
>>> The latest Featured Stock Update with an annotated graph appeared on 11/14/2012. Click here.
View all notes |
Alert me of new notes |
CANSLIM.net Company Profile |
SEC |
Zacks Reports |
StockTalk |
News |
Chart |
Request a new note
C
A N
S L
I M
|
MIDD
-
NASDAQ
Middleby Corp
MANUFACTURING - Diversified Machinery
|
$128.35
|
+1.83
1.45% |
$128.35
|
68,810
97.88% of 50 DAV
50 DAV is 70,300
|
$128.96
-0.48%
|
10/8/2012
|
$118.46
|
PP = $122.67
|
|
MB = $128.80
|
Most Recent Note - 11/26/2012 5:55:09 PM
Y - Consolidating in a tight trading range near its all-time high. Recently reported earnings +23% on +18% sales for the Sep '12 quarter, below the +25% minimum earnings guideline (C criteria), raising fundamental concerns.
>>> The latest Featured Stock Update with an annotated graph appeared on 11/16/2012. Click here.
View all notes |
Alert me of new notes |
CANSLIM.net Company Profile |
SEC |
Zacks Reports |
StockTalk |
News |
Chart |
Request a new note
C
A N
S L
I M
|
Symbol/Exchange
Company Name
Industry Group |
PRICE |
CHANGE
(%Change) |
Day High |
Volume
(% DAV)
(% 50 day avg vol) |
52 Wk Hi
% From Hi |
Featured
Date |
Price
Featured |
Pivot Featured |
|
Max Buy |
RAX
-
NYSE
Rackspace Hosting Inc
INTERNET - Internet Software and; Services
|
$69.04
|
+0.60
0.88% |
$70.00
|
1,601,667
97.41% of 50 DAV
50 DAV is 1,644,300
|
$69.81
-1.10%
|
11/26/2012
|
$66.26
|
PP = $67.18
|
|
MB = $70.54
|
Most Recent Note - 11/28/2012 5:14:49 PM
Y - Today's gain above its pivot point with +34% above average volume was below the bare minimum guideline for volume necessary to trigger a proper technical buy signal. Confirming gains with volume would be a welcome reassurance, and disciplined investors may be wise to use a tactic called "pyramiding" to allow the market action to dictate their weighting in new buys while always limiting losses by selling if any stock ever falls more than -7% from their purchase price. See latest FSU analysis for more details and a new annotated graph.
>>> The latest Featured Stock Update with an annotated graph appeared on 11/27/2012. Click here.
View all notes |
Alert me of new notes |
CANSLIM.net Company Profile |
SEC |
Zacks Reports |
StockTalk |
News |
Chart |
Request a new note
C
A N
S L
I M
|
RGR
-
NYSE
Sturm Ruger & Co Inc
CONSUMER DURABLES - Sporting Goods
|
$59.80
|
+1.35
2.31% |
$60.02
|
639,468
141.63% of 50 DAV
50 DAV is 451,500
|
$59.44
0.61%
|
11/20/2012
|
$52.23
|
PP = $52.65
|
|
MB = $55.28
|
Most Recent Note - 11/28/2012 5:17:09 PM
G - Hit a new 52-week high with today's 7th consecutive volume-driven gain. Color code was changed to green after getting extended from its previously noted base. Prior highs near $52 define initial chart support to watch where violations may trigger technical sell signals.
>>> The latest Featured Stock Update with an annotated graph appeared on 11/21/2012. Click here.
View all notes |
Alert me of new notes |
CANSLIM.net Company Profile |
SEC |
Zacks Reports |
StockTalk |
News |
Chart |
Request a new note
C
A N
S L
I M
|
RNF
-
NYSE
Rentech Nitrogen Ptnr Lp
CHEMICALS - Agricultural Chemicals
|
$39.60
|
-0.02
-0.05% |
$40.21
|
275,582
70.28% of 50 DAV
50 DAV is 392,100
|
$41.15
-3.77%
|
11/1/2012
|
$39.11
|
PP = $40.15
|
|
MB = $42.16
|
Most Recent Note - 11/28/2012 5:21:02 PM
Y - It has tallied 4 consecutive gains with below average volume, recently indicating lackluster buying demand from the institutional crowd. Disciplined investors may watch for volume-driven gains for a new high close to trigger a technical buy signal.
>>> The latest Featured Stock Update with an annotated graph appeared on 11/26/2012. Click here.
View all notes |
Alert me of new notes |
CANSLIM.net Company Profile |
SEC |
Zacks Reports |
StockTalk |
News |
Chart |
Request a new note
C
A N
S L
I M
|
VSI
-
NYSE
Vitamin Shoppe Inc
SPECIALTY RETAIL - Specialty Retail, Other
|
$59.83
|
-0.21
-0.35% |
$60.63
|
108,114
43.61% of 50 DAV
50 DAV is 247,900
|
$61.89
-3.33%
|
10/15/2012
|
$57.82
|
PP = $60.08
|
|
MB = $63.08
|
 Most Recent Note - 11/29/2012 1:07:13 PM
Y -Perched within close striking distance of its 52-week high with volume totals cooling in recent weeks. The $61 area has been a stubborn resistance level in recent months. It released better than expected earnings +35% on +14% sales revenues for the Sep '12 quarter.
>>> The latest Featured Stock Update with an annotated graph appeared on 11/12/2012. Click here.
View all notes |
Alert me of new notes |
CANSLIM.net Company Profile |
SEC |
Zacks Reports |
StockTalk |
News |
Chart |
Request a new note
C
A N
S L
I M
|
WPI
-
NYSE
Watson Pharmaceuticals
DRUGS - Drugs - Generic
|
$87.77
|
+0.66
0.76% |
$87.98
|
603,578
76.94% of 50 DAV
50 DAV is 784,500
|
$90.00
-2.48%
|
8/24/2012
|
$82.90
|
PP = $81.10
|
|
MB = $85.16
|
Most Recent Note - 11/29/2012 1:05:50 PM
G - Consolidating above its 50 DMA line with little resistance remaining due to overhead supply. Quarterly comparisons for sales revenues and earnings increases have shown sequential deceleration in its growth rate raising some fundamental concerns, as recently noted.
>>> The latest Featured Stock Update with an annotated graph appeared on 11/23/2012. Click here.
View all notes |
Alert me of new notes |
CANSLIM.net Company Profile |
SEC |
Zacks Reports |
StockTalk |
News |
Chart |
Request a new note
C
A N
S L
I M
|
Symbol/Exchange
Company Name
Industry Group |
PRICE |
CHANGE
(%Change) |
Day High |
Volume
(% DAV)
(% 50 day avg vol) |
52 Wk Hi
% From Hi |
Featured
Date |
Price
Featured |
Pivot Featured |
|
Max Buy |
|
|
|
THESE ARE NOT BUY RECOMMENDATIONS!
Comments contained in the body of this report are technical
opinions only. The material herein has been obtained
from sources believed to be reliable and accurate, however,
its accuracy and completeness cannot be guaranteed.
This site is not an investment advisor, hence it does
not endorse or recommend any securities or other investments.
Any recommendation contained in this report may not
be suitable for all investors and it is not to be deemed
an offer or solicitation on our part with respect to
the purchase or sale of any securities. All trademarks,
service marks and trade names appearing in this report
are the property of their respective owners, and are
likewise used for identification purposes only.
This report is a service available
only to active Paid Premium Members.
You may opt-out of receiving report notifications
at any time. Questions or comments may be submitted
by writing to Premium Membership Services 665 S.E. 10 Street, Suite 201 Deerfield Beach, FL 33441-5634 or by calling 1-800-965-8307
or 954-785-1121.
|
|
|

