***Last / Change / Volume data in this table is the closing quote data***
Symbol/Exchange
Company Name
Industry Group |
PRICE |
CHANGE
(%Change) |
Day High |
Volume
(% DAV)
(% 50 day avg vol) |
52 Wk Hi
% From Hi |
Featured
Date |
Price
Featured |
Pivot Featured |
|
Max Buy |
ABV
-
NYSE
Comp De Bebidas Adr
FOOD and BEVERAGE - Beverages - Brewers
|
$135.64
|
-2.64
-1.91% |
$140.32
|
1,002,494
153.99% of 50 DAV
50 DAV is 651,000
|
$145.36
-6.69%
|
11/4/2010
|
$142.35
|
PP = $143.63
|
|
MB = $150.81
|
 Most Recent Note - 11/30/2010 3:29:55 PM
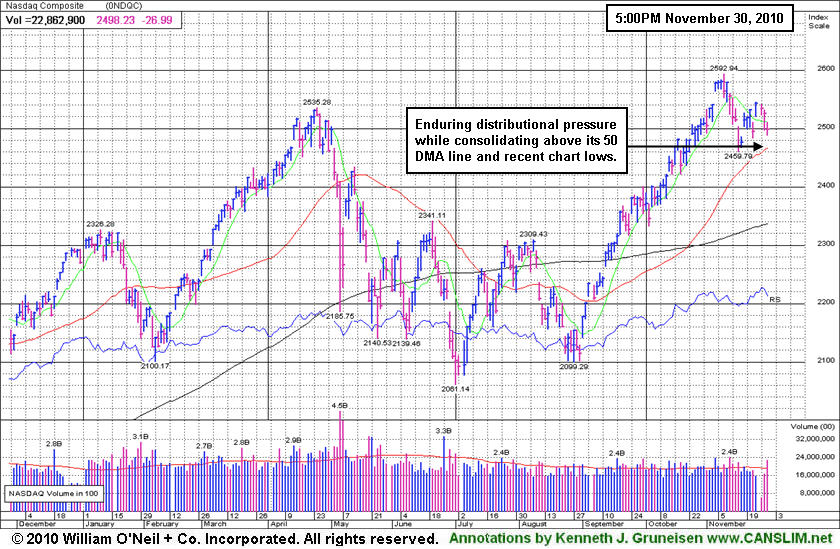
G - Reversed into the red after early gains today, slumping on slightly higher volume near its recent lows and support near its 50 DMA line. Color code is changed to green as it endures distributional pressure after recently stalling.
>>> The latest Featured Stock Update with an annotated graph appeared on 10/11/2010. Click here.
View all notes |
Alert me of new notes |
CANSLIM.net Company Profile |
SEC |
Zacks Reports |
StockTalk |
News |
Chart |
Request a new note
C
A N
S L
I M


|
ARUN
-
NASDAQ
Aruba Networks Inc
COMPUTER HARDWARE - Networking andamp; Communication Dev
|
$21.24
|
-1.81
-7.84% |
$22.30
|
7,496,742
297.68% of 50 DAV
50 DAV is 2,518,400
|
$24.28
-12.51%
|
8/30/2010
|
$18.12
|
PP = $18.51
|
|
MB = $19.44
|
Most Recent Note - 11/30/2010 2:12:18 PM
G - Gapped down today raising concerns with a loss on heavier volume as it traded below its 50 DMA line and near an upward trendline connecting May - November lows previously noted as support to watch.
>>> The latest Featured Stock Update with an annotated graph appeared on 10/26/2010. Click here.
View all notes |
Alert me of new notes |
CANSLIM.net Company Profile |
SEC |
Zacks Reports |
StockTalk |
News |
Chart |
Request a new note
C
A N
S L
I M
|
BIDU
-
NASDAQ
Baidu Inc Ads
INTERNET - Internet Information Providers
|
$105.05
|
-2.33
-2.17% |
$107.20
|
9,352,176
75.65% of 50 DAV
50 DAV is 12,363,000
|
$115.04
-8.68%
|
9/17/2010
|
$85.73
|
PP = $88.42
|
|
MB = $92.84
|
Most Recent Note - 11/30/2010 2:27:36 PM
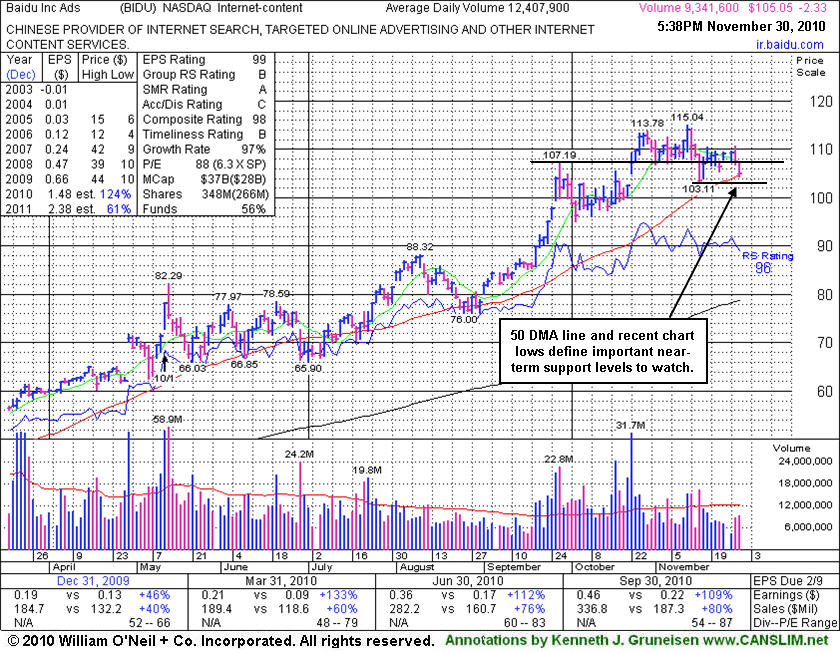
G - Volume totals have been cooling while consolidating near its 50 DMA line. Any damaging violation of its short-term average or recent chart low ($103.11 on 11/16/10) would raise greater concerns and trigger technical sell signals. It could still be among the leaders going on to produce more climactic gains if the broader market (M criteria) resumes its rally, however BIDU has been noted as a riskier "late stage" candidate.
>>> The latest Featured Stock Update with an annotated graph appeared on 11/30/2010. Click here.
View all notes |
Alert me of new notes |
CANSLIM.net Company Profile |
SEC |
Zacks Reports |
StockTalk |
News |
Chart |
Request a new note
C
A N
S L
I M
|
CACC
-
NASDAQ
Credit Acceptance Corp
FINANCIAL SERVICES - Credit Services
|
$62.07
|
-1.00
-1.59% |
$63.05
|
84,952
341.17% of 50 DAV
50 DAV is 24,900
|
$63.45
-2.17%
|
11/22/2010
|
$59.97
|
PP = $62.00
|
|
MB = $65.10
|
Most Recent Note - 11/30/2010 2:22:16 PM
Y - Loss today with light volume has its slumping slightly under its pivot point. The prior gain with +69% above average volume helped it rally above the pivot point of a "double bottom" type base pattern, meeting the guidelines for a new (or add-on) technical buy signal. However, a follow-through day has not confirmed a new rally since recent concerns were raised about the M criteria.
>>> The latest Featured Stock Update with an annotated graph appeared on 10/29/2010. Click here.
View all notes |
Alert me of new notes |
CANSLIM.net Company Profile |
SEC |
Zacks Reports |
StockTalk |
News |
Chart |
Request a new note
C
A N
S L
I M
|
CIS
-
NYSE
Camelot Info Systems Ads
COMPUTER SOFTWARE andamp; SERVICES - Information Technology Service
|
$22.89
|
+1.75
8.28% |
$23.09
|
603,759
232.93% of 50 DAV
50 DAV is 259,200
|
$21.43
6.81%
|
11/26/2010
|
$18.93
|
PP = $19.72
|
|
MB = $20.71
|
Most Recent Note - 11/30/2010 4:41:46 PM
G - This Chinese Computer Software firm hit another new 52-week high today, finishing well above its "max buy" level and its color code is changed to green. Its considerable gain above its pivot point on the prior session with 3 times average volume met the guidelines for a technical buy signal. A remaining concern previously noted is that a follow through day from at least one of the major averages (M criteria) is needed as a critical reassurance before new buying efforts are justified under the investment system guidelines.
>>> The latest Featured Stock Update with an annotated graph appeared on 11/26/2010. Click here.
View all notes |
Alert me of new notes |
CANSLIM.net Company Profile |
SEC |
Zacks Reports |
StockTalk |
News |
Chart |
Request a new note
C
A N
S L
I M
|
Symbol/Exchange
Company Name
Industry Group |
PRICE |
CHANGE
(%Change) |
Day High |
Volume
(% DAV)
(% 50 day avg vol) |
52 Wk Hi
% From Hi |
Featured
Date |
Price
Featured |
Pivot Featured |
|
Max Buy |
CMG
-
NYSE
Chipotle Mexican Grill
LEISURE - Restaurants
|
$258.49
|
+1.48
0.58% |
$262.78
|
2,348,897
275.89% of 50 DAV
50 DAV is 851,400
|
$257.79
0.27%
|
9/1/2010
|
$158.31
|
PP = $155.52
|
|
MB = $163.30
|
Most Recent Note - 11/30/2010 1:06:43 PM
G - Up for a 7th consecutive session today and yet another new all-time high. It is extended from any sound base pattern. Its 50 DMA line (now $204) defines the nearest chart support level.
>>> The latest Featured Stock Update with an annotated graph appeared on 10/28/2010. Click here.
View all notes |
Alert me of new notes |
CANSLIM.net Company Profile |
SEC |
Zacks Reports |
StockTalk |
News |
Chart |
Request a new note
C
A N
S L
I M
|
CTRP
-
NASDAQ
Ctrip.Com Intl Ltd Adr
LEISURE - Resorts and Casinos
|
$43.78
|
-2.63
-5.67% |
$45.53
|
2,729,374
132.67% of 50 DAV
50 DAV is 2,057,200
|
$53.16
-17.65%
|
9/24/2010
|
$46.75
|
PP = $47.11
|
|
MB = $49.47
|
Most Recent Note - 11/30/2010 2:15:40 PM
G - Gapped down today and violated the previously noted low ($45.05 on 11/16/10), raising concerns as technical damage mounts.
>>> The latest Featured Stock Update with an annotated graph appeared on 11/22/2010. Click here.
View all notes |
Alert me of new notes |
CANSLIM.net Company Profile |
SEC |
Zacks Reports |
StockTalk |
News |
Chart |
Request a new note
C
A N
S L
I M
|
DECK
-
NASDAQ
Deckers Outdoor Corp
CONSUMER NON-DURABLES - Textile - Apparel Footwear
|
$76.90
|
+3.87
5.30% |
$77.37
|
4,815,832
386.07% of 50 DAV
50 DAV is 1,247,400
|
$73.87
4.10%
|
10/27/2010
|
$54.16
|
PP = $54.86
|
|
MB = $57.60
|
Most Recent Note - 11/30/2010 1:15:27 PM
G - Gapped up today for a 9th consecutive gain, rallying to new all-time high territory. It has been noted as extended from its latest sound base. Prior highs and its 50 DMA line define the nearest chart support.
>>> The latest Featured Stock Update with an annotated graph appeared on 10/27/2010. Click here.
View all notes |
Alert me of new notes |
CANSLIM.net Company Profile |
SEC |
Zacks Reports |
StockTalk |
News |
Chart |
Request a new note
C
A N
S L
I M
|
EZPW
-
NASDAQ
Ezcorp Inc Cl A
SPECIALTY RETAIL - Specialty Retail, Other
|
$25.16
|
-0.25
-0.98% |
$25.48
|
363,833
122.42% of 50 DAV
50 DAV is 297,200
|
$26.14
-3.75%
|
11/5/2010
|
$24.02
|
PP = $23.85
|
|
MB = $25.04
|
Most Recent Note - 11/29/2010 1:13:33 PM
G - Pulling back today after a solid gain for a new all-time high on Friday's holiday-shortened session. Prior highs in the $22-23 area define chart support to watch above its 50 DMA line.
>>> The latest Featured Stock Update with an annotated graph appeared on 11/6/2010. Click here.
View all notes |
Alert me of new notes |
CANSLIM.net Company Profile |
SEC |
Zacks Reports |
StockTalk |
News |
Chart |
Request a new note
C
A N
S L
I M
|
FFIV
-
NASDAQ
F 5 Networks Inc
INTERNET - Internet Software and Services
|
$131.88
|
-2.30
-1.71% |
$133.00
|
1,965,343
69.37% of 50 DAV
50 DAV is 2,833,200
|
$136.00
-3.03%
|
6/16/2010
|
$74.50
|
PP = $74.10
|
|
MB = $77.81
|
Most Recent Note - 11/26/2010 1:05:35 PM
G - Closed near the session high at a new all-time high. Extended from any sound base pattern. Prior highs in the $112 area define initial chart support.
>>> The latest Featured Stock Update with an annotated graph appeared on 11/15/2010. Click here.
View all notes |
Alert me of new notes |
CANSLIM.net Company Profile |
SEC |
Zacks Reports |
StockTalk |
News |
Chart |
Request a new note
C
A N
S L
I M
|
Symbol/Exchange
Company Name
Industry Group |
PRICE |
CHANGE
(%Change) |
Day High |
Volume
(% DAV)
(% 50 day avg vol) |
52 Wk Hi
% From Hi |
Featured
Date |
Price
Featured |
Pivot Featured |
|
Max Buy |
FOSL
-
NASDAQ
Fossil Inc
CONSUMER DURABLES - Recreational Goods, Other
|
$67.65
|
-0.11
-0.16% |
$68.64
|
1,976,353
247.54% of 50 DAV
50 DAV is 798,400
|
$70.07
-3.45%
|
11/26/2010
|
$69.10
|
PP = $70.17
|
|
MB = $73.68
|
Most Recent Note - 11/30/2010 3:32:05 PM
Y - Trading up today, showing resilience after a small gap down. Color code was changed to yellow after an advanced "3-weeks tight" pattern was identified following a considerable rally from its prior base. Disciplined investors will resist the temptation to get in "early" while watching for a convincing breakout and a follow through day from at least one of the major averages (M criteria) as critical reassurances before new (or add-on) buying efforts are justified under the investment system guidelines. An upward trendline connecting its July-October lows defines support to watch above its 50 DMA line.
>>> The latest Featured Stock Update with an annotated graph appeared on 11/29/2010. Click here.
View all notes |
Alert me of new notes |
CANSLIM.net Company Profile |
SEC |
Zacks Reports |
StockTalk |
News |
Chart |
Request a new note
C
A N
S L
I M
|
HMSY
-
NASDAQ
H M S Holdings Corp
COMPUTER SOFTWARE and SERVICES - Healthcare Information Service
|
$63.01
|
-0.11
-0.17% |
$63.01
|
175,612
82.49% of 50 DAV
50 DAV is 212,900
|
$64.09
-1.69%
|
11/19/2010
|
$61.89
|
PP = $63.01
|
|
MB = $66.16
|
Most Recent Note - 11/29/2010 5:17:28 PM
Y - Volume totals have been light as it traded above its pivot point for a new 52-week high last week and now consolidates near prior highs. Volume did not meet the guideline to trigger a proper new (or add-on) technical buy signal. Its 50 DMA line defines important support to watch.
>>> The latest Featured Stock Update with an annotated graph appeared on 11/19/2010. Click here.
View all notes |
Alert me of new notes |
CANSLIM.net Company Profile |
SEC |
Zacks Reports |
StockTalk |
News |
Chart |
Request a new note
C
A N
S L
I M
|
HS
-
NYSE
Healthspring Inc
HEALTH SERVICES - Health Care Plans
|
$26.83
|
-0.30
-1.11% |
$26.99
|
695,959
101.53% of 50 DAV
50 DAV is 685,500
|
$29.80
-9.97%
|
8/27/2010
|
$19.91
|
PP = $19.75
|
|
MB = $20.74
|
Most Recent Note - 11/29/2010 1:12:23 PM
G - Small gap down today for a loss, trading below its 50 DMA line for the first time since August. More damaging losses would raise concerns and trigger a technical sell signal.
>>> The latest Featured Stock Update with an annotated graph appeared on 10/22/2010. Click here.
View all notes |
Alert me of new notes |
CANSLIM.net Company Profile |
SEC |
Zacks Reports |
StockTalk |
News |
Chart |
Request a new note
C
A N
S L
I M
|
IGTE
-
NASDAQ
Igate Corp
COMPUTER SOFTWARE and SERVICES - Information Technology Service
|
$20.00
|
-4.83
-19.45% |
$24.74
|
7,806,310
1,118.86% of 50 DAV
50 DAV is 697,700
|
$24.99
-19.97%
|
10/26/2010
|
$17.29
|
PP = $19.55
|
|
MB = $20.53
|
Most Recent Note - 11/30/2010 2:08:06 PM
G - After a weak start today it has continued to weaken considerably, raising concerns. It has traded 8 times its daily average volume while quickly slicing back near prior chart highs in the $19 area and sinking below its 50 DMA line, triggering a technical sell signal with its largest point loss on largest volume ever.
>>> The latest Featured Stock Update with an annotated graph appeared on 11/11/2010. Click here.
View all notes |
Alert me of new notes |
CANSLIM.net Company Profile |
SEC |
Zacks Reports |
StockTalk |
News |
Chart |
Request a new note
C
A N
S L
I M
|
JOBS
-
NASDAQ
Fifty One Job Inc Ads
DIVERSIFIED SERVICES - Staffing and; Outsourcing Service
|
$50.74
|
+0.12
0.24% |
$50.98
|
52,532
23.64% of 50 DAV
50 DAV is 222,200
|
$51.84
-2.12%
|
10/13/2010
|
$42.07
|
PP = $40.60
|
|
MB = $42.63
|
Most Recent Note - 11/30/2010 3:19:37 PM
G - Perched in a tight range for the past few days with volume totals very light as it holds its ground at its 52-week high. Its 50 DMA line defines important support to watch.
>>> The latest Featured Stock Update with an annotated graph appeared on 11/16/2010. Click here.
View all notes |
Alert me of new notes |
CANSLIM.net Company Profile |
SEC |
Zacks Reports |
StockTalk |
News |
Chart |
Request a new note
C
A N
S L
I M
|
Symbol/Exchange
Company Name
Industry Group |
PRICE |
CHANGE
(%Change) |
Day High |
Volume
(% DAV)
(% 50 day avg vol) |
52 Wk Hi
% From Hi |
Featured
Date |
Price
Featured |
Pivot Featured |
|
Max Buy |
LFT
-
NYSE
Longtop Financl Tech Ads
COMPUTER SOFTWARE and SERVICES - Business Software and Services
|
$39.56
|
-0.09
-0.23% |
$40.21
|
423,942
77.15% of 50 DAV
50 DAV is 549,500
|
$42.86
-7.70%
|
11/5/2010
|
$41.83
|
PP = $40.96
|
|
MB = $43.01
|
Most Recent Note - 11/29/2010 5:21:18 PM
Y - Perched -7.5% off its all-time high today. Its latest slump below its pivot point raised concerns again, yet volume totals have been cooling while consolidating above support near its 50 DMA line.
>>> The latest Featured Stock Update with an annotated graph appeared on 10/14/2010. Click here.
View all notes |
Alert me of new notes |
CANSLIM.net Company Profile |
SEC |
Zacks Reports |
StockTalk |
News |
Chart |
Request a new note
C
A N
S L
I M
|
LULU
-
NASDAQ
Lululemon Athletica
MANUFACTURING - Textile Manufacturing
|
$53.62
|
+0.04
0.07% |
$54.16
|
736,468
68.72% of 50 DAV
50 DAV is 1,071,700
|
$54.77
-2.10%
|
10/8/2010
|
$47.66
|
PP = $46.67
|
|
MB = $49.00
|
Most Recent Note - 11/30/2010 3:24:22 PM
G - Volume totals are cooling while stubbornly holding its ground near its 52-week high after volume-driven gains. Prior highs in the $46-48 area define chart support to watch along with its 50 DMA line.
>>> The latest Featured Stock Update with an annotated graph appeared on 10/8/2010. Click here.
View all notes |
Alert me of new notes |
CANSLIM.net Company Profile |
SEC |
Zacks Reports |
StockTalk |
News |
Chart |
Request a new note
C
A N
S L
I M
|
MWIV
-
NASDAQ
M W I Veterinary Supply
HEALTH SERVICES - Medical Instruments and; Supplies
|
$61.10
|
+0.03
0.05% |
$61.57
|
72,061
125.32% of 50 DAV
50 DAV is 57,500
|
$63.94
-4.44%
|
11/4/2010
|
$61.79
|
PP = $59.60
|
|
MB = $62.58
|
Most Recent Note - 11/26/2010 1:15:36 PM
Y - Quiet gain on today's holiday-shortened session, finishing 2 cents under its best ever close. Its 50 DMA line has been repeatedly noted as a very important support level. It stalled after hitting its all-time high on 11/04/10, yet held its ground stubbornly above its short-term average.
>>> The latest Featured Stock Update with an annotated graph appeared on 11/2/2010. Click here.
View all notes |
Alert me of new notes |
CANSLIM.net Company Profile |
SEC |
Zacks Reports |
StockTalk |
News |
Chart |
Request a new note
C
A N
S L
I M
|
NEOG
-
NASDAQ
Neogen Corp
DRUGS - Diagnostic Substances
|
$37.15
|
-0.39
-1.04% |
$37.26
|
132,325
157.53% of 50 DAV
50 DAV is 84,000
|
$37.97
-2.15%
|
9/1/2010
|
$30.79
|
PP = $30.49
|
|
MB = $32.01
|
Most Recent Note - 11/30/2010 3:21:16 PM
G - Stubbornly holding its ground near all-time highs with volume totals cooling. It is extended from any sound base, and its 50 DMA line recently has been a reliable support level.
>>> The latest Featured Stock Update with an annotated graph appeared on 10/13/2010. Click here.
View all notes |
Alert me of new notes |
CANSLIM.net Company Profile |
SEC |
Zacks Reports |
StockTalk |
News |
Chart |
Request a new note
C
A N
S L
I M
|
NFLX
-
NASDAQ
Netflix Inc
SPECIALTY RETAIL - Music and Video Stores
|
$205.90
|
+6.98
3.51% |
$206.80
|
11,874,447
207.02% of 50 DAV
50 DAV is 5,736,000
|
$200.00
2.95%
|
11/9/2010
|
$173.10
|
PP = $184.84
|
|
MB = $194.08
|
Most Recent Note - 11/30/2010 1:39:53 PM
G - Rising further into new high ground, getting extended from its latest base. A follow-through day has not confirmed a new rally since recent concerns were raised about the M criteria.
>>> The latest Featured Stock Update with an annotated graph appeared on 11/24/2010. Click here.
View all notes |
Alert me of new notes |
CANSLIM.net Company Profile |
SEC |
Zacks Reports |
StockTalk |
News |
Chart |
Request a new note
C
A N
S L
I M
|
Symbol/Exchange
Company Name
Industry Group |
PRICE |
CHANGE
(%Change) |
Day High |
Volume
(% DAV)
(% 50 day avg vol) |
52 Wk Hi
% From Hi |
Featured
Date |
Price
Featured |
Pivot Featured |
|
Max Buy |
NTAP
-
NASDAQ
Netapp Inc
COMPUTER HARDWARE - Data Storage Devices
|
$50.93
|
+0.00
0.00% |
$51.15
|
5,311,990
71.28% of 50 DAV
50 DAV is 7,451,800
|
$57.96
-12.13%
|
9/8/2010
|
$46.98
|
PP = $44.99
|
|
MB = $47.24
|
Most Recent Note - 11/26/2010 1:25:03 PM
G - Losses this week led to a slump below its 50 DMA line and prior highs. On 11/19/10 it was noted - "It has not formed a sound base, and the weakness suggests that it may be due for a longer and deeper consolidation."
>>> The latest Featured Stock Update with an annotated graph appeared on 11/3/2010. Click here.
View all notes |
Alert me of new notes |
CANSLIM.net Company Profile |
SEC |
Zacks Reports |
StockTalk |
News |
Chart |
Request a new note
C
A N
S L
I M
|
ORCL
-
NASDAQ
Oracle Corp
COMPUTER SOFTWARE and SERVICES - Application Software
|
$27.05
|
-0.18
-0.64% |
$27.13
|
38,912,350
101.48% of 50 DAV
50 DAV is 38,343,400
|
$29.82
-9.31%
|
9/20/2010
|
$27.32
|
PP = $26.73
|
|
MB = $28.07
|
Most Recent Note - 11/26/2010 1:22:47 PM
G- Color code was changed to green after it sank below its DMA line and under the latest chart low, raising concerns. Gains above its short-term average are needed for its outlook to improve.
>>> The latest Featured Stock Update with an annotated graph appeared on 11/18/2010. Click here.
View all notes |
Alert me of new notes |
CANSLIM.net Company Profile |
SEC |
Zacks Reports |
StockTalk |
News |
Chart |
Request a new note
C
A N
S L
I M
|
PAY
-
NYSE
Verifone Systems Inc
COMPUTER HARDWARE - Transaction Automation Systems
|
$34.75
|
+0.49
1.43% |
$35.19
|
1,539,208
111.65% of 50 DAV
50 DAV is 1,378,600
|
$35.94
-3.31%
|
11/29/2010
|
$33.96
|
PP = $36.04
|
|
MB = $37.84
|
Most Recent Note - 11/29/2010 1:21:25 PM
Y - Volume totals have cooled after rallying near its 52-week high recently. Color code is changed to yellow with new pivot point cited based on its 52-week high plus ten cents. A subsequent breakout could trigger a new (or add-on) technical buy signal, meanwhile patience and discipline are paramount. As previously noted, it has formed an advanced "ascending base" pattern after an impressive rally from its 7/26/10 breakout.
>>> The latest Featured Stock Update with an annotated graph appeared on 10/25/2010. Click here.
View all notes |
Alert me of new notes |
CANSLIM.net Company Profile |
SEC |
Zacks Reports |
StockTalk |
News |
Chart |
Request a new note
C
A N
S L
I M
|
RAX
-
NYSE
Rackspace Hosting Inc
INTERNET - Internet Software and; Services
|
$29.17
|
+0.32
1.11% |
$29.19
|
1,464,879
54.86% of 50 DAV
50 DAV is 2,670,400
|
$29.35
-0.61%
|
9/21/2010
|
$22.84
|
PP = $23.61
|
|
MB = $24.79
|
Most Recent Note - 11/30/2010 3:22:26 PM
G - Touched a new all-time high today. Volume totals have been cooling in recent weeks and no resistance remains due to overhead supply, but it is extended from any sound base.
>>> The latest Featured Stock Update with an annotated graph appeared on 11/17/2010. Click here.
View all notes |
Alert me of new notes |
CANSLIM.net Company Profile |
SEC |
Zacks Reports |
StockTalk |
News |
Chart |
Request a new note
C
A N
S L
I M
|
ROVI
-
NASDAQ
Rovi Corp
COMPUTER SOFTWARE andamp; SERVICES - Security Software andamp; Services
|
$55.17
|
+0.80
1.47% |
$55.23
|
1,221,819
80.22% of 50 DAV
50 DAV is 1,523,100
|
$55.25
-0.14%
|
10/29/2010
|
$49.99
|
PP = $53.10
|
|
MB = $55.76
|
Most Recent Note - 11/30/2010 2:20:20 PM
Y - Wedging to new 52-week highs with small gains lacking great volume conviction. Confirming gains on heavy volume coupled with a follow-through day from at least one of the major market averages (M criteria) could trigger new (or add-on) technical buy signals. Meanwhile, its 50 DMA line defines important support to watch.
>>> The latest Featured Stock Update with an annotated graph appeared on 10/20/2010. Click here.
View all notes |
Alert me of new notes |
CANSLIM.net Company Profile |
SEC |
Zacks Reports |
StockTalk |
News |
Chart |
Request a new note
C
A N
S L
I M
|
Symbol/Exchange
Company Name
Industry Group |
PRICE |
CHANGE
(%Change) |
Day High |
Volume
(% DAV)
(% 50 day avg vol) |
52 Wk Hi
% From Hi |
Featured
Date |
Price
Featured |
Pivot Featured |
|
Max Buy |
SHOO
-
NASDAQ
Steven Madden Limited
CONSUMER NON-DURABLES - Textile - Apparel Footwear
|
$45.25
|
-1.17
-2.52% |
$46.75
|
620,880
176.69% of 50 DAV
50 DAV is 351,400
|
$46.52
-2.73%
|
11/23/2010
|
$44.61
|
PP = $44.95
|
|
MB = $47.20
|
Most Recent Note - 11/30/2010 5:55:25 PM
Y - Hit another new 2010 high today but then reversed into the red. Its 11/29/10 gain above the new pivot point cited with twice average volume met the guidelines for a new (or add-on) technical buy signal. No resistance remains due to overhead supply, but the questionable M criteria is an overriding concern impacting new buying efforts until a follow-through day occurs.
>>> The latest Featured Stock Update with an annotated graph appeared on 11/23/2010. Click here.
View all notes |
Alert me of new notes |
CANSLIM.net Company Profile |
SEC |
Zacks Reports |
StockTalk |
News |
Chart |
Request a new note
C
A N
S L
I M
|
SLW
-
NYSE
Silver Wheaton Corp
METALS and; MINING - Silver
|
$36.89
|
+1.06
2.96% |
$37.15
|
10,914,718
115.40% of 50 DAV
50 DAV is 9,458,500
|
$37.20
-0.83%
|
8/25/2010
|
$21.40
|
PP = $21.99
|
|
MB = $23.09
|
Most Recent Note - 11/30/2010 2:17:49 PM
G - Gain today helped it touch a new all-time high. It is extended from any sound base, and the recent low ($30.52 on 11/16/10) defines initial support above its 50 DMA line.
>>> The latest Featured Stock Update with an annotated graph appeared on 10/18/2010. Click here.
View all notes |
Alert me of new notes |
CANSLIM.net Company Profile |
SEC |
Zacks Reports |
StockTalk |
News |
Chart |
Request a new note
C
A N
S L
I M
|
UA
-
NYSE
Under Armour Inc Cl A
CONSUMER NON-DURABLES - Textile - Apparel Clothing
|
$57.73
|
+1.70
3.03% |
$57.84
|
849,095
114.90% of 50 DAV
50 DAV is 739,000
|
$57.22
0.89%
|
9/9/2010
|
$39.99
|
PP = $40.10
|
|
MB = $42.11
|
Most Recent Note - 11/30/2010 2:18:34 PM
G - Hit yet another new 52-week high today. The high-ranked Apparel - Clothing firm is very extended from any sound base and well above support at its 50 DMA line.
>>> The latest Featured Stock Update with an annotated graph appeared on 11/4/2010. Click here.
View all notes |
Alert me of new notes |
CANSLIM.net Company Profile |
SEC |
Zacks Reports |
StockTalk |
News |
Chart |
Request a new note
C
A N
S L
I M
|
ULTA
-
NASDAQ
Ulta Salon Cosm & Frag
SPECIALTY RETAIL - Specialty Retail, Other
|
$34.95
|
-0.20
-0.57% |
$35.96
|
756,151
169.09% of 50 DAV
50 DAV is 447,200
|
$35.55
-1.69%
|
9/3/2010
|
$26.36
|
PP = $25.89
|
|
MB = $27.18
|
Most Recent Note - 11/30/2010 1:50:00 PM
G - Today's 6th consecutive gain helped it hit a new all-time high. It is extended from any recent base, meanwhile, its 50 DMA line defines initial support to watch.
>>> The latest Featured Stock Update with an annotated graph appeared on 11/1/2010. Click here.
View all notes |
Alert me of new notes |
CANSLIM.net Company Profile |
SEC |
Zacks Reports |
StockTalk |
News |
Chart |
Request a new note
C
A N
S L
I M
|
VIT
-
NYSE
Vanceinfo Tech Inc Ads
COMPUTER SOFTWARE and SERVICES - Business Software and Services
|
$37.61
|
+0.13
0.35% |
$37.66
|
552,574
84.26% of 50 DAV
50 DAV is 655,800
|
$38.43
-2.13%
|
7/8/2010
|
$25.20
|
PP = $26.58
|
|
MB = $27.91
|
Most Recent Note - 11/26/2010 1:34:12 PM
G - Completed a Public Offering this week and it is perched near all-time highs. It 50 DMA line has acted as support recently, but it has not formed a sound base.
>>> The latest Featured Stock Update with an annotated graph appeared on 10/21/2010. Click here.
View all notes |
Alert me of new notes |
CANSLIM.net Company Profile |
SEC |
Zacks Reports |
StockTalk |
News |
Chart |
Request a new note
C
A N
S L
I M
|
Symbol/Exchange
Company Name
Industry Group |
PRICE |
CHANGE
(%Change) |
Day High |
Volume
(% DAV)
(% 50 day avg vol) |
52 Wk Hi
% From Hi |
Featured
Date |
Price
Featured |
Pivot Featured |
|
Max Buy |