You are not logged in.
This means you
CAN ONLY VIEW reports that were published prior to Monday, April 14, 2025.
You
MUST UPGRADE YOUR MEMBERSHIP if you want to see any current reports.
AFTER MARKET UPDATE - TUESDAY, NOVEMBER 29TH, 2011
Previous After Market Report Next After Market Report >>>
|
|
|
|
DOW |
+32.62 |
11,555.63 |
+0.28% |
|
Volume |
918,363,400 |
-4% |
|
Volume |
1,561,506,090 |
-0% |
|
NASDAQ |
-11.83 |
2,515.51 |
-0.47% |
|
Advancers |
1,403 |
45% |
|
Advancers |
953 |
36% |
|
S&P 500 |
+2.64 |
1,195.19 |
+0.22% |
|
Decliners |
1,613 |
52% |
|
Decliners |
1,579 |
60% |
|
Russell 2000 |
-1.80 |
696.10 |
-0.26% |
|
52 Wk Highs |
42 |
|
|
52 Wk Highs |
23 |
|
|
S&P 600 |
-0.87 |
387.81 |
-0.22% |
|
52 Wk Lows |
60 |
|
|
52 Wk Lows |
106 |
|
|
 |
Major Averages End Mixed After Early Gains Fade
Kenneth J. Gruneisen - Passed the CAN SLIM® Master's Exam
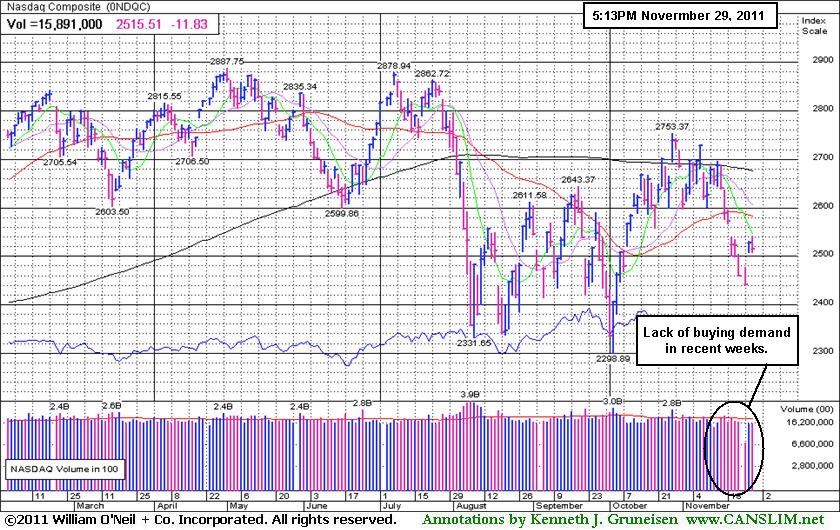
The Dow Jones Industrial Average and S&P 500 Index managed to close in the green, but the Nasdaq Composite Index lagged behind. Decliners narrowly led advancers by a 8-7 margin on the NYSE and while decliners beat advancers by 3-2 on the Nasdaq exchange. Volume was lighter on the NYSE and near the prior session total on the Nasdaq exchange. New 52-week lows outnumbered new 52-week highs on the NYSE and on the Nasdaq exchange. There were 16 high-ranked company from the CANSLIM.net Leaders List that made a new 52-week high and appeared on the CANSLIM.net BreakOuts Page, up from the prior session total of 10 stocks. There were gains for only 5 of the 15 of the high-ranked companies currently included on the Featured Stocks Page.
Stocks pared gains as declines in technology shares put a damper on an early rally triggered by a jump in consumer confidence. The Conference Board's index of consumer sentiment climbed in November by the most since 2003 as Americans grew more upbeat about employment and income prospects. European efforts added to optimism. Well-received bond auctions by Belgium and Italy eased some contagion concerns and euro-area finance ministers met to discuss ways to end the debt crisis. Fed speak was also in focus. Atlanta Fed President Lockhart said that expanding securities purchases is unlikely to give a sufficient boost to U.S. growth.
Overall, most sectors were higher, led by energy, while technology stocks slipped. Energy stocks got a boost as crude oil inched toward $100 a barrel. Meanwhile, chipmakers Broadcom Corp (BRCM -2.78%) and Qualcomm Inc (QCOM -1.54%) dragged techs lower.
The 10-year note closed off 9/32 to yield 2.00%, pushing the yield higher for a third straight day in the longest stretch of increases this month.
Our monthly newsletter CANSLIM.net News will be published soon with an informative review of current market conditions, leading groups, and best buy candidates. Via the Premium Member Homepage links to all prior reports and webcasts are always available.
PICTURED: The Nasdaq Composite Index graph above shows a lack of buying demand in recent weeks while it is sputtering below the 50-day and 200-day moving average lines.
|
 Kenneth J. Gruneisen started out as a licensed stockbroker in August 1987, a couple of months prior to the historic stock market crash that took the Dow Jones Industrial Average down -22.6% in a single day. He has published daily fact-based fundamental and technical analysis on high-ranked stocks online for two decades. Through FACTBASEDINVESTING.COM, Kenneth provides educational articles, news, market commentary, and other information regarding proven investment systems that work in good times and bad.
Comments contained in the body of this report are technical opinions only and are not necessarily those of Gruneisen Growth Corp. The material herein has been obtained from sources believed to be reliable and accurate, however, its accuracy and completeness cannot be guaranteed. Our firm, employees, and customers may effect transactions, including transactions contrary to any recommendation herein, or have positions in the securities mentioned herein or options with respect thereto. Any recommendation contained in this report may not be suitable for all investors and it is not to be deemed an offer or solicitation on our part with respect to the purchase or sale of any securities. |
|
 |
Tech Sector Drags Nasdaq Down
Kenneth J. Gruneisen - Passed the CAN SLIM® Master's Exam
The tech sector had a negative bias as the Networking Index ($NWX -1.55%), Internet Index ($IIX -0.76%), Semiconductor Index ($SOX -0.72%), and Biotechnology Index ($BTK -0.64%) lost ground. Financial stocks also created a drag as the Broker/Dealer Index ($XBD -0.62%) and Bank Index ($BKX -0.61%) ended lower. Commodity-linked groups had a positive drift as the Oil Services Index ($OSX +0.23%) and Integrated Oil Index ($XOI +1.28%) rose along with the Gold & Silver Index ($XAU +0.76%). The Retail Index ($RLX +0.65%) and Healthcare Index ($HMO +1.43%) also were a positive influence.
Charts courtesy www.stockcharts.com
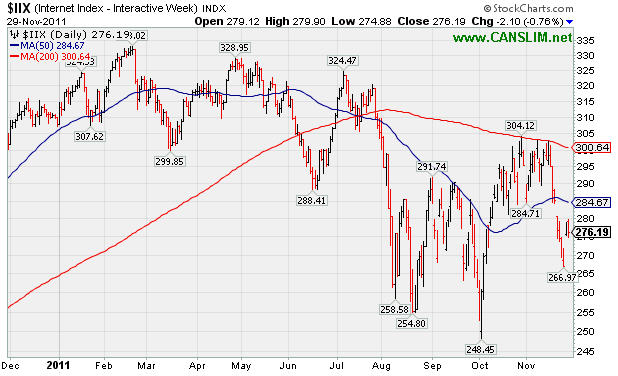
PICTURED: The Internet Index ($IIX -0.76%) is sputtering below its 50-day and 200-day moving average lines in poor technical shape.
| Oil Services |
$OSX |
217.60 |
+0.50 |
+0.23% |
-11.23% |
| Healthcare |
$HMO |
2,225.14 |
+31.36 |
+1.43% |
+31.51% |
| Integrated Oil |
$XOI |
1,171.84 |
+14.82 |
+1.28% |
-3.41% |
| Semiconductor |
$SOX |
352.62 |
-2.55 |
-0.72% |
-14.38% |
| Networking |
$NWX |
214.12 |
-3.37 |
-1.55% |
-23.68% |
| Internet |
$IIX |
276.19 |
-2.10 |
-0.76% |
-10.25% |
| Broker/Dealer |
$XBD |
78.82 |
-0.49 |
-0.62% |
-35.14% |
| Retail |
$RLX |
519.21 |
+3.34 |
+0.65% |
+2.13% |
| Gold & Silver |
$XAU |
194.87 |
+1.47 |
+0.76% |
-14.00% |
| Bank |
$BKX |
35.63 |
-0.22 |
-0.61% |
-31.76% |
| Biotech |
$BTK |
1,035.06 |
-6.62 |
-0.64% |
-20.23% |
|
|
|
 |
Little Resistance Due to Overhead Supply
Kenneth J. Gruneisen - Passed the CAN SLIM® Master's Exam
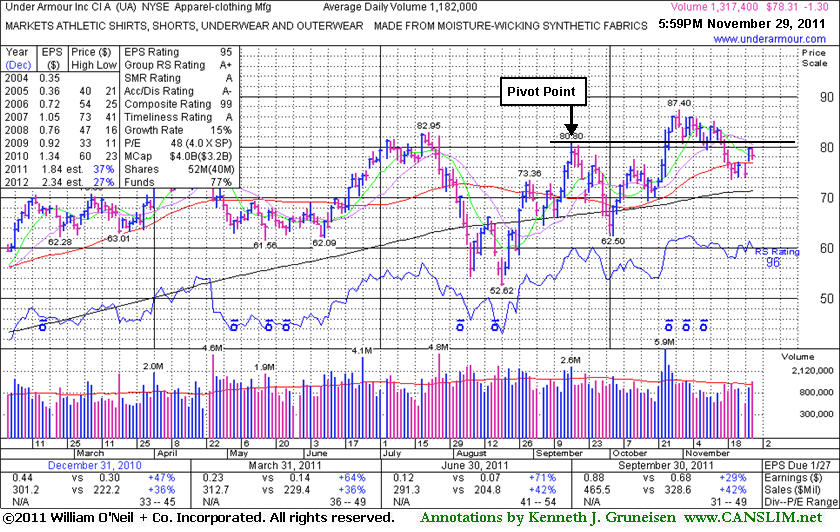
Under Armour Inc (UA -$1.30 or -1.63% to $78.31) has rallied back above its 50-day moving average (DMA) line which helped its technical stance improve. Little resistance remains due to overhead supply following its recent consolidation. Its 200 DMA line defines the next important support level. Its last appearance in this FSU section was on 11/03/11 with an annotated graph under the headline, "Found Support Near Pivot Point After Volume-Driven Breakout", while perched near its all-time high.
The high-ranked Apparel - Clothing Manufacturing firm was highlighted in yellow in the 10/25/11 mid-day report (read here) with an annotated graph illustrating its volume-driven breakout from a "reverse-head-and-shoulders" base pattern. Proof of fresh buying demand may be a reassurance worth waiting on before accumulating. Volume-driven gains to new high ground could signal the beginning of a longer and more substantial advance. During its recent rebound there were bullish signs of heavy new institutional buying demand, a very reassuring characteristic when considering new buying efforts in any stock. UA reported earnings +29% on +42% sales revenues for the quarter ended September 30, 2011 versus the year ago period. The number of top-rated funds owning its shares rose from 339 in Dec '10 to 420 in Sep '11, a reassuring trend concerning the I criteria. Earlier notes had acknowledged the downward turn in annual earnings (A criteria) in FY '08, a concern with respect to the fact-based investment system.
|
|
|
Color Codes Explained :
Y - Better candidates highlighted by our
staff of experts.
G - Previously featured
in past reports as yellow but may no longer be buyable under the
guidelines.
***Last / Change / Volume data in this table is the closing quote data***
Symbol/Exchange
Company Name
Industry Group |
PRICE |
CHANGE
(%Change) |
Day High |
Volume
(% DAV)
(% 50 day avg vol) |
52 Wk Hi
% From Hi |
Featured
Date |
Price
Featured |
Pivot Featured |
|
Max Buy |
ADS
-
NYSE
Alliance Data Sys Corp
COMPUTER SOFTWARE and SERVICES - Information and Delivery Service
|
$97.38
|
+0.98
1.02% |
$98.00
|
827,621
87.13% of 50 DAV
50 DAV is 949,900
|
$107.18
-9.14%
|
10/21/2011
|
$97.94
|
PP = $101.15
|
|
MB = $106.21
|
Most Recent Note - 11/28/2011 8:40:34 PM
G - Gapped up today for a solid gain on near average volume halting a streak of 9 consecutive losses. The next important chart support is at its 200 DMA line.
>>> The latest Featured Stock Update with an annotated graph appeared on 11/17/2011. Click here.
View all notes |
Alert me of new notes |
CANSLIM.net Company Profile |
SEC |
Zacks Reports |
StockTalk |
News |
Chart |
Request a new note
C
A N
S L
I M


|
ALXN
-
NASDAQ
Alexion Pharmaceuticals
DRUGS - Drug Manufacturers - Other
|
$65.97
|
-1.50
-2.22% |
$67.62
|
1,200,353
78.90% of 50 DAV
50 DAV is 1,521,300
|
$70.42
-6.32%
|
9/15/2011
|
$63.20
|
PP = $60.81
|
|
MB = $63.85
|
Most Recent Note - 11/28/2011 7:59:09 PM
Y - Rallied above its 50 DMA line today, helping its outlook, and its color code is changed to yellow again. Any subsequent violation of its recent low ($62.02 on 11/21/11) would raise more serious concerns and trigger a more worrisome technical sell signal.
>>> The latest Featured Stock Update with an annotated graph appeared on 11/14/2011. Click here.
View all notes |
Alert me of new notes |
CANSLIM.net Company Profile |
SEC |
Zacks Reports |
StockTalk |
News |
Chart |
Request a new note
C
A N
S L
I M
|
CELG
-
NASDAQ
Celgene Corp
DRUGS - Drug Manufacturers - Major
|
$61.23
|
-0.82
-1.32% |
$62.70
|
3,223,803
83.92% of 50 DAV
50 DAV is 3,841,700
|
$68.25
-10.29%
|
9/16/2011
|
$61.21
|
PP = $62.59
|
|
MB = $65.72
|
Most Recent Note - 11/28/2011 8:01:04 PM
G - Finished near the session high today with a solid gain on near average volume helping it rally from a slump near its 200 DMA line. A rebound above its 50 DMA line is needed for its outlook to improve.
>>> The latest Featured Stock Update with an annotated graph appeared on 11/7/2011. Click here.
View all notes |
Alert me of new notes |
CANSLIM.net Company Profile |
SEC |
Zacks Reports |
StockTalk |
News |
Chart |
Request a new note
C
A N
S L
I M
|
FEIC
-
NASDAQ
F E I Co
ELECTRONICS - Diversified Electronics
|
$37.67
|
-0.14
-0.37% |
$37.73
|
198,522
45.44% of 50 DAV
50 DAV is 436,900
|
$42.25
-10.84%
|
10/28/2011
|
$40.31
|
PP = $40.88
|
|
MB = $42.92
|
Most Recent Note - 11/28/2011 8:04:30 PM
G - Gain today on light volume halted a 7 session losing streak. It faces some resistance due to overhead supply up through the $42 area.
>>> The latest Featured Stock Update with an annotated graph appeared on 11/25/2011. Click here.
View all notes |
Alert me of new notes |
CANSLIM.net Company Profile |
SEC |
Zacks Reports |
StockTalk |
News |
Chart |
Request a new note
C
A N
S L
I M
|
GNC
-
NYSE
G N C Holdings Inc
RETAIL - Drug Stores
|
$27.23
|
-0.36
-1.30% |
$27.64
|
796,124
61.99% of 50 DAV
50 DAV is 1,284,300
|
$28.50
-4.46%
|
10/26/2011
|
$24.60
|
PP = $24.80
|
|
MB = $26.04
|
Most Recent Note - 11/28/2011 8:06:50 PM
G - Gain today on light volume for a new all-time high. Prior chart highs in the $25-26 area define initial support to watch on pullbacks.
>>> The latest Featured Stock Update with an annotated graph appeared on 11/21/2011. Click here.
View all notes |
Alert me of new notes |
CANSLIM.net Company Profile |
SEC |
Zacks Reports |
StockTalk |
News |
Chart |
Request a new note
C
A N
S L
I M
|
Symbol/Exchange
Company Name
Industry Group |
PRICE |
CHANGE
(%Change) |
Day High |
Volume
(% DAV)
(% 50 day avg vol) |
52 Wk Hi
% From Hi |
Featured
Date |
Price
Featured |
Pivot Featured |
|
Max Buy |
HMSY
-
NASDAQ
H M S Holdings Corp
COMPUTER SOFTWARE and SERVICES - Healthcare Information Service
|
$28.98
|
+0.08
0.28% |
$29.18
|
559,787
82.49% of 50 DAV
50 DAV is 678,600
|
$31.99
-9.41%
|
10/27/2011
|
$26.44
|
PP = $28.37
|
|
MB = $29.79
|
Most Recent Note - 11/28/2011 8:35:04 PM
Y - Gapped up today for a solid gain on average volume, closing back above its previously cited pivot point helping its outlook improve. Prior highs in the $27-28 area acted as support during the recent pullback.
>>> The latest Featured Stock Update with an annotated graph appeared on 11/4/2011. Click here.
View all notes |
Alert me of new notes |
CANSLIM.net Company Profile |
SEC |
Zacks Reports |
StockTalk |
News |
Chart |
Request a new note
C
A N
S L
I M
|
ISRG
-
NASDAQ
Intuitive Surgical Inc
HEALTH SERVICES - Medical Appliances and Equipment
|
$422.62
|
-2.34
-0.55% |
$425.81
|
298,937
72.43% of 50 DAV
50 DAV is 412,700
|
$449.06
-5.89%
|
10/19/2011
|
$424.69
|
PP = $415.29
|
|
MB = $436.05
|
Most Recent Note - 11/28/2011 8:38:36 PM
Y - Gapped up today for a solid gain on higher (near average) volume to halt a 7 session losing streak. Consolidating above its 50 DMA line and above the old high which was the basis for the last pivot point cited.
>>> The latest Featured Stock Update with an annotated graph appeared on 11/15/2011. Click here.
View all notes |
Alert me of new notes |
CANSLIM.net Company Profile |
SEC |
Zacks Reports |
StockTalk |
News |
Chart |
Request a new note
C
A N
S L
I M
|
MG
-
NYSE
Mistras Group Inc
DIVERSIFIED SERVICES - Bulding and Faci;ity Management Services
|
$22.66
|
+0.55
2.49% |
$22.70
|
183,193
88.46% of 50 DAV
50 DAV is 207,100
|
$23.51
-3.62%
|
10/28/2011
|
$22.49
|
PP = $23.61
|
|
MB = $24.79
|
Most Recent Note - 11/28/2011 7:22:22 PM
Y - Considerable gap up and gain today with below average volume. Its 50 DMA line and prior highs acted as important chart support near $21 during the recent consolidation. Subsequent violation of the recent low would raise concerns and trigger a technical sell signal.
>>> The latest Featured Stock Update with an annotated graph appeared on 11/11/2011. Click here.
View all notes |
Alert me of new notes |
CANSLIM.net Company Profile |
SEC |
Zacks Reports |
StockTalk |
News |
Chart |
Request a new note
C
A N
S L
I M
|
MKTX
-
NASDAQ
Marketaxess Holdings Inc
FINANCIAL SERVICES - Investment Brokerage - Nationa
|
$27.85
|
-0.03
-0.11% |
$28.08
|
121,924
50.36% of 50 DAV
50 DAV is 242,100
|
$31.45
-11.45%
|
10/28/2011
|
$29.79
|
PP = $31.05
|
|
MB = $32.60
|
Most Recent Note - 11/28/2011 7:46:21 PM
G - A considerable gain today with below average volume helped it rebound above its 50 DMA line helping its technical stance improve. Prior lows and its 200 DMA line in the $24-25 area define important support to watch.
>>> The latest Featured Stock Update with an annotated graph appeared on 11/23/2011. Click here.
View all notes |
Alert me of new notes |
CANSLIM.net Company Profile |
SEC |
Zacks Reports |
StockTalk |
News |
Chart |
Request a new note
C
A N
S L
I M
|
OSIS
-
NASDAQ
O S I Systems Inc
ELECTRONICS - Semiconductor Equipment and Mate
|
$44.98
|
+0.18
0.40% |
$45.06
|
76,285
51.40% of 50 DAV
50 DAV is 148,400
|
$47.39
-5.09%
|
11/1/2011
|
$42.07
|
PP = $45.57
|
|
MB = $47.85
|
Most Recent Note - 11/28/2011 8:31:12 PM
Y - Gapped up today, rallying with higher (but still below average) volume back toward its pivot point. Color code is changed to yellow while consolidating well above its 50 DMA line. See the latest FSU analysis for more details and a new annotated graph.
>>> The latest Featured Stock Update with an annotated graph appeared on 11/28/2011. Click here.
View all notes |
Alert me of new notes |
CANSLIM.net Company Profile |
SEC |
Zacks Reports |
StockTalk |
News |
Chart |
Request a new note
C
A N
S L
I M
|
Symbol/Exchange
Company Name
Industry Group |
PRICE |
CHANGE
(%Change) |
Day High |
Volume
(% DAV)
(% 50 day avg vol) |
52 Wk Hi
% From Hi |
Featured
Date |
Price
Featured |
Pivot Featured |
|
Max Buy |
RAX
-
NYSE
Rackspace Hosting Inc
INTERNET - Internet Software and; Services
|
$41.67
|
+0.05
0.12% |
$42.39
|
1,200,851
75.50% of 50 DAV
50 DAV is 1,590,600
|
$46.50
-10.38%
|
11/8/2011
|
$44.28
|
PP = $46.27
|
|
MB = $48.58
|
Most Recent Note - 11/28/2011 7:55:33 PM
G - Solid gain today on average volume, rallying from support at its 50 and 200 DMA lines. Subsequent violations would trigger damaging technical sell signals, meanwhile it faces near-term resistance up through the $45 area.
>>> The latest Featured Stock Update with an annotated graph appeared on 11/10/2011. Click here.
View all notes |
Alert me of new notes |
CANSLIM.net Company Profile |
SEC |
Zacks Reports |
StockTalk |
News |
Chart |
Request a new note
C
A N
S L
I M
|
SWI
-
NYSE
Solarwinds Inc
COMPUTER SOFTWARE and SERVICES - Application Software
|
$30.64
|
-0.19
-0.62% |
$30.86
|
913,869
77.96% of 50 DAV
50 DAV is 1,172,200
|
$31.69
-3.31%
|
10/27/2011
|
$27.78
|
PP = $25.62
|
|
MB = $26.90
|
Most Recent Note - 11/28/2011 7:57:25 PM
G - Small gap up today on near average volume. Recently holding its ground in a tight trading range near its all-time high. Prior highs in the $25-26 area define initial chart support to watch on pullbacks.
>>> The latest Featured Stock Update with an annotated graph appeared on 11/22/2011. Click here.
View all notes |
Alert me of new notes |
CANSLIM.net Company Profile |
SEC |
Zacks Reports |
StockTalk |
News |
Chart |
Request a new note
C
A N
S L
I M
|
TDG
-
NYSE
Transdigm Group Inc
AEROSPACE/DEFENSE - Aerospace/Defense Products and; Services
|
$92.57
|
-0.41
-0.44% |
$93.79
|
306,700
74.26% of 50 DAV
50 DAV is 413,000
|
$102.73
-9.89%
|
11/9/2011
|
$98.45
|
PP = $95.14
|
|
MB = $99.90
|
Most Recent Note - 11/28/2011 8:42:14 PM
Y - Posted a solid gain today with above average volume. On 11/17/11 it marked its top with a negative reversal for a loss on heavy volume. Its 50 DMA line defines near-term support to watch.
>>> The latest Featured Stock Update with an annotated graph appeared on 11/9/2011. Click here.
View all notes |
Alert me of new notes |
CANSLIM.net Company Profile |
SEC |
Zacks Reports |
StockTalk |
News |
Chart |
Request a new note
C
A N
S L
I M
|
UA
-
NYSE
Under Armour Inc Cl A
CONSUMER NON-DURABLES - Textile - Apparel Clothing
|
$78.31
|
-1.30
-1.63% |
$79.87
|
1,332,963
100.34% of 50 DAV
50 DAV is 1,328,400
|
$87.40
-10.40%
|
10/25/2011
|
$82.43
|
PP = $80.80
|
|
MB = $84.84
|
Most Recent Note - 11/28/2011 7:49:16 PM
G - Gain today with near average volume helped it rally above its 50 DMA line helping its technical stance improve. Its 200 DMA line defines the next important support level.
>>> The latest Featured Stock Update with an annotated graph appeared on 11/29/2011. Click here.
View all notes |
Alert me of new notes |
CANSLIM.net Company Profile |
SEC |
Zacks Reports |
StockTalk |
News |
Chart |
Request a new note
C
A N
S L
I M
|
V
-
NYSE
Visa Inc Cl A
DIVERSIFIED SERVICES - Business/Management Services
|
$92.90
|
-0.57
-0.61% |
$93.50
|
3,628,347
68.39% of 50 DAV
50 DAV is 5,305,100
|
$95.87
-3.10%
|
10/24/2011
|
$94.21
|
PP = $94.85
|
|
MB = $99.59
|
Most Recent Note - 11/28/2011 7:53:33 PM
Y - Gap up gain today with below average volume helped it rally above its 50 DMA line, improving its technical stance, and its color code its changed to yellow.
>>> The latest Featured Stock Update with an annotated graph appeared on 11/18/2011. Click here.
View all notes |
Alert me of new notes |
CANSLIM.net Company Profile |
SEC |
Zacks Reports |
StockTalk |
News |
Chart |
Request a new note
C
A N
S L
I M
|
Symbol/Exchange
Company Name
Industry Group |
PRICE |
CHANGE
(%Change) |
Day High |
Volume
(% DAV)
(% 50 day avg vol) |
52 Wk Hi
% From Hi |
Featured
Date |
Price
Featured |
Pivot Featured |
|
Max Buy |
|
|
|
THESE ARE NOT BUY RECOMMENDATIONS!
Comments contained in the body of this report are technical
opinions only. The material herein has been obtained
from sources believed to be reliable and accurate, however,
its accuracy and completeness cannot be guaranteed.
This site is not an investment advisor, hence it does
not endorse or recommend any securities or other investments.
Any recommendation contained in this report may not
be suitable for all investors and it is not to be deemed
an offer or solicitation on our part with respect to
the purchase or sale of any securities. All trademarks,
service marks and trade names appearing in this report
are the property of their respective owners, and are
likewise used for identification purposes only.
This report is a service available
only to active Paid Premium Members.
You may opt-out of receiving report notifications
at any time. Questions or comments may be submitted
by writing to Premium Membership Services 665 S.E. 10 Street, Suite 201 Deerfield Beach, FL 33441-5634 or by calling 1-800-965-8307
or 954-785-1121.
|
|
|

