***Last / Change / Volume data in this table is the closing quote data***
Symbol/Exchange
Company Name
Industry Group |
PRICE |
CHANGE
(%Change) |
Day High |
Volume
(% DAV)
(% 50 day avg vol) |
52 Wk Hi
% From Hi |
Featured
Date |
Price
Featured |
Pivot Featured |
|
Max Buy |
ABV
-
NYSE
Comp De Bebidas Adr
FOOD and BEVERAGE - Beverages - Brewers
|
$138.28
|
-0.87
-0.63% |
$139.31
|
523,933
80.48% of 50 DAV
50 DAV is 651,000
|
$145.36
-4.87%
|
11/4/2010
|
$142.35
|
PP = $143.63
|
|
MB = $150.81
|
Most Recent Note - 11/26/2010 1:11:02 PM
Y - Consolidating near all-time highs with volume totals cooling in recent weeks. Confirming gains to new highs on heavy volume would be a reassuring sign of institutional demand. Meanwhile, recent lows defines support near its 50 DMA line.
>>> The latest Featured Stock Update with an annotated graph appeared on 10/11/2010. Click here.
View all notes |
Alert me of new notes |
CANSLIM.net Company Profile |
SEC |
Zacks Reports |
StockTalk |
News |
Chart |
Request a new note
C
A N
S L
I M


|
ARUN
-
NASDAQ
Aruba Networks Inc
COMPUTER HARDWARE - Networking andamp; Communication Dev
|
$23.05
|
-0.89
-3.72% |
$24.08
|
2,343,175
93.04% of 50 DAV
50 DAV is 2,518,400
|
$24.28
-5.07%
|
8/30/2010
|
$18.12
|
PP = $18.51
|
|
MB = $19.44
|
 Most Recent Note - 11/29/2010 1:09:36 PM
G - Pulling back today after gains last week helped it rise above its 2007 peak to a new all-time high. Its 50 DMA line and an upward trendline connecting May - November lows define support to watch.
>>> The latest Featured Stock Update with an annotated graph appeared on 10/26/2010. Click here.
View all notes |
Alert me of new notes |
CANSLIM.net Company Profile |
SEC |
Zacks Reports |
StockTalk |
News |
Chart |
Request a new note
C
A N
S L
I M
|
BIDU
-
NASDAQ
Baidu Inc Ads
INTERNET - Internet Information Providers
|
$107.38
|
-1.99
-1.82% |
$110.64
|
8,788,300
71.09% of 50 DAV
50 DAV is 12,363,000
|
$115.04
-6.66%
|
9/17/2010
|
$85.73
|
PP = $88.42
|
|
MB = $92.84
|
Most Recent Note - 11/26/2010 1:21:35 PM
G - Volume totals have been cooling while consolidating above its 50 DMA line. A violation of its short-term average or recent chart lows would raise concerns and trigger technical sell signals. BIDU has been noted as a riskier "late stage" candidate after ongoing coverage, yet it could go on to produce more climactic gains.
>>> The latest Featured Stock Update with an annotated graph appeared on 10/7/2010. Click here.
View all notes |
Alert me of new notes |
CANSLIM.net Company Profile |
SEC |
Zacks Reports |
StockTalk |
News |
Chart |
Request a new note
C
A N
S L
I M
|
CACC
-
NASDAQ
Credit Acceptance Corp
FINANCIAL SERVICES - Credit Services
|
$63.07
|
+1.92
3.14% |
$63.17
|
42,281
169.80% of 50 DAV
50 DAV is 24,900
|
$63.45
-0.60%
|
11/22/2010
|
$59.97
|
PP = $62.00
|
|
MB = $65.10
|
Most Recent Note - 11/29/2010 5:10:19 PM
Y - Today's gain with +69% above average volume helped it rally above the pivot point of a "double bottom" type base pattern, meeting the guidelines for a new (or add-on) technical buy signal. However, a follow-through day has not confirmed a new rally since recent concerns were raised about the M criteria.
>>> The latest Featured Stock Update with an annotated graph appeared on 10/29/2010. Click here.
View all notes |
Alert me of new notes |
CANSLIM.net Company Profile |
SEC |
Zacks Reports |
StockTalk |
News |
Chart |
Request a new note
C
A N
S L
I M
|
CIS
-
NYSE
Camelot Info Systems Ads
COMPUTER SOFTWARE andamp; SERVICES - Information Technology Service
|
$21.14
|
+2.37
12.63% |
$21.42
|
1,025,367
395.59% of 50 DAV
50 DAV is 259,200
|
$19.62
7.75%
|
11/26/2010
|
$18.93
|
PP = $19.72
|
|
MB = $20.71
|
Most Recent Note - 11/29/2010 12:30:22 PM
Y - This Chinese Computer Software firm hit a new 52-week high today, trading above its point with above average volume. After a choppy 8-week base during which it found prompt support after a 50 DMA violation, the 11/26/10 mid-day report cited a pivot point based on its 52-week high plus ten cents. As previously noted - "Disciplined investors will resist the temptation to get in 'early' while watching for a convincing breakout and a follow through day from at least one of the major averages (M criteria) as critical reassurances before new buying efforts are justified under the investment system guidelines."
>>> The latest Featured Stock Update with an annotated graph appeared on 11/26/2010. Click here.
View all notes |
Alert me of new notes |
CANSLIM.net Company Profile |
SEC |
Zacks Reports |
StockTalk |
News |
Chart |
Request a new note
C
A N
S L
I M
|
Symbol/Exchange
Company Name
Industry Group |
PRICE |
CHANGE
(%Change) |
Day High |
Volume
(% DAV)
(% 50 day avg vol) |
52 Wk Hi
% From Hi |
Featured
Date |
Price
Featured |
Pivot Featured |
|
Max Buy |
CMG
-
NYSE
Chipotle Mexican Grill
LEISURE - Restaurants
|
$257.01
|
+1.36
0.53% |
$257.79
|
970,645
114.01% of 50 DAV
50 DAV is 851,400
|
$256.49
0.20%
|
9/1/2010
|
$158.31
|
PP = $155.52
|
|
MB = $163.30
|
Most Recent Note - 11/26/2010 11:08:06 AM
G - Gain for a 5th consecutive session today and yet another new all-time high. It is extended from any sound base pattern. Its 50 DMA line (now $201) defines the nearest chart support level.
>>> The latest Featured Stock Update with an annotated graph appeared on 10/28/2010. Click here.
View all notes |
Alert me of new notes |
CANSLIM.net Company Profile |
SEC |
Zacks Reports |
StockTalk |
News |
Chart |
Request a new note
C
A N
S L
I M
|
CTRP
-
NASDAQ
Ctrip.Com Intl Ltd Adr
LEISURE - Resorts and Casinos
|
$46.41
|
-0.67
-1.42% |
$47.63
|
1,591,391
77.36% of 50 DAV
50 DAV is 2,057,200
|
$53.16
-12.70%
|
9/24/2010
|
$46.75
|
PP = $47.11
|
|
MB = $49.47
|
Most Recent Note - 11/26/2010 12:59:14 PM
G - Loss today has it finishing the week below its 50 DMA line after that short-term average acted as resistance. Gains lacked volume conviction after losses with above average volume raised concerns, and subsequent losses below its recent low ($45.05 on 11/16/10) would raise greater concerns.
>>> The latest Featured Stock Update with an annotated graph appeared on 11/22/2010. Click here.
View all notes |
Alert me of new notes |
CANSLIM.net Company Profile |
SEC |
Zacks Reports |
StockTalk |
News |
Chart |
Request a new note
C
A N
S L
I M
|
DECK
-
NASDAQ
Deckers Outdoor Corp
CONSUMER NON-DURABLES - Textile - Apparel Footwear
|
$73.03
|
+0.44
0.61% |
$73.87
|
2,029,317
162.68% of 50 DAV
50 DAV is 1,247,400
|
$72.59
0.61%
|
10/27/2010
|
$54.16
|
PP = $54.86
|
|
MB = $57.60
|
Most Recent Note - 11/29/2010 12:32:12 PM
G - Hit a new high today then reversed into the red. After 7 consecutive gains to new all-time high territory it has been noted as extended from its latest sound base. Prior highs and its 50 DMA line define the nearest chart support.
>>> The latest Featured Stock Update with an annotated graph appeared on 10/27/2010. Click here.
View all notes |
Alert me of new notes |
CANSLIM.net Company Profile |
SEC |
Zacks Reports |
StockTalk |
News |
Chart |
Request a new note
C
A N
S L
I M
|
EZPW
-
NASDAQ
Ezcorp Inc Cl A
SPECIALTY RETAIL - Specialty Retail, Other
|
$25.41
|
-0.49
-1.89% |
$25.93
|
292,850
98.54% of 50 DAV
50 DAV is 297,200
|
$26.14
-2.79%
|
11/5/2010
|
$24.02
|
PP = $23.85
|
|
MB = $25.04
|
Most Recent Note - 11/29/2010 1:13:33 PM
G - Pulling back today after a solid gain for a new all-time high on Friday's holiday-shortened session. Prior highs in the $22-23 area define chart support to watch above its 50 DMA line.
>>> The latest Featured Stock Update with an annotated graph appeared on 11/6/2010. Click here.
View all notes |
Alert me of new notes |
CANSLIM.net Company Profile |
SEC |
Zacks Reports |
StockTalk |
News |
Chart |
Request a new note
C
A N
S L
I M
|
FFIV
-
NASDAQ
F 5 Networks Inc
INTERNET - Internet Software and Services
|
$134.18
|
-0.86
-0.64% |
$136.00
|
1,858,367
65.59% of 50 DAV
50 DAV is 2,833,200
|
$135.23
-0.78%
|
6/16/2010
|
$74.50
|
PP = $74.10
|
|
MB = $77.81
|
Most Recent Note - 11/26/2010 1:05:35 PM
G - Closed near the session high at a new all-time high. Extended from any sound base pattern. Prior highs in the $112 area define initial chart support.
>>> The latest Featured Stock Update with an annotated graph appeared on 11/15/2010. Click here.
View all notes |
Alert me of new notes |
CANSLIM.net Company Profile |
SEC |
Zacks Reports |
StockTalk |
News |
Chart |
Request a new note
C
A N
S L
I M
|
Symbol/Exchange
Company Name
Industry Group |
PRICE |
CHANGE
(%Change) |
Day High |
Volume
(% DAV)
(% 50 day avg vol) |
52 Wk Hi
% From Hi |
Featured
Date |
Price
Featured |
Pivot Featured |
|
Max Buy |
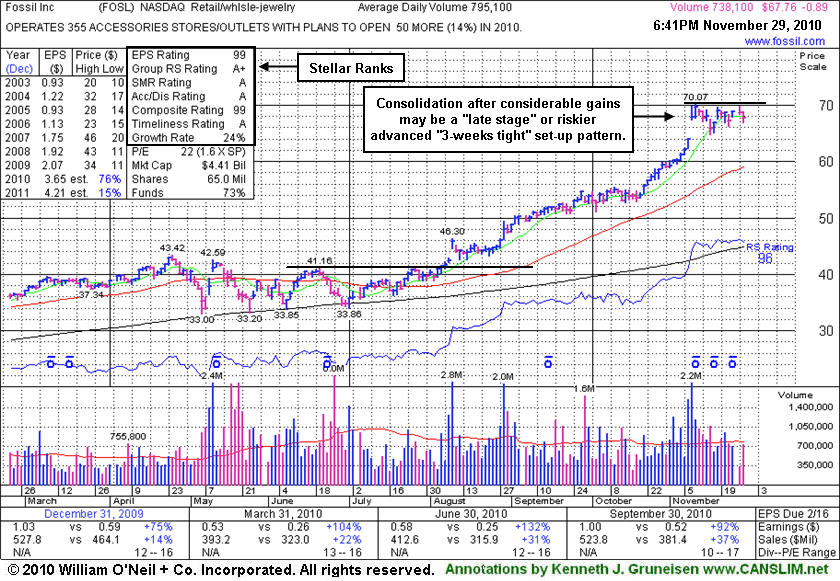
FOSL
-
NASDAQ
Fossil Inc
CONSUMER DURABLES - Recreational Goods, Other
|
$67.76
|
-0.89
-1.30% |
$68.76
|
738,119
92.45% of 50 DAV
50 DAV is 798,400
|
$70.07
-3.30%
|
11/26/2010
|
$69.10
|
PP = $70.17
|
|
MB = $73.68
|
Most Recent Note - 11/26/2010 1:29:07 PM
Y - Color code is changed to yellow after an advanced "3-weeks tight" pattern has formed following a considerable rally from its prior base. Disciplined investors will resist the temptation to get in "early" while watching for a convincing breakout and a follow through day from at least one of the major averages (M criteria) as critical reassurances before new (or add-on) buying efforts are justified under the investment system guidelines. An upward trendline connecting its July-October lows defines support to watch above its 50 DMA line.
>>> The latest Featured Stock Update with an annotated graph appeared on 11/29/2010. Click here.
View all notes |
Alert me of new notes |
CANSLIM.net Company Profile |
SEC |
Zacks Reports |
StockTalk |
News |
Chart |
Request a new note
C
A N
S L
I M
|
HMSY
-
NASDAQ
H M S Holdings Corp
COMPUTER SOFTWARE and SERVICES - Healthcare Information Service
|
$63.12
|
-0.56
-0.88% |
$63.21
|
71,306
33.49% of 50 DAV
50 DAV is 212,900
|
$64.09
-1.51%
|
11/19/2010
|
$61.89
|
PP = $63.01
|
|
MB = $66.16
|
Most Recent Note - 11/29/2010 5:17:28 PM
Y - Volume totals have been light as it traded above its pivot point for a new 52-week high last week and now consolidates near prior highs. Volume did not meet the guideline to trigger a proper new (or add-on) technical buy signal. Its 50 DMA line defines important support to watch.
>>> The latest Featured Stock Update with an annotated graph appeared on 11/19/2010. Click here.
View all notes |
Alert me of new notes |
CANSLIM.net Company Profile |
SEC |
Zacks Reports |
StockTalk |
News |
Chart |
Request a new note
C
A N
S L
I M
|
HS
-
NYSE
Healthspring Inc
HEALTH SERVICES - Health Care Plans
|
$27.13
|
-0.49
-1.77% |
$27.36
|
410,379
59.87% of 50 DAV
50 DAV is 685,500
|
$29.80
-8.96%
|
8/27/2010
|
$19.91
|
PP = $19.75
|
|
MB = $20.74
|
Most Recent Note - 11/29/2010 1:12:23 PM
G - Small gap down today for a loss, trading below its 50 DMA line for the first time since August. More damaging losses would raise concerns and trigger a technical sell signal.
>>> The latest Featured Stock Update with an annotated graph appeared on 10/22/2010. Click here.
View all notes |
Alert me of new notes |
CANSLIM.net Company Profile |
SEC |
Zacks Reports |
StockTalk |
News |
Chart |
Request a new note
C
A N
S L
I M
|
IGTE
-
NASDAQ
Igate Corp
COMPUTER SOFTWARE and SERVICES - Information Technology Service
|
$24.83
|
+0.12
0.49% |
$24.99
|
519,952
74.52% of 50 DAV
50 DAV is 697,700
|
$24.90
-0.28%
|
10/26/2010
|
$17.29
|
PP = $19.55
|
|
MB = $20.53
|
Most Recent Note - 11/26/2010 1:00:02 PM
G - Posted a 6th consecutive gain today with below average volume for a new 52-week high. Extended from its latest base, its prior chart highs in the $19 area define initial chart support above its 50 DMA line.
>>> The latest Featured Stock Update with an annotated graph appeared on 11/11/2010. Click here.
View all notes |
Alert me of new notes |
CANSLIM.net Company Profile |
SEC |
Zacks Reports |
StockTalk |
News |
Chart |
Request a new note
C
A N
S L
I M
|
JOBS
-
NASDAQ
Fifty One Job Inc Ads
DIVERSIFIED SERVICES - Staffing and; Outsourcing Service
|
$50.62
|
+0.12
0.24% |
$51.00
|
72,582
32.67% of 50 DAV
50 DAV is 222,200
|
$51.84
-2.35%
|
10/13/2010
|
$42.07
|
PP = $40.60
|
|
MB = $42.63
|
Most Recent Note - 11/24/2010 4:08:42 PM
G - Posted a 6th consecutive gain today with near average volume while hitting and closing at new 52-week highs. Its 50 DMA line defines important support to watch.
>>> The latest Featured Stock Update with an annotated graph appeared on 11/16/2010. Click here.
View all notes |
Alert me of new notes |
CANSLIM.net Company Profile |
SEC |
Zacks Reports |
StockTalk |
News |
Chart |
Request a new note
C
A N
S L
I M
|
Symbol/Exchange
Company Name
Industry Group |
PRICE |
CHANGE
(%Change) |
Day High |
Volume
(% DAV)
(% 50 day avg vol) |
52 Wk Hi
% From Hi |
Featured
Date |
Price
Featured |
Pivot Featured |
|
Max Buy |
LFT
-
NYSE
Longtop Financl Tech Ads
COMPUTER SOFTWARE and SERVICES - Business Software and Services
|
$39.65
|
-0.39
-0.97% |
$40.58
|
450,581
82.00% of 50 DAV
50 DAV is 549,500
|
$42.86
-7.49%
|
11/5/2010
|
$41.83
|
PP = $40.96
|
|
MB = $43.01
|
Most Recent Note - 11/29/2010 5:21:18 PM
Y - Perched -7.5% off its all-time high today. Its latest slump below its pivot point raised concerns again, yet volume totals have been cooling while consolidating above support near its 50 DMA line.
>>> The latest Featured Stock Update with an annotated graph appeared on 10/14/2010. Click here.
View all notes |
Alert me of new notes |
CANSLIM.net Company Profile |
SEC |
Zacks Reports |
StockTalk |
News |
Chart |
Request a new note
C
A N
S L
I M
|
LULU
-
NASDAQ
Lululemon Athletica
MANUFACTURING - Textile Manufacturing
|
$53.58
|
-0.03
-0.06% |
$54.18
|
717,011
66.90% of 50 DAV
50 DAV is 1,071,700
|
$54.77
-2.17%
|
10/8/2010
|
$47.66
|
PP = $46.67
|
|
MB = $49.00
|
Most Recent Note - 11/24/2010 4:14:03 PM
G - It is extended from its prior base after 7 consecutive gains. Prior highs in the $46-48 area define chart support to watch along with its 50 DMA line.
>>> The latest Featured Stock Update with an annotated graph appeared on 10/8/2010. Click here.
View all notes |
Alert me of new notes |
CANSLIM.net Company Profile |
SEC |
Zacks Reports |
StockTalk |
News |
Chart |
Request a new note
C
A N
S L
I M
|
MWIV
-
NASDAQ
M W I Veterinary Supply
HEALTH SERVICES - Medical Instruments and; Supplies
|
$61.07
|
+0.07
0.11% |
$61.81
|
34,723
60.39% of 50 DAV
50 DAV is 57,500
|
$63.94
-4.49%
|
11/4/2010
|
$61.79
|
PP = $59.60
|
|
MB = $62.58
|
Most Recent Note - 11/26/2010 1:15:36 PM
Y - Quiet gain on today's holiday-shortened session, finishing 2 cents under its best ever close. Its 50 DMA line has been repeatedly noted as a very important support level. It stalled after hitting its all-time high on 11/04/10, yet held its ground stubbornly above its short-term average.
>>> The latest Featured Stock Update with an annotated graph appeared on 11/2/2010. Click here.
View all notes |
Alert me of new notes |
CANSLIM.net Company Profile |
SEC |
Zacks Reports |
StockTalk |
News |
Chart |
Request a new note
C
A N
S L
I M
|
NEOG
-
NASDAQ
Neogen Corp
DRUGS - Diagnostic Substances
|
$37.54
|
+0.27
0.72% |
$37.72
|
36,200
43.10% of 50 DAV
50 DAV is 84,000
|
$37.97
-1.12%
|
9/1/2010
|
$30.79
|
PP = $30.49
|
|
MB = $32.01
|
Most Recent Note - 11/24/2010 4:00:05 PM
G - Rallied to a new all-time high with today's 5th consecutive gain on light volume. It is extended from any sound base, and its 50 DMA line recently has been a reliable support level.
>>> The latest Featured Stock Update with an annotated graph appeared on 10/13/2010. Click here.
View all notes |
Alert me of new notes |
CANSLIM.net Company Profile |
SEC |
Zacks Reports |
StockTalk |
News |
Chart |
Request a new note
C
A N
S L
I M
|
NFLX
-
NASDAQ
Netflix Inc
SPECIALTY RETAIL - Music and Video Stores
|
$198.92
|
+7.02
3.66% |
$200.00
|
7,034,612
122.64% of 50 DAV
50 DAV is 5,736,000
|
$192.48
3.35%
|
11/9/2010
|
$173.10
|
PP = $184.84
|
|
MB = $194.08
|
Most Recent Note - 11/29/2010 5:06:28 PM
G - Posted a solid gain today with +22% above average volume for a new all-time high beyond its "max buy" level, and its color code is changed to green. A follow-through day has not confirmed a new rally since recent concerns were raised about the M criteria.
>>> The latest Featured Stock Update with an annotated graph appeared on 11/24/2010. Click here.
View all notes |
Alert me of new notes |
CANSLIM.net Company Profile |
SEC |
Zacks Reports |
StockTalk |
News |
Chart |
Request a new note
C
A N
S L
I M
|
Symbol/Exchange
Company Name
Industry Group |
PRICE |
CHANGE
(%Change) |
Day High |
Volume
(% DAV)
(% 50 day avg vol) |
52 Wk Hi
% From Hi |
Featured
Date |
Price
Featured |
Pivot Featured |
|
Max Buy |
NTAP
-
NASDAQ
Netapp Inc
COMPUTER HARDWARE - Data Storage Devices
|
$50.93
|
-0.12
-0.24% |
$51.15
|
4,675,326
62.74% of 50 DAV
50 DAV is 7,451,800
|
$57.96
-12.13%
|
9/8/2010
|
$46.98
|
PP = $44.99
|
|
MB = $47.24
|
Most Recent Note - 11/26/2010 1:25:03 PM
G - Losses this week led to a slump below its 50 DMA line and prior highs. On 11/19/10 it was noted - "It has not formed a sound base, and the weakness suggests that it may be due for a longer and deeper consolidation."
>>> The latest Featured Stock Update with an annotated graph appeared on 11/3/2010. Click here.
View all notes |
Alert me of new notes |
CANSLIM.net Company Profile |
SEC |
Zacks Reports |
StockTalk |
News |
Chart |
Request a new note
C
A N
S L
I M
|
ORCL
-
NASDAQ
Oracle Corp
COMPUTER SOFTWARE and SERVICES - Application Software
|
$27.22
|
-0.27
-0.98% |
$27.34
|
32,605,017
85.03% of 50 DAV
50 DAV is 38,343,400
|
$29.82
-8.72%
|
9/20/2010
|
$27.32
|
PP = $26.73
|
|
MB = $28.07
|
Most Recent Note - 11/26/2010 1:22:47 PM
G- Color code was changed to green after it sank below its DMA line and under the latest chart low, raising concerns. Gains above its short-term average are needed for its outlook to improve.
>>> The latest Featured Stock Update with an annotated graph appeared on 11/18/2010. Click here.
View all notes |
Alert me of new notes |
CANSLIM.net Company Profile |
SEC |
Zacks Reports |
StockTalk |
News |
Chart |
Request a new note
C
A N
S L
I M
|
PAY
-
NYSE
Verifone Systems Inc
COMPUTER HARDWARE - Transaction Automation Systems
|
$34.26
|
-0.44
-1.27% |
$34.80
|
870,729
63.16% of 50 DAV
50 DAV is 1,378,600
|
$35.94
-4.67%
|
11/29/2010
|
$33.96
|
PP = $36.04
|
|
MB = $37.84
|
Most Recent Note - 11/29/2010 1:21:25 PM
Y - Volume totals have cooled after rallying near its 52-week high recently. Color code is changed to yellow with new pivot point cited based on its 52-week high plus ten cents. A subsequent breakout could trigger a new (or add-on) technical buy signal, meanwhile patience and discipline are paramount. As previously noted, it has formed an advanced "ascending base" pattern after an impressive rally from its 7/26/10 breakout.
>>> The latest Featured Stock Update with an annotated graph appeared on 10/25/2010. Click here.
View all notes |
Alert me of new notes |
CANSLIM.net Company Profile |
SEC |
Zacks Reports |
StockTalk |
News |
Chart |
Request a new note
C
A N
S L
I M
|
RAX
-
NYSE
Rackspace Hosting Inc
INTERNET - Internet Software and; Services
|
$28.85
|
+0.36
1.26% |
$28.40
|
938,816
35.16% of 50 DAV
50 DAV is 2,670,400
|
$29.35
-1.70%
|
9/21/2010
|
$22.84
|
PP = $23.61
|
|
MB = $24.79
|
Most Recent Note - 11/24/2010 3:48:05 PM
G - Perched -3% away from its all-time high with no resistance remaining due to overhead supply, but it is extended from any sound base.
>>> The latest Featured Stock Update with an annotated graph appeared on 11/17/2010. Click here.
View all notes |
Alert me of new notes |
CANSLIM.net Company Profile |
SEC |
Zacks Reports |
StockTalk |
News |
Chart |
Request a new note
C
A N
S L
I M
|
ROVI
-
NASDAQ
Rovi Corp
COMPUTER SOFTWARE andamp; SERVICES - Security Software andamp; Services
|
$54.37
|
-0.53
-0.97% |
$54.88
|
491,914
32.30% of 50 DAV
50 DAV is 1,523,100
|
$55.25
-1.59%
|
10/29/2010
|
$49.99
|
PP = $53.10
|
|
MB = $55.76
|
Most Recent Note - 11/26/2010 1:36:06 PM
Y - Finished the holiday-shortened week at its best close of 2010 after posting small gains without great volume conviction. Confirming gains on heavy volume coupled with a follow-through day from at least one of the major market averages (M criteria) could trigger new (or add-on) technical buy signals. Meanwhile, its 50 DMA line defines important support to watch.
>>> The latest Featured Stock Update with an annotated graph appeared on 10/20/2010. Click here.
View all notes |
Alert me of new notes |
CANSLIM.net Company Profile |
SEC |
Zacks Reports |
StockTalk |
News |
Chart |
Request a new note
C
A N
S L
I M
|
Symbol/Exchange
Company Name
Industry Group |
PRICE |
CHANGE
(%Change) |
Day High |
Volume
(% DAV)
(% 50 day avg vol) |
52 Wk Hi
% From Hi |
Featured
Date |
Price
Featured |
Pivot Featured |
|
Max Buy |
SHOO
-
NASDAQ
Steven Madden Limited
CONSUMER NON-DURABLES - Textile - Apparel Footwear
|
$46.42
|
+1.46
3.25% |
$46.33
|
701,028
199.50% of 50 DAV
50 DAV is 351,400
|
$45.92
1.09%
|
11/23/2010
|
$44.61
|
PP = $44.95
|
|
MB = $47.20
|
Most Recent Note - 11/29/2010 12:48:58 PM
Y - Hit a new 2010 high today, trading above the new pivot point recently cited with above average volume. No resistance remains due to overhead supply, but the questionable M criteria is an overriding concern impacting new buying efforts until a follow-through day occurs.
>>> The latest Featured Stock Update with an annotated graph appeared on 11/23/2010. Click here.
View all notes |
Alert me of new notes |
CANSLIM.net Company Profile |
SEC |
Zacks Reports |
StockTalk |
News |
Chart |
Request a new note
C
A N
S L
I M
|
SLW
-
NYSE
Silver Wheaton Corp
METALS and; MINING - Silver
|
$35.83
|
+0.68
1.93% |
$35.42
|
9,237,992
97.67% of 50 DAV
50 DAV is 9,458,500
|
$37.20
-3.68%
|
8/25/2010
|
$21.40
|
PP = $21.99
|
|
MB = $23.09
|
Most Recent Note - 11/29/2010 5:12:20 PM
G - Gain today with average volume for its second-best close ever. Recent low ($30.52 on 11/16/10) defines initial support above its 50 DMA line.
>>> The latest Featured Stock Update with an annotated graph appeared on 10/18/2010. Click here.
View all notes |
Alert me of new notes |
CANSLIM.net Company Profile |
SEC |
Zacks Reports |
StockTalk |
News |
Chart |
Request a new note
C
A N
S L
I M
|
UA
-
NYSE
Under Armour Inc Cl A
CONSUMER NON-DURABLES - Textile - Apparel Clothing
|
$56.03
|
-0.47
-0.83% |
$56.46
|
979,473
132.54% of 50 DAV
50 DAV is 739,000
|
$57.22
-2.08%
|
9/9/2010
|
$39.99
|
PP = $40.10
|
|
MB = $42.11
|
Most Recent Note - 11/29/2010 12:58:18 PM
G - Paused after 7 consecutive gains for new 52-week highs, the high-ranked Apparel - Clothing firm is very extended from any sound base and well above support at its 50 DMA line.
>>> The latest Featured Stock Update with an annotated graph appeared on 11/4/2010. Click here.
View all notes |
Alert me of new notes |
CANSLIM.net Company Profile |
SEC |
Zacks Reports |
StockTalk |
News |
Chart |
Request a new note
C
A N
S L
I M
|
ULTA
-
NASDAQ
Ulta Salon Cosm & Frag
SPECIALTY RETAIL - Specialty Retail, Other
|
$35.15
|
+0.16
0.46% |
$35.55
|
702,936
157.19% of 50 DAV
50 DAV is 447,200
|
$35.05
0.29%
|
9/3/2010
|
$26.36
|
PP = $25.89
|
|
MB = $27.18
|
Most Recent Note - 11/26/2010 1:30:42 PM
G - Today's 4th consecutive gain helped it hit a new 52-week high, approaching its all-time high of $35.63 from Nov '07. Meanwhile, its 50 DMA line defines initial support to watch.
>>> The latest Featured Stock Update with an annotated graph appeared on 11/1/2010. Click here.
View all notes |
Alert me of new notes |
CANSLIM.net Company Profile |
SEC |
Zacks Reports |
StockTalk |
News |
Chart |
Request a new note
C
A N
S L
I M
|
VIT
-
NYSE
Vanceinfo Tech Inc Ads
COMPUTER SOFTWARE and SERVICES - Business Software and Services
|
$37.48
|
-0.02
-0.05% |
$37.80
|
838,313
127.83% of 50 DAV
50 DAV is 655,800
|
$38.43
-2.47%
|
7/8/2010
|
$25.20
|
PP = $26.58
|
|
MB = $27.91
|
Most Recent Note - 11/26/2010 1:34:12 PM
G - Completed a Public Offering this week and it is perched near all-time highs. It 50 DMA line has acted as support recently, but it has not formed a sound base.
>>> The latest Featured Stock Update with an annotated graph appeared on 10/21/2010. Click here.
View all notes |
Alert me of new notes |
CANSLIM.net Company Profile |
SEC |
Zacks Reports |
StockTalk |
News |
Chart |
Request a new note
C
A N
S L
I M
|
Symbol/Exchange
Company Name
Industry Group |
PRICE |
CHANGE
(%Change) |
Day High |
Volume
(% DAV)
(% 50 day avg vol) |
52 Wk Hi
% From Hi |
Featured
Date |
Price
Featured |
Pivot Featured |
|
Max Buy |