You are not logged in.
This means you
CAN ONLY VIEW reports that were published prior to Monday, April 14, 2025.
You
MUST UPGRADE YOUR MEMBERSHIP if you want to see any current reports.
AFTER MARKET UPDATE - WEDNESDAY, NOVEMBER 28TH, 2012
Previous After Market Report Next After Market Report >>>
|
|
|
|
DOW |
+106.98 |
12,985.11 |
+0.83% |
|
Volume |
711,932,040 |
+3% |
|
Volume |
1,659,090,900 |
-2% |
|
NASDAQ |
+23.99 |
2,991.78 |
+0.81% |
|
Advancers |
2,070 |
66% |
|
Advancers |
1,505 |
59% |
|
S&P 500 |
+10.99 |
1,409.93 |
+0.79% |
|
Decliners |
929 |
30% |
|
Decliners |
946 |
37% |
|
Russell 2000 |
+5.76 |
813.50 |
+0.71% |
|
52 Wk Highs |
92 |
|
|
52 Wk Highs |
36 |
|
|
S&P 600 |
+2.77 |
458.52 |
+0.61% |
|
52 Wk Lows |
25 |
|
|
52 Wk Lows |
34 |
|
|
 |
Major Averages Managed Impressive Positive Reversal
Kenneth J. Gruneisen - Passed the CAN SLIM® Master's Exam
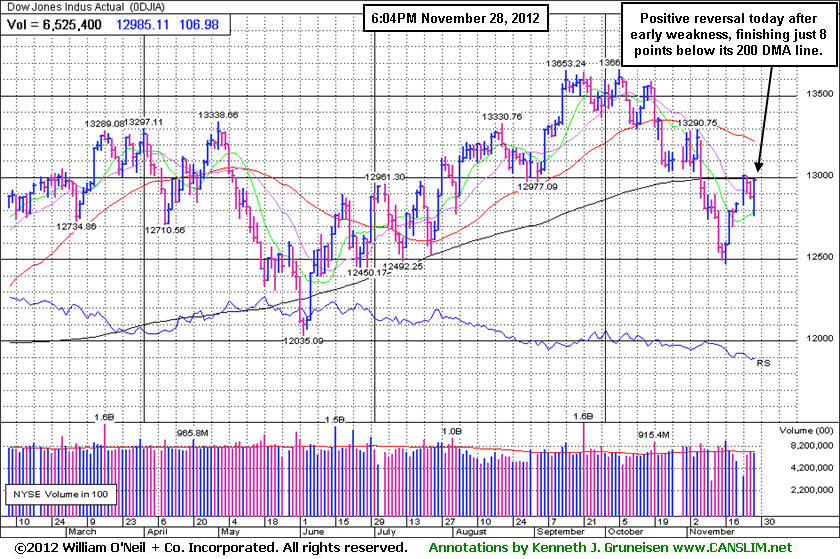
The major averages managed what is technically termed an impressive "positive reversal" after early weakness on Wednesday, finishing strong while the Nasdaq Composite Index rallied for a solid gain above its 200-day moving average (DMA) line. Volume totals were reported mixed, higher than the prior session total on the NYSE but slightly lower on the Nasdaq exchange. The bias was clearly more positive on the NYSE as advancers led decliners by a 2-1 margin, and advancers led decliners by a 3-2 margin on the Nasdaq exchange. The total number of stocks hitting new 52-week highs outnumbered new 52-week lows on both the NYSE and the Nasdaq exchange. Any sustainable rally requires a healthy crop of companies hitting new 52-week highs, so it was somewhat discouraging that leadership contracted. There were only 33 high-ranked companies from the CANSLIM.net Leaders List making new 52-week highs and appearing on the CANSLIM.net BreakOuts Page, down from the prior session total of 50 stocks. There were gains for 6 of the 11 high-ranked companies currently included on the Featured Stocks Page.
The market found motivation to rally back Wednesday’s session in positive territory after House Speaker John Boehner expressed optimism in avoiding the fiscal cliff. Stocks added to their gains following comments by President Obama that he hopes to reach a deal by Christmas. On the economic front, a report showed new home sales unexpectedly fell -0.3% in October. Meanwhile, the Fed's Beige Book survey suggested the economy grew moderately in recent weeks.
All ten sectors in the S&P 500 index were higher led by consumer stocks. Costco Wholesale Corp (COST +6.29%) surged after the retailer said it plans to pay a special dividend of $7 a share. Green Mountain Coffee Roasters Inc (GMCR +27.32%) rallied after the company raised its quarterly forecast. Energy stocks also outperformed with Dow component Chevron Corp (CVX +2.13%) advancing . Shares of miner Cliff Natural Resources Inc (CLF -1.33%) fell as commodities retreated.
The market direction (M criteria) has shifted to a "confirmed uptrend" following Friday's gain of +1.4% by the Nasdaq Composite Index. The gain was recognized as a "follow-through day" on Day 5 of the rally attempt while writers for the newspaper stated that it was sufficient that the abbreviated session's volume was running at a higher pace. New buying efforts may now be justified in worthy high-ranked leaders as a result of last week's constructive gains coupled with healthy leadership and a respectable number of stocks hitting new 52-week highs. See the noteworthy companies included on the Featured Stocks Page.
Watch for an announcement via email concerning the next WEBCAST. The webcast will also be available via an updated link highlighted at the top of the Premium Member Homepage.
PICTURED: The Dow Jones Industrial Average managed a positive reversal today after early weakness, finishing just 8 points below its 200-day moving average (DMA) line.
|
 Kenneth J. Gruneisen started out as a licensed stockbroker in August 1987, a couple of months prior to the historic stock market crash that took the Dow Jones Industrial Average down -22.6% in a single day. He has published daily fact-based fundamental and technical analysis on high-ranked stocks online for two decades. Through FACTBASEDINVESTING.COM, Kenneth provides educational articles, news, market commentary, and other information regarding proven investment systems that work in good times and bad.
Comments contained in the body of this report are technical opinions only and are not necessarily those of Gruneisen Growth Corp. The material herein has been obtained from sources believed to be reliable and accurate, however, its accuracy and completeness cannot be guaranteed. Our firm, employees, and customers may effect transactions, including transactions contrary to any recommendation herein, or have positions in the securities mentioned herein or options with respect thereto. Any recommendation contained in this report may not be suitable for all investors and it is not to be deemed an offer or solicitation on our part with respect to the purchase or sale of any securities. |
|
 |
Retail, Financial, Tech, and Energy Groups Rose
Kenneth J. Gruneisen - Passed the CAN SLIM® Master's Exam
The Retail Index ($RLX +1.39%) and financial shares were positive influences on the major indices on Wednesday's mostly positive session. The Broker/Dealer Index ($XBD +1.98%) outpaced the Bank Index ($BKX +0.33%). Energy-related shares had a positive bias as the Integrated Oil Index ($XOI +1.14%) and Oil Services Index ($OSX +0.48%) surged higher. The tech sector also rallied as the Networking Index ($NWX +0.93%), Semiconductor Index ($SOX +1.09%), and the Internet Index ($IIX +1.14%) posted solid gains, meanwhile the Biotechnology Index ($BTK +0.29%) lagged and the Healthcare Index ($HMO -0.22%) edged lower.
Charts courtesy www.stockcharts.com
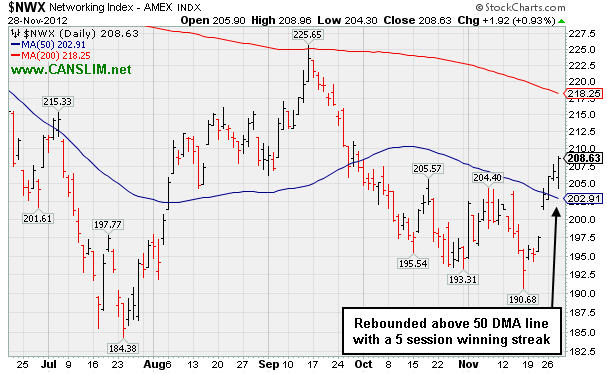
PICTURED: The Networking Index ($NWX +0.93%) has rebounded above its 50-day moving average (DMA) line with a streak of 5 consecutive gains.
| Oil Services |
$OSX |
215.59 |
+1.02 |
+0.48% |
-0.32% |
| Healthcare |
$HMO |
2,443.61 |
-5.28 |
-0.22% |
+7.10% |
| Integrated Oil |
$XOI |
1,215.74 |
+13.74 |
+1.14% |
-1.09% |
| Semiconductor |
$SOX |
373.83 |
+4.02 |
+1.09% |
+2.58% |
| Networking |
$NWX |
208.63 |
+1.92 |
+0.93% |
-3.03% |
| Internet |
$IIX |
318.37 |
+3.59 |
+1.14% |
+13.00% |
| Broker/Dealer |
$XBD |
86.78 |
+1.68 |
+1.98% |
+4.22% |
| Retail |
$RLX |
675.53 |
+9.25 |
+1.39% |
+29.12% |
| Gold & Silver |
$XAU |
171.39 |
+1.19 |
+0.70% |
-5.12% |
| Bank |
$BKX |
48.50 |
+0.16 |
+0.33% |
+23.16% |
| Biotech |
$BTK |
1,520.20 |
+4.39 |
+0.29% |
+39.28% |
|
|
|
 |
Deteriorating Fundamentals and Technical Action
Kenneth J. Gruneisen - Passed the CAN SLIM® Master's Exam
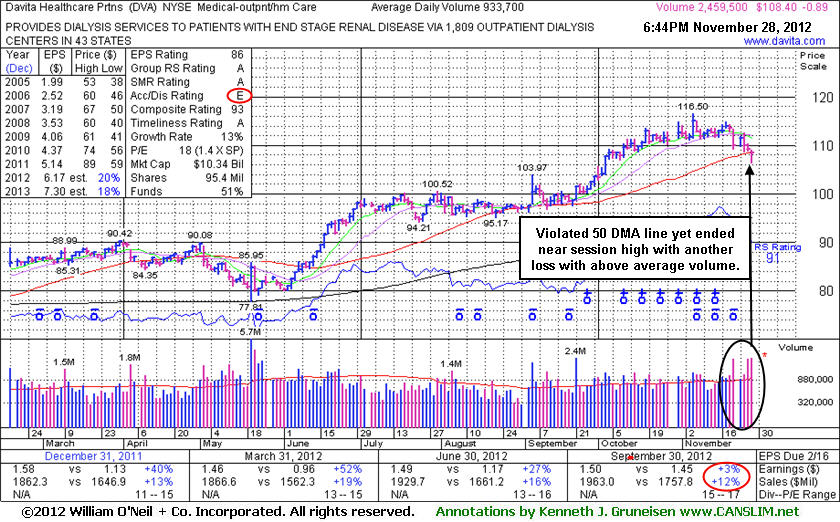
Davita Inc (DVA -$0.89 or -0.81% to $108.40) finished -7% off its 52-week high today. Technical concerns were raised while slumping below its 50-day moving average (DMA) line with above average volume behind today's 3rd consecutive loss. It will be dropped from the Featured Stocks list tonight. Fundamental concerns were recently noted after it reported earnings +3% on +12% sales for the Sep '12 quarter, below the guidelines of the fact-based system.
It has shown steady annual earnings (A criteria) growth. Ownership by top-rated funds rose from 959 in Jun '12 to 975 in Sep '12, a slightly reassuring sign concerning the I criteria. However, the Medical - Outpatient/Home Care firm has seen its Accumulation/Distribution Rating slump to a E from a B- since 11/08/12 when it made its last appearance in this FSU section under the headline, "Weak Earnings Increase Raises Concern After 7 Weekly Gains", as it was then noted - "Disciplined investors might be inclined to give it the benefit of the doubt until technical sell signals argue more seriously for exiting, however, keep in mind that the M criteria argues in favor of protecting profits and reducing market exposure when the major averages are in a serious correction."
The broader market action (M criteria) has improved while returning to a confirmed uptrend as noted in the Market Commentary this week. This individual issue may find prompt support near its short-term average and eventually rally higher. However, disciplined investors know that they typically have more favorable odds by buying fresh breakouts rather than bargain hunting and going after slumping stocks showing weaker earnings. Since first featured at $102.92 in the 9/05/12 mid-day report the stock had shown mostly bullish action and traded as much as +13.2% higher before the current slump.
|
|
|
Color Codes Explained :
Y - Better candidates highlighted by our
staff of experts.
G - Previously featured
in past reports as yellow but may no longer be buyable under the
guidelines.
***Last / Change / Volume data in this table is the closing quote data***
Symbol/Exchange
Company Name
Industry Group |
PRICE |
CHANGE
(%Change) |
Day High |
Volume
(% DAV)
(% 50 day avg vol) |
52 Wk Hi
% From Hi |
Featured
Date |
Price
Featured |
Pivot Featured |
|
Max Buy |
CFNL
-
NASDAQ
Cardinal Financial Corp
BANKING - Regional - Southeast Banks
|
$15.02
|
-0.05
-0.33% |
$15.10
|
464,724
279.62% of 50 DAV
50 DAV is 166,200
|
$16.21
-7.34%
|
8/17/2012
|
$12.84
|
PP = $13.31
|
|
MB = $13.98
|
 Most Recent Note - 11/28/2012 12:39:30 PM
G - Enduring more distributional pressure this week, consolidating near prior highs and its 50 DMA line defining near-term chart support where violations may trigger technical sell signals.
>>> The latest Featured Stock Update with an annotated graph appeared on 11/20/2012. Click here.
View all notes |
Alert me of new notes |
CANSLIM.net Company Profile |
SEC |
Zacks Reports |
StockTalk |
News |
Chart |
Request a new note
C
A N
S L
I M


|
CMCSA
-
NASDAQ
Comcast Corp Cl A
MEDIA - CATV Systems
|
$36.66
|
+0.37
1.02% |
$36.71
|
13,273,844
106.78% of 50 DAV
50 DAV is 12,431,600
|
$37.96
-3.42%
|
6/11/2012
|
$29.94
|
PP = $30.98
|
|
MB = $32.53
|
Most Recent Note - 11/26/2012 5:51:11 PM
G - Consolidating above its 50 DMA line, however its latest consolidation is too brief to be considered a sound new base pattern.
>>> The latest Featured Stock Update with an annotated graph appeared on 11/19/2012. Click here.
View all notes |
Alert me of new notes |
CANSLIM.net Company Profile |
SEC |
Zacks Reports |
StockTalk |
News |
Chart |
Request a new note
C
A N
S L
I M
|
DVA
-
NYSE
Davita Healthcare Prtns
HEALTH SERVICES - Specialized Health Services
|
$108.40
|
-0.89
-0.81% |
$109.04
|
2,460,387
263.51% of 50 DAV
50 DAV is 933,700
|
$116.50
-6.95%
|
9/5/2012
|
$102.92
|
PP = $100.62
|
|
MB = $105.65
|
Most Recent Note - 11/28/2012 6:54:48 PM
Technical concerns were raised while slumping below its 50 DMA line with above average volume behind today's 3rd consecutive loss. Fundamental concerns were raised after it reported earnings +3% on +12% sales for the Sep '12 quarter, below the guidelines of the fact-based system. It will be dropped from the Featured Stocks list tonight. See the latest FSU analysis for more details and a new annotated graph.
>>> The latest Featured Stock Update with an annotated graph appeared on 11/28/2012. Click here.
View all notes |
Alert me of new notes |
CANSLIM.net Company Profile |
SEC |
Zacks Reports |
StockTalk |
News |
Chart |
Request a new note
C
A N
S L
I M
|
GPX
-
NYSE
G P Strategies Corp
DIVERSIFIED SERVICES - Education and Training Services
|
$20.38
|
-0.03
-0.15% |
$20.48
|
37,270
62.53% of 50 DAV
50 DAV is 59,600
|
$21.44
-4.94%
|
10/8/2012
|
$20.00
|
PP = $20.77
|
|
MB = $21.81
|
Most Recent Note - 11/27/2012 11:18:41 AM
G - Still holding its ground stubbornly with volume totals cooling while hovering near its 52-week high. Earnings +0% on +12% sales revenues for the Sep '12 quarter, below the +25% minimum earnings guideline (C criteria) raised fundamental concerns. Deterioration leading to a close below its old high close ($20.27 on 8/17/12) would negate the recent technical breakout, and a violation of its 50 DMA line would be a more worrisome sell signal.
>>> The latest Featured Stock Update with an annotated graph appeared on 11/15/2012. Click here.
View all notes |
Alert me of new notes |
CANSLIM.net Company Profile |
SEC |
Zacks Reports |
StockTalk |
News |
Chart |
Request a new note
C
A N
S L
I M
|
LKQ
-
NASDAQ
L K Q Corp
WHOLESALE - Auto Parts
|
$21.76
|
+0.26
1.21% |
$21.86
|
2,441,608
127.91% of 50 DAV
50 DAV is 1,908,900
|
$22.29
-2.36%
|
8/9/2012
|
$18.97
|
PP = $18.72
|
|
MB = $19.66
|
Most Recent Note - 11/27/2012 12:13:09 PM
G - Holding its ground near its 52-week high today following a worrisome "negative reversal" and finish near the session low with a loss on above average volume. Results below the +25% minimum earnings guideline (C criteria) for Sep '12 recently raised fundamental concerns.
>>> The latest Featured Stock Update with an annotated graph appeared on 11/14/2012. Click here.
View all notes |
Alert me of new notes |
CANSLIM.net Company Profile |
SEC |
Zacks Reports |
StockTalk |
News |
Chart |
Request a new note
C
A N
S L
I M
|
Symbol/Exchange
Company Name
Industry Group |
PRICE |
CHANGE
(%Change) |
Day High |
Volume
(% DAV)
(% 50 day avg vol) |
52 Wk Hi
% From Hi |
Featured
Date |
Price
Featured |
Pivot Featured |
|
Max Buy |
MIDD
-
NASDAQ
Middleby Corp
MANUFACTURING - Diversified Machinery
|
$126.52
|
-1.21
-0.95% |
$128.56
|
81,429
114.37% of 50 DAV
50 DAV is 71,200
|
$128.96
-1.89%
|
10/8/2012
|
$118.46
|
PP = $122.67
|
|
MB = $128.80
|
Most Recent Note - 11/26/2012 5:55:09 PM
Y - Consolidating in a tight trading range near its all-time high. Recently reported earnings +23% on +18% sales for the Sep '12 quarter, below the +25% minimum earnings guideline (C criteria), raising fundamental concerns.
>>> The latest Featured Stock Update with an annotated graph appeared on 11/16/2012. Click here.
View all notes |
Alert me of new notes |
CANSLIM.net Company Profile |
SEC |
Zacks Reports |
StockTalk |
News |
Chart |
Request a new note
C
A N
S L
I M
|
RAX
-
NYSE
Rackspace Hosting Inc
INTERNET - Internet Software and; Services
|
$68.44
|
+2.48
3.76% |
$68.73
|
2,178,338
133.78% of 50 DAV
50 DAV is 1,628,300
|
$69.81
-1.96%
|
11/26/2012
|
$66.26
|
PP = $67.18
|
|
MB = $70.54
|
Most Recent Note - 11/28/2012 5:14:49 PM
Y - Today's gain above its pivot point with +34% above average volume was below the bare minimum guideline for volume necessary to trigger a proper technical buy signal. Confirming gains with volume would be a welcome reassurance, and disciplined investors may be wise to use a tactic called "pyramiding" to allow the market action to dictate their weighting in new buys while always limiting losses by selling if any stock ever falls more than -7% from their purchase price. See latest FSU analysis for more details and a new annotated graph.
>>> The latest Featured Stock Update with an annotated graph appeared on 11/27/2012. Click here.
View all notes |
Alert me of new notes |
CANSLIM.net Company Profile |
SEC |
Zacks Reports |
StockTalk |
News |
Chart |
Request a new note
C
A N
S L
I M
|
RGR
-
NYSE
Sturm Ruger & Co Inc
CONSUMER DURABLES - Sporting Goods
|
$58.45
|
+1.46
2.56% |
$59.44
|
876,828
199.69% of 50 DAV
50 DAV is 439,100
|
$58.42
0.05%
|
11/20/2012
|
$52.23
|
PP = $52.65
|
|
MB = $55.28
|
Most Recent Note - 11/28/2012 5:17:09 PM
G - Hit a new 52-week high with today's 7th consecutive volume-driven gain. Color code was changed to green after getting extended from its previously noted base. Prior highs near $52 define initial chart support to watch where violations may trigger technical sell signals.
>>> The latest Featured Stock Update with an annotated graph appeared on 11/21/2012. Click here.
View all notes |
Alert me of new notes |
CANSLIM.net Company Profile |
SEC |
Zacks Reports |
StockTalk |
News |
Chart |
Request a new note
C
A N
S L
I M
|
RNF
-
NYSE
Rentech Nitrogen Ptnr Lp
CHEMICALS - Agricultural Chemicals
|
$39.62
|
+0.97
2.51% |
$39.74
|
309,006
78.37% of 50 DAV
50 DAV is 394,300
|
$41.15
-3.72%
|
11/1/2012
|
$39.11
|
PP = $40.15
|
|
MB = $42.16
|
Most Recent Note - 11/28/2012 5:21:02 PM
Y - It has tallied 4 consecutive gains with below average volume, recently indicating lackluster buying demand from the institutional crowd. Disciplined investors may watch for volume-driven gains for a new high close to trigger a technical buy signal.
>>> The latest Featured Stock Update with an annotated graph appeared on 11/26/2012. Click here.
View all notes |
Alert me of new notes |
CANSLIM.net Company Profile |
SEC |
Zacks Reports |
StockTalk |
News |
Chart |
Request a new note
C
A N
S L
I M
|
VSI
-
NYSE
Vitamin Shoppe Inc
SPECIALTY RETAIL - Specialty Retail, Other
|
$60.04
|
+1.48
2.53% |
$60.13
|
149,863
60.11% of 50 DAV
50 DAV is 249,300
|
$61.89
-2.99%
|
10/15/2012
|
$57.82
|
PP = $60.08
|
|
MB = $63.08
|
Most Recent Note - 11/23/2012 3:43:35 PM
Y -Posted a gain today with light volume for its 3rd best close. The $61 area has been a stubborn resistance level in recent months. It released better than expected earnings +35% on +14% sales revenues for the Sep '12 quarter.
>>> The latest Featured Stock Update with an annotated graph appeared on 11/12/2012. Click here.
View all notes |
Alert me of new notes |
CANSLIM.net Company Profile |
SEC |
Zacks Reports |
StockTalk |
News |
Chart |
Request a new note
C
A N
S L
I M
|
Symbol/Exchange
Company Name
Industry Group |
PRICE |
CHANGE
(%Change) |
Day High |
Volume
(% DAV)
(% 50 day avg vol) |
52 Wk Hi
% From Hi |
Featured
Date |
Price
Featured |
Pivot Featured |
|
Max Buy |
WPI
-
NYSE
Watson Pharmaceuticals
DRUGS - Drugs - Generic
|
$87.11
|
-0.42
-0.48% |
$87.30
|
687,930
86.76% of 50 DAV
50 DAV is 792,900
|
$90.00
-3.21%
|
8/24/2012
|
$82.90
|
PP = $81.10
|
|
MB = $85.16
|
Most Recent Note - 11/23/2012 3:44:41 PM
G - Wedged above its 50 DMA line today. See the latest FSU analysis for more details and a new annotated graph.
>>> The latest Featured Stock Update with an annotated graph appeared on 11/23/2012. Click here.
View all notes |
Alert me of new notes |
CANSLIM.net Company Profile |
SEC |
Zacks Reports |
StockTalk |
News |
Chart |
Request a new note
C
A N
S L
I M
|
|
|
|
THESE ARE NOT BUY RECOMMENDATIONS!
Comments contained in the body of this report are technical
opinions only. The material herein has been obtained
from sources believed to be reliable and accurate, however,
its accuracy and completeness cannot be guaranteed.
This site is not an investment advisor, hence it does
not endorse or recommend any securities or other investments.
Any recommendation contained in this report may not
be suitable for all investors and it is not to be deemed
an offer or solicitation on our part with respect to
the purchase or sale of any securities. All trademarks,
service marks and trade names appearing in this report
are the property of their respective owners, and are
likewise used for identification purposes only.
This report is a service available
only to active Paid Premium Members.
You may opt-out of receiving report notifications
at any time. Questions or comments may be submitted
by writing to Premium Membership Services 665 S.E. 10 Street, Suite 201 Deerfield Beach, FL 33441-5634 or by calling 1-800-965-8307
or 954-785-1121.
|
|
|

