Help Lines 954-785-1121


You are not logged in. Upgrade Here
 <<<Previous Mid Day Report     Next Mid Day Report >>> 
 <<<Previous After Market Report Next After Market Report >>> 
You are not logged in.
This means you CAN ONLY VIEW reports that were published prior to Monday, February 26, 2024.
You MUST UPGRADE YOUR MEMBERSHIP if you want to see any current reports.

AFTER MARKET UPDATE - WEDNESDAY, NOVEMBER 27TH, 2019
Previous After Market Report Next After Market Report >>>
Indices NYSE Nasdaq
DOW  +42.32 28,164.00 +0.15% Volume 724,463,680 -54% Volume 1,710,127,757 -29%
NASDAQ +57.25 8,705.18 +0.66% Advancers 1,795 62% Advancers 2,031 66%
S&P 500 +13.11 3,153.63 +0.42% Decliners 1,091 38% Decliners 1,031 34%
Russell 2000 +9.87 1,634.10 +0.61% 52 Wk Highs 162   52 Wk Highs 225  
S&P 600 +4.42 999.99 +0.44% 52 Wk Lows 23   52 Wk Lows 50  

Major Indices Post Modest Gains With Lighter Volume Totals

The Dow added 42 points while the S&P 500 gained 0.4%. The Nasdaq Composite advanced 0.7%. Advancers led decliners by a 9-5 margin on the NYSE and nearly 2-1 on the Nasdaq exchange. Volume totals reported were lighter than the prior session on both major exchanges, indicative of lackluster institutional buying demand. Leadership improved as there were 82 high-ranked companies from the Leaders List that hit a new 52-week high and were listed on the BreakOuts Page, versus the total of 77 on the prior session. New 52-week highs outnumbered new 52-week lows on the NYSE and on the Nasdaq exchange. The major indices (M criteria) are in a "confirmed uptrend" after enduring distributional pressure in recent weeks. The Featured Stocks Page provides the most timely analysis on high-ranked leaders.

Charts used courtesy of www.stockcharts.com

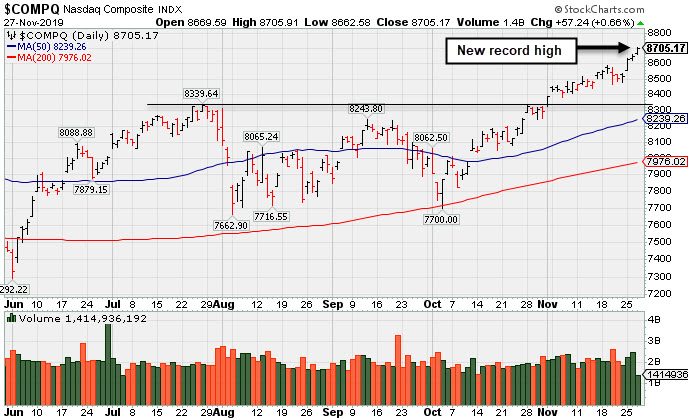
PICTURED: The Nasdaq Composite Index rallied for a new record high with a 4th consecutive gain. 

U.S. stocks finished higher Wednesday as stronger than anticipated economic updates helped propel equity benchmark indexes to a fourth consecutive record finish. The data docket was highlighted by the first revision to third-quarter GDP, which showed that the U.S. economy expanded at an annualized 2.1% pace, higher than the initial reading of 1.9%. 

A separate updated revealed U.S. durable goods orders unexpectedly rose 0.6% in October. The core PCE deflator, the Fed’s preferred proxy for inflation, ticked down to 1.6% in October, just below expectations of a 1.7% rise. An additional survey showed pending home sales declined 1.7% month-over-month in October, worse than the prior month’s downwardly revised 1.4% reading. Treasuries were weaker, with the yield on the benchmark 10-year note adding two basis points to 1.76%.

Ten of 11 S&P 500 sectors finished in positive territory with the Consumer Discretionary group pacing the gains. Communication Services stocks also outperformed as shares of Facebook (FB +
1.53%) rose. Industrials lagged the broader market advance, with Deere & Co. (DE -4.30%) fell as weak forward guidance overshadowed a top and bottom line beat. In other earnings, Autodesk (ADSK +5.49%) rallied to a new all-time high after topping sales and profit estimates. H P Inc. (HPQ -1.35%) fell despite reporting its first uptick in revenue in six quarters. In commodities, WTI crude fell 0.5% to $58.11/barrel while COMEX gold slipped 0.4% to $1453.90/ounce.

Kenneth J. Gruneisen started out as a licensed stockbroker in August 1987, a couple of months prior to the historic stock market crash that took the Dow Jones Industrial Average down -22.6% in a single day. He has published daily fact-based fundamental and technical analysis on high-ranked stocks online for two decades. Through FACTBASEDINVESTING.COM, Kenneth provides educational articles, news, market commentary, and other information regarding proven investment systems that work in good times and bad.

Comments contained in the body of this report are technical opinions only and are not necessarily those of Gruneisen Growth Corp. The material herein has been obtained from sources believed to be reliable and accurate, however, its accuracy and completeness cannot be guaranteed. Our firm, employees, and customers may effect transactions, including transactions contrary to any recommendation herein, or have positions in the securities mentioned herein or options with respect thereto. Any recommendation contained in this report may not be suitable for all investors and it is not to be deemed an offer or solicitation on our part with respect to the purchase or sale of any securities.


Tech, Retail, Finaancial, and Oil Services Indexes Rose

The Retail Index ($RLX +0.83%), Broker/Dealer Index ($XBD +0.65%), and Bank Index ($BKX +0.65%) posted unanimous gains on Wednesday. The tech sector had a positive bias as the Biotech Index ($BTK +1.16%) set a strong pace and the Semiconductor Index ($SOX +0.73%) and Networking Index ($NWX +0.27%) each ended the session with a smaller gain. Commodity-linked ground were mixed, with the Oil Services Index ($OSX +2.04%) posting a standout gain as the Integrated Oil Index ($XOI +0.14%) inched higher, meanwhile, the Gold & Silver Index ($XAU -0.85%) was a standout decliner on the session.
Charts courtesy of www.stockcharts.com

PICTURED: The Biotech Index ($BTK +1.16%) is rebounding toward its 2019 high.

Industry Index Symbol Close Change % Change YTD % Change
Oil Services $OSX  68.87 +1.38 +2.04% -14.55%
Integrated Oil $XOI  1,214.56 +1.65 +0.14% +4.79%
Semiconductor $SOX  1,735.91 +12.65 +0.73% +50.27%
Networking $NWX  578.18 +1.55 +0.27% +18.32%
Broker/Dealer $XBD  289.97 +1.86 +0.65% +22.18%
Retail $RLX  2,422.44 +19.83 +0.83% +24.14%
Gold & Silver $XAU  93.93 -0.81 -0.85% +32.93%
Bank $BKX  110.13 +0.71 +0.65% +28.37%
Biotech $BTK  5,012.99 +57.61 +1.16% +18.77%


Holding Ground Stubbornly Near All-Time High

N M I Holdings Inc Cl A (NMIH +$0.48 or +1.43% to $34.06) posted a 5th consecutive small gain with below average volume. Volume totals have generally been cooling while holding its ground stubbornly after rising above its "max buy" level with gains backed by above average volume. 

NMIH reported earnings +54% on +42% sales revenues for the Sep '19 quarter, and prior quarterly comparisons were also well above the +25% minimum guideline (C criteria). After years of losses it had profitable years for FY '16, '17, and '18.

The Finance -  Mortgage & Related Services firm was highlighted in yellow with pivot point cited based on its 6/10/19 high plus 10 cents in the 11/08/19 mid-day report (read here). Technically, it had broken out on the prior session with a gain backed by +273% above average volume hitting a new all-time high. It was shown with an annotated graph under the headline, "Hit New High With Volume-Driven Gains". 

The number of top-rated funds owning an interest rose from 388 in Dec '18 to 457 in Sep '19, a reassuring sign concerning the I criteria. The current Up/Down Volume ratio of 1.2 is as unbiased indication its shares have been under accumulation over the past 50 days. It has a Timelines Rating of A and Sponsorship Rating of D.
Charts courtesy of www.stockcharts.com
X

Color Codes Explained :
Y - Better candidates highlighted by our staff of experts.
G - Previously featured in past reports as yellow but may no longer be buyable under the guidelines.

***Last / Change / Volume data in this table is the closing quote data***
Symbol/Exchange
Company Name
Industry Group
PRICE CHANGE
(%Change)
Day High Volume
(% DAV)
(% 50 day avg vol)
52 Wk Hi
% From Hi
Featured
Date
Price
Featured
Pivot Featured
Max Buy
StockCharts.com Latest Chart for MLR MLR - NYSE
Miller Industries Inc
AUTOMOTIVE - Auto Parts  
$36.87 +0.05
0.14%

$37.18

23,096
50.21% of 50 DAV
50 DAV is 46,000
$37.70
-2.20%
9/24/2019 $34.00 PP = $35.36
MB = $37.13
Most Recent Note - 11/26/2019 5:13:53 PM
Y - Perched near its 52-week high. Prior highs in the $35 area define initial support above its 50 DMA line ($34.20). Showed resilience after recently reporting earnings which were below the fundamental guidelines of the fact-based investment system.

>>> FEATURED STOCK ARTICLE : Showing Resilience After Latest Quarter Missed Minimum Guidelines - 11/15/2019
 |  View all notes | Set NEW NOTE alert | Company Profile | SEC News | Chart | Request a new note C A  S  I 
StockCharts.com Latest Chart for CCBG CCBG - NASDAQ
Capital City Bk Gp
BANKING - Regional - Mid-Atlantic Banks  
$29.23 +0.35
1.21%

$29.50

34,438
80.09% of 50 DAV
50 DAV is 43,000
$30.85
-5.25%
9/13/2019 $27.03 PP = $27.05
MB = $28.40
Most Recent Note - 11/26/2019 5:09:49 PM
G - Endured distributional pressure with a loss today on heavier volume. Still extended from the prior base. Prior highs define important support to watch along with its 50 DMA line ($28.12).
>>> FEATURED STOCK ARTICLE : Consolidating After Volume-Driven Gains for New Highs - 11/19/2019
 |  View all notes | Set NEW NOTE alert | Company Profile | SEC News | Chart | Request a new note C A  S  I 
StockCharts.com Latest Chart for FTNT FTNT - NASDAQ
Fortinet Inc
Computer Sftwr-Security  
$105.23 +0.86
0.82%

$105.27

650,697
46.58% of 50 DAV
50 DAV is 1,397,000
$106.00
-0.73%
11/11/2019 $97.14 PP = $97.06
MB = $101.91
Most Recent Note - 11/25/2019 6:21:00 PM
G - Extended from any sound base and it posted a gain today with light volume for a best-ever close. Prior high in the $97 area defines initial support to watch on pullbacks.
>>> FEATURED STOCK ARTICLE : Reversed Into Red Today After Touching New High - 11/11/2019
 |  View all notes | Set NEW NOTE alert | Company Profile | SEC News | Chart | Request a new note C A  S  I 
StockCharts.com Latest Chart for AUDC AUDC - NASDAQ
Audiocodes Ltd
ELECTRONICS - Scientific and Technical Instrum  
$24.00 +0.55
2.35%

$24.04

265,730
92.59% of 50 DAV
50 DAV is 287,000
$24.35
-1.44%
9/13/2019 $19.68 PP = $19.84
MB = $20.83
Most Recent Note - 11/27/2019 5:23:55 PM
G - Closed one cent off its best ever close with today's 3rd consecutive gain. Prior highs in the $22 area define initial support above Its 50 DMA line ($20.40). Fundamentals remain strong.
>>> FEATURED STOCK ARTICLE : Volume Totals Cooling After Gains for New Highs - 11/22/2019
 |  View all notes | Set NEW NOTE alert | Company Profile | SEC News | Chart | Request a new note C A  S  I 
StockCharts.com Latest Chart for CHDN CHDN - NASDAQ
Churchill Downs Inc
LEISURE - Gaming Activities  
$132.39 +1.35
1.03%

$134.22

355,251
118.42% of 50 DAV
50 DAV is 300,000
$135.32
-2.17%
10/8/2019 $129.77 PP = $132.83
MB = $139.47
Most Recent Note - 11/25/2019 6:14:00 PM
G - Rallied near its 52-week high with today's 2nd consecutive volume-driven gain. Its 50 DMA line ($127) defines near-term support above the prior low ($121.81 on 11/07/19) The Jun and Sep '19 quarterly earnings versus the year ago periods were both below the +25% minimum guideline (C criteria) and raised fundamental concerns.
>>> FEATURED STOCK ARTICLE : Resilience Shown Despite Another Sub Par Earnings Report - 11/18/2019
 |  View all notes | Set NEW NOTE alert | Company Profile | SEC News | Chart | Request a new note C A  S  I 
Symbol/Exchange
Company Name
Industry Group
PRICE CHANGE
(%Change)
Day High Volume
(% DAV)
(% 50 day avg vol)
52 Wk Hi
% From Hi
Featured
Date
Price
Featured
Pivot Featured
Max Buy
StockCharts.com Latest Chart for LULU LULU - NASDAQ
Lululemon Athletica
MANUFACTURING - Textile Manufacturing  
$228.83 +5.99
2.69%

$229.65

1,761,762
109.63% of 50 DAV
50 DAV is 1,607,000
$226.66
0.96%
9/6/2019 $201.25 PP = $194.35
MB = $204.07
Most Recent Note - 11/27/2019 5:25:48 PM
G - Extended from any sound base and it hit another new all-time high with today's 4th consecutive gain. Its 50 DMA line ($203.40) defines important near-term support. See the latest FSU analysis for more details and an annotated graph.
>>> FEATURED STOCK ARTICLE : New High Close Stretches Already Extended Leader - 11/26/2019
 |  View all notes | Set NEW NOTE alert | Company Profile | SEC News | Chart | Request a new note C A  S  I 
StockCharts.com Latest Chart for CPRT CPRT - NASDAQ
Copart Inc
SPECIALTY RETAIL - Auto Dealerships  
$90.23 -0.57
-0.63%

$91.22

1,490,285
91.43% of 50 DAV
50 DAV is 1,630,000
$92.41
-2.36%
9/5/2019 $79.13 PP = $79.84
MB = $83.83
Most Recent Note - 11/25/2019 12:41:49 PM
G - Hitting another new all-time high with today's 3rd consecutive volume-driven gain, getting extended from any sound base. Reported earnings +38% on +20% sales revenues for the Oct '19 quarter, continuing its strong earnings track record. The 50 DMA line ($82.70) defines near-term support above the prior low ($80.71 on 11/06/19).
>>> FEATURED STOCK ARTICLE : Gapped Up Following Another Strong Earnings Report - 11/21/2019
 |  View all notes | Set NEW NOTE alert | Company Profile | SEC News | Chart | Request a new note C A  S  I 
StockCharts.com Latest Chart for NMIH NMIH - NASDAQ
N M I Holdings Inc Cl A
Finance-MrtgandRel Svc  
$34.06 +0.48
1.43%

$34.06

254,223
58.71% of 50 DAV
50 DAV is 433,000
$34.50
-1.28%
11/8/2019 $32.89 PP = $31.44
MB = $33.01
Most Recent Note - 11/27/2019 5:16:28 PM
G - Posted a 5th consecutive small gain with below average volume. Volume totals have been cooling while holding its ground stubbornly after rising above its "max buy" level with gains backed by above average volume. See the latest FSU analysis for more details and a new annotated graph.
>>> FEATURED STOCK ARTICLE : Holding Ground Stubbornly Near All-Time High - 11/27/2019
 |  View all notes | Set NEW NOTE alert | Company Profile | SEC News | Chart | Request a new note C A  S  I 
StockCharts.com Latest Chart for SPLK SPLK - NASDAQ
Splunk Inc
Computer Sftwr-Database  
$151.00 +3.48
2.36%

$151.26

2,100,729
110.27% of 50 DAV
50 DAV is 1,905,000
$149.70
0.87%
11/25/2019 $147.79 PP = $142.16
MB = $149.27
Most Recent Note - 11/27/2019 5:21:44 PM
G - Color code is changed to green after rallying above its "max buy" level. Prior highs in the $142-143 area define initial support to watch on pullbacks.
>>> FEATURED STOCK ARTICLE : Spurt of Volume-Driven Gains Reaches New All-Time High - 11/25/2019
 |  View all notes | Set NEW NOTE alert | Company Profile | SEC News | Chart | Request a new note C A  S  I 
StockCharts.com Latest Chart for PAYC PAYC - NYSE
Paycom Software Inc
COMPUTER SOFTWARE and SERVICES - Application Software  
$279.66 +5.56
2.03%

$279.95

485,581
80.39% of 50 DAV
50 DAV is 604,000
$275.33
1.57%
11/20/2019 $252.97 PP = $259.81
MB = $272.80
Most Recent Note - 11/27/2019 5:19:24 PM
G - Today's 14th consecutive gain leaves it extended from the prior base. Prior high ($259) defines initial support to watch on pullbacks. It reported earnings +35% on +31% sales revenues for the Sep '19 quarter.
>>> FEATURED STOCK ARTICLE : Powerful Gain for New High Backed by Heavy Volume - 11/20/2019
 |  View all notes | Set NEW NOTE alert | Company Profile | SEC News | Chart | Request a new note C A  S  I 
Symbol/Exchange
Company Name
Industry Group
PRICE CHANGE
(%Change)
Day High Volume
(% DAV)
(% 50 day avg vol)
52 Wk Hi
% From Hi
Featured
Date
Price
Featured
Pivot Featured
Max Buy
StockCharts.com Latest Chart for BLD BLD - NYSE
Topbuild Corp
Bldg-Constr Prds/Misc  
$112.26 +0.05
0.04%

$113.74

217,452
77.11% of 50 DAV
50 DAV is 282,000
$112.71
-0.40%
5/17/2019 $82.19 PP = $87.31
MB = $91.68
Most Recent Note - 11/25/2019 6:18:53 PM
G - Extended from any sound base. Touched a new high today but erased most of its early gain. Reported earnings +24% on +5% sales revenues for the Sep '19 quarter versus the year ago period, just below the +25% minimum guideline (C criteria). Its 50 DMA line ($101) acted as support during its ongoing ascent.
>>> FEATURED STOCK ARTICLE : Perched Near High Following Recent Volume-Driven Gains - 11/12/2019
 |  View all notes | Set NEW NOTE alert | Company Profile | SEC News | Chart | Request a new note C A  S  I 
StockCharts.com Latest Chart for GLOB GLOB - NYSE
Globant SA
Computer-Tech Services  
$107.79 -0.04
-0.04%

$108.73

343,502
131.11% of 50 DAV
50 DAV is 262,000
$112.33
-4.04%
11/14/2019 $106.87 PP = $112.43
MB = $118.05
Most Recent Note - 11/26/2019 12:57:17 PM
Y - Color code is changed to yellow while rebounding impressively with 6 consecutive gains after finding prompt support near its 50 DMA line ($96.12). Pulled back abruptly after it reported earnings +35% on +27% sales revenues for the Sep '19 quarter.
>>> FEATURED STOCK ARTICLE : Rallying Near High With 12th Consecutive Gain - 11/14/2019
 |  View all notes | Set NEW NOTE alert | Company Profile | SEC News | Chart | Request a new note C A  S  I 

THESE ARE NOT BUY RECOMMENDATIONS!  Comments contained in the body of this report are technical opinions only. The material herein has been obtained from sources believed to be reliable and accurate, however, its accuracy and completeness cannot be guaranteed. This site is not an investment advisor, hence it does not endorse or recommend any securities or other investments. Any recommendation contained in this report may not be suitable for all investors and it is not to be deemed an offer or solicitation on our part with respect to the purchase or sale of any securities. All trademarks, service marks and trade names appearing in this report are the property of their respective owners, and are likewise used for identification purposes only.

This report is a service available only to active Paid Premium Members. You may opt-out of receiving report notifications at any time.  Questions or comments may be submitted by writing to Premium Membership Services 665 S.E. 10 Street, Suite 201 Deerfield Beach, FL 33441-5634 or by calling 1-800-965-8307 or 954-785-1121.

Kenneth J. Gruneisen founded Gruneisen Growth Corp. (2003), which prior to May 11, 2015, operated CANSLIM.net and CANSLIM.com both under license from Data Analysis Inc. / Investor's Business Daily. Kenneth has passed the CAN SLIM® Master's Exam. Gruneisen Growth Corp. now continues over two decades of fact based market analysis via FactBasedInvesting.com.

Copyright © 1996-2024 Gruneisen Growth Corp. All rights reserved. Protected by the copyright laws of the United States and Canada and by international treaties

Privacy Policy | Terms of Use | Contact Us