***Last / Change / Volume data in this table is the closing quote data***
Symbol/Exchange
Company Name
Industry Group |
PRICE |
CHANGE
(%Change) |
Day High |
Volume
(% DAV)
(% 50 day avg vol) |
52 Wk Hi
% From Hi |
Featured
Date |
Price
Featured |
Pivot Featured |
|
Max Buy |
ABV
-
NYSE
Comp De Bebidas Adr
FOOD and BEVERAGE - Beverages - Brewers
|
$139.15
|
-2.09
-1.48% |
$141.67
|
257,626
39.57% of 50 DAV
50 DAV is 651,000
|
$145.36
-4.27%
|
11/4/2010
|
$142.35
|
PP = $143.63
|
|
MB = $150.81
|
 Most Recent Note - 11/26/2010 1:11:02 PM
Y - Consolidating near all-time highs with volume totals cooling in recent weeks. Confirming gains to new highs on heavy volume would be a reassuring sign of institutional demand. Meanwhile, recent lows defines support near its 50 DMA line.
>>> The latest Featured Stock Update with an annotated graph appeared on 10/11/2010. Click here.
View all notes |
Alert me of new notes |
CANSLIM.net Company Profile |
SEC |
Zacks Reports |
StockTalk |
News |
Chart |
Request a new note
C
A N
S L
I M


|
ARUN
-
NASDAQ
Aruba Networks Inc
COMPUTER HARDWARE - Networking andamp; Communication Dev
|
$23.94
|
+0.12
0.51% |
$24.18
|
1,226,952
48.72% of 50 DAV
50 DAV is 2,518,400
|
$24.28
-1.40%
|
8/30/2010
|
$18.12
|
PP = $18.51
|
|
MB = $19.44
|
Most Recent Note - 11/26/2010 1:18:20 PM
G - Gains on this holiday-shortened week helped it rise above its 2007 peak to a new all-time high. Its 50 DMA line and an upward trendline connecting May - November lows define support to watch.
>>> The latest Featured Stock Update with an annotated graph appeared on 10/26/2010. Click here.
View all notes |
Alert me of new notes |
CANSLIM.net Company Profile |
SEC |
Zacks Reports |
StockTalk |
News |
Chart |
Request a new note
C
A N
S L
I M
|
BIDU
-
NASDAQ
Baidu Inc Ads
INTERNET - Internet Information Providers
|
$109.37
|
+0.37
0.34% |
$109.66
|
4,495,267
36.36% of 50 DAV
50 DAV is 12,363,000
|
$115.04
-4.93%
|
9/17/2010
|
$85.73
|
PP = $88.42
|
|
MB = $92.84
|
Most Recent Note - 11/26/2010 1:21:35 PM
G - Volume totals have been cooling while consolidating above its 50 DMA line. A violation of its short-term average or recent chart lows would raise concerns and trigger technical sell signals. BIDU has been noted as a riskier "late stage" candidate after ongoing coverage, yet it could go on to produce more climactic gains.
>>> The latest Featured Stock Update with an annotated graph appeared on 10/7/2010. Click here.
View all notes |
Alert me of new notes |
CANSLIM.net Company Profile |
SEC |
Zacks Reports |
StockTalk |
News |
Chart |
Request a new note
C
A N
S L
I M
|
CACC
-
NASDAQ
Credit Acceptance Corp
FINANCIAL SERVICES - Credit Services
|
$61.15
|
-0.15
-0.24% |
$61.30
|
3,723
14.95% of 50 DAV
50 DAV is 24,900
|
$63.45
-3.62%
|
11/22/2010
|
$59.97
|
PP = $62.00
|
|
MB = $65.10
|
Most Recent Note - 11/24/2010 4:18:54 PM
Y - Climbed further above its 50 DMA line today with a 6th consecutive gain, leaving it perched only -3.7% off its 52-week high. Currently building on a "double bottom" type base pattern, its 11/16/10 low ($54.12) defines initial support above its 200 DMA line.
>>> The latest Featured Stock Update with an annotated graph appeared on 10/29/2010. Click here.
View all notes |
Alert me of new notes |
CANSLIM.net Company Profile |
SEC |
Zacks Reports |
StockTalk |
News |
Chart |
Request a new note
C
A N
S L
I M
|
CIS
-
NYSE
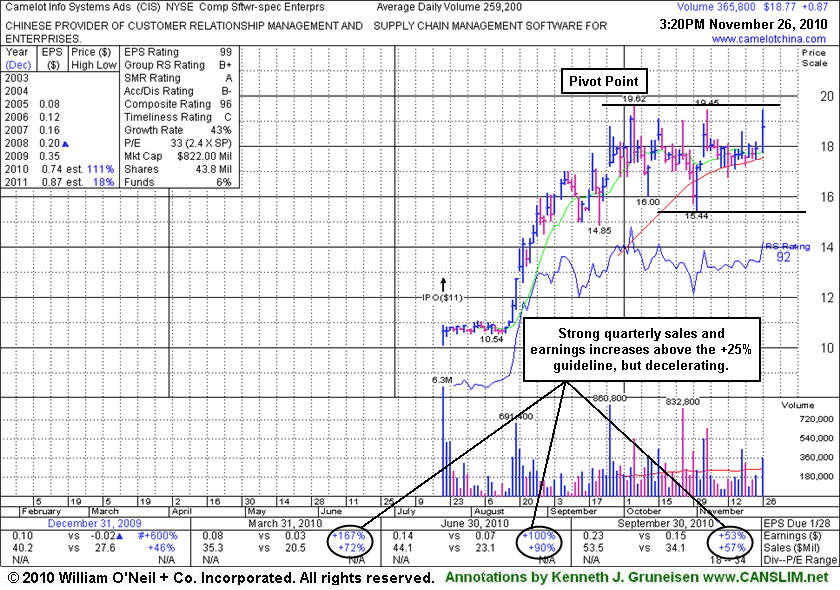
Camelot Info Systems Ads
COMPUTER SOFTWARE andamp; SERVICES - Information Technology Service
|
$18.77
|
+0.87
4.86% |
$19.45
|
365,755
141.11% of 50 DAV
50 DAV is 259,200
|
$19.62
-4.33%
|
11/26/2010
|
$18.93
|
PP = $19.72
|
|
MB = $20.71
|
Most Recent Note - 11/26/2010 11:06:48 AM
Y - This Chinese Computer Software firm's gain today has it nearly challenging its 52-week high after a choppy 8-week base during which it found prompt support after a 50 DMA violation. Color code is changed to yellow with pivot point cited base on its 52-week high plus ten cents. Sales and earnings history appears to be very strong, and it has earned high ranks. Disciplined investors will resist the temptation to get in "early" while watching for a convincing breakout and a follow through day from at least one of the major averages (M criteria) as critical reassurances before new buying efforts are justified under the investment system guidelines.
>>> The latest Featured Stock Update with an annotated graph appeared on 11/26/2010. Click here.
View all notes |
Alert me of new notes |
CANSLIM.net Company Profile |
SEC |
Zacks Reports |
StockTalk |
News |
Chart |
Request a new note
C
A N
S L
I M
|
Symbol/Exchange
Company Name
Industry Group |
PRICE |
CHANGE
(%Change) |
Day High |
Volume
(% DAV)
(% 50 day avg vol) |
52 Wk Hi
% From Hi |
Featured
Date |
Price
Featured |
Pivot Featured |
|
Max Buy |
CMG
-
NYSE
Chipotle Mexican Grill
LEISURE - Restaurants
|
$255.65
|
+5.46
2.18% |
$256.49
|
784,018
92.09% of 50 DAV
50 DAV is 851,400
|
$250.51
2.05%
|
9/1/2010
|
$158.31
|
PP = $155.52
|
|
MB = $163.30
|
Most Recent Note - 11/26/2010 11:08:06 AM
G - Gain for a 5th consecutive session today and yet another new all-time high. It is extended from any sound base pattern. Its 50 DMA line (now $201) defines the nearest chart support level.
>>> The latest Featured Stock Update with an annotated graph appeared on 10/28/2010. Click here.
View all notes |
Alert me of new notes |
CANSLIM.net Company Profile |
SEC |
Zacks Reports |
StockTalk |
News |
Chart |
Request a new note
C
A N
S L
I M
|
CTRP
-
NASDAQ
Ctrip.Com Intl Ltd Adr
LEISURE - Resorts and Casinos
|
$47.08
|
-0.95
-1.98% |
$47.46
|
655,028
31.84% of 50 DAV
50 DAV is 2,057,200
|
$53.16
-11.44%
|
9/24/2010
|
$46.75
|
PP = $47.11
|
|
MB = $49.47
|
Most Recent Note - 11/26/2010 12:59:14 PM
G - Loss today has it finishing the week below its 50 DMA line after that short-term average acted as resistance. Gains lacked volume conviction after losses with above average volume raised concerns, and subsequent losses below its recent low ($45.05 on 11/16/10) would raise greater concerns.
>>> The latest Featured Stock Update with an annotated graph appeared on 11/22/2010. Click here.
View all notes |
Alert me of new notes |
CANSLIM.net Company Profile |
SEC |
Zacks Reports |
StockTalk |
News |
Chart |
Request a new note
C
A N
S L
I M
|
DECK
-
NASDAQ
Deckers Outdoor Corp
CONSUMER NON-DURABLES - Textile - Apparel Footwear
|
$72.59
|
+1.18
1.65% |
$72.59
|
707,222
56.70% of 50 DAV
50 DAV is 1,247,400
|
$71.47
1.57%
|
10/27/2010
|
$54.16
|
PP = $54.86
|
|
MB = $57.60
|
Most Recent Note - 11/26/2010 1:00:46 PM
G - Today's 7th consecutive gain marked yet another new all-time high. Extended from its latest sound base, its prior highs and its 50 DMA line define the nearest chart support.
>>> The latest Featured Stock Update with an annotated graph appeared on 10/27/2010. Click here.
View all notes |
Alert me of new notes |
CANSLIM.net Company Profile |
SEC |
Zacks Reports |
StockTalk |
News |
Chart |
Request a new note
C
A N
S L
I M
|
EZPW
-
NASDAQ
Ezcorp Inc Cl A
SPECIALTY RETAIL - Specialty Retail, Other
|
$25.90
|
+0.95
3.81% |
$26.14
|
279,345
93.99% of 50 DAV
50 DAV is 297,200
|
$25.65
0.97%
|
11/5/2010
|
$24.02
|
PP = $23.85
|
|
MB = $25.04
|
Most Recent Note - 11/26/2010 1:04:43 PM
G - Solid gain today for a new all-time high, and volume was an average day's total for this holiday-shortened trading session. Prior highs in the $22-23 area define chart support to watch above its 50 DMA line.
>>> The latest Featured Stock Update with an annotated graph appeared on 11/6/2010. Click here.
View all notes |
Alert me of new notes |
CANSLIM.net Company Profile |
SEC |
Zacks Reports |
StockTalk |
News |
Chart |
Request a new note
C
A N
S L
I M
|
FFIV
-
NASDAQ
F 5 Networks Inc
INTERNET - Internet Software and Services
|
$135.04
|
+2.49
1.88% |
$135.23
|
1,225,451
43.25% of 50 DAV
50 DAV is 2,833,200
|
$133.70
1.00%
|
6/16/2010
|
$74.50
|
PP = $74.10
|
|
MB = $77.81
|
Most Recent Note - 11/26/2010 1:05:35 PM
G - Closed near the session high at a new all-time high. Extended from any sound base pattern. Prior highs in the $112 area define initial chart support.
>>> The latest Featured Stock Update with an annotated graph appeared on 11/15/2010. Click here.
View all notes |
Alert me of new notes |
CANSLIM.net Company Profile |
SEC |
Zacks Reports |
StockTalk |
News |
Chart |
Request a new note
C
A N
S L
I M
|
Symbol/Exchange
Company Name
Industry Group |
PRICE |
CHANGE
(%Change) |
Day High |
Volume
(% DAV)
(% 50 day avg vol) |
52 Wk Hi
% From Hi |
Featured
Date |
Price
Featured |
Pivot Featured |
|
Max Buy |
FOSL
-
NASDAQ
Fossil Inc
CONSUMER DURABLES - Recreational Goods, Other
|
$68.65
|
-0.24
-0.35% |
$69.75
|
344,985
43.21% of 50 DAV
50 DAV is 798,400
|
$70.07
-2.03%
|
11/26/2010
|
$69.10
|
PP = $70.17
|
|
MB = $73.68
|
Most Recent Note - 11/26/2010 1:29:07 PM
Y - Color code is changed to yellow after an advanced "3-weeks tight" pattern has formed following a considerable rally from its prior base. Disciplined investors will resist the temptation to get in "early" while watching for a convincing breakout and a follow through day from at least one of the major averages (M criteria) as critical reassurances before new (or add-on) buying efforts are justified under the investment system guidelines. An upward trendline connecting its July-October lows defines support to watch above its 50 DMA line.
>>> The latest Featured Stock Update with an annotated graph appeared on 10/5/2010. Click here.
View all notes |
Alert me of new notes |
CANSLIM.net Company Profile |
SEC |
Zacks Reports |
StockTalk |
News |
Chart |
Request a new note
C
A N
S L
I M
|
HMSY
-
NASDAQ
H M S Holdings Corp
COMPUTER SOFTWARE and SERVICES - Healthcare Information Service
|
$63.68
|
-0.35
-0.55% |
$64.00
|
28,903
13.58% of 50 DAV
50 DAV is 212,900
|
$64.09
-0.64%
|
11/19/2010
|
$61.89
|
PP = $63.01
|
|
MB = $66.16
|
Most Recent Note - 11/24/2010 4:06:15 PM
Y - No resistance remains due to overhead supply after today's gap up gain above its pivot point for a new 52-week high. Light volume behind its 5th consecutive gain was below the +50% above average volume minimum necessary to trigger a proper new (or add-on) technical buy signal. Its 50 DMA line defines important support to watch.
>>> The latest Featured Stock Update with an annotated graph appeared on 11/19/2010. Click here.
View all notes |
Alert me of new notes |
CANSLIM.net Company Profile |
SEC |
Zacks Reports |
StockTalk |
News |
Chart |
Request a new note
C
A N
S L
I M
|
HS
-
NYSE
Healthspring Inc
HEALTH SERVICES - Health Care Plans
|
$27.62
|
-0.08
-0.29% |
$28.01
|
159,406
23.25% of 50 DAV
50 DAV is 685,500
|
$29.80
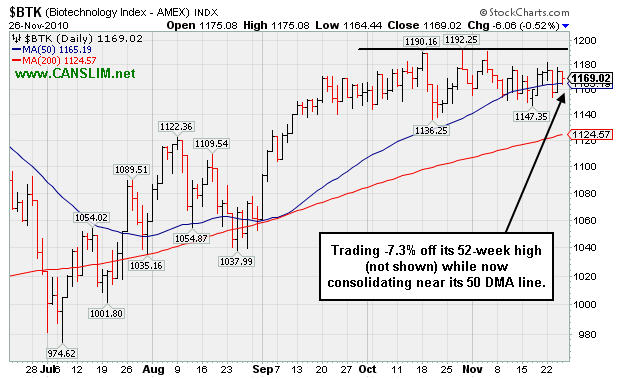
-7.32%
|
8/27/2010
|
$19.91
|
PP = $19.75
|
|
MB = $20.74
|
Most Recent Note - 11/24/2010 4:06:44 PM
G - Hovering -7% off its 52-week high, and volume totals are still cooling while consolidating above its 50 DMA line which acted as support.
>>> The latest Featured Stock Update with an annotated graph appeared on 10/22/2010. Click here.
View all notes |
Alert me of new notes |
CANSLIM.net Company Profile |
SEC |
Zacks Reports |
StockTalk |
News |
Chart |
Request a new note
C
A N
S L
I M
|
IGTE
-
NASDAQ
Igate Corp
COMPUTER SOFTWARE and SERVICES - Information Technology Service
|
$24.86
|
+0.55
2.26% |
$24.90
|
228,773
32.79% of 50 DAV
50 DAV is 697,700
|
$24.44
1.72%
|
10/26/2010
|
$17.29
|
PP = $19.55
|
|
MB = $20.53
|
Most Recent Note - 11/26/2010 1:00:02 PM
G - Posted a 6th consecutive gain today with below average volume for a new 52-week high. Extended from its latest base, its prior chart highs in the $19 area define initial chart support above its 50 DMA line.
>>> The latest Featured Stock Update with an annotated graph appeared on 11/11/2010. Click here.
View all notes |
Alert me of new notes |
CANSLIM.net Company Profile |
SEC |
Zacks Reports |
StockTalk |
News |
Chart |
Request a new note
C
A N
S L
I M
|
JOBS
-
NASDAQ
Fifty One Job Inc Ads
DIVERSIFIED SERVICES - Staffing and; Outsourcing Service
|
$50.50
|
-0.51
-1.00% |
$50.80
|
54,146
24.37% of 50 DAV
50 DAV is 222,200
|
$51.84
-2.58%
|
10/13/2010
|
$42.07
|
PP = $40.60
|
|
MB = $42.63
|
Most Recent Note - 11/24/2010 4:08:42 PM
G - Posted a 6th consecutive gain today with near average volume while hitting and closing at new 52-week highs. Its 50 DMA line defines important support to watch.
>>> The latest Featured Stock Update with an annotated graph appeared on 11/16/2010. Click here.
View all notes |
Alert me of new notes |
CANSLIM.net Company Profile |
SEC |
Zacks Reports |
StockTalk |
News |
Chart |
Request a new note
C
A N
S L
I M
|
Symbol/Exchange
Company Name
Industry Group |
PRICE |
CHANGE
(%Change) |
Day High |
Volume
(% DAV)
(% 50 day avg vol) |
52 Wk Hi
% From Hi |
Featured
Date |
Price
Featured |
Pivot Featured |
|
Max Buy |
LFT
-
NYSE
Longtop Financl Tech Ads
COMPUTER SOFTWARE and SERVICES - Business Software and Services
|
$40.04
|
-1.09
-2.65% |
$41.30
|
134,089
24.40% of 50 DAV
50 DAV is 549,500
|
$42.86
-6.58%
|
11/5/2010
|
$41.83
|
PP = $40.96
|
|
MB = $43.01
|
Most Recent Note - 11/24/2010 4:12:44 PM
Y - Perched only -4.5% off its all-time high after a small gap up gain today. Volume totals have been cooling while consolidating above support near its 50 DMA line.
>>> The latest Featured Stock Update with an annotated graph appeared on 10/14/2010. Click here.
View all notes |
Alert me of new notes |
CANSLIM.net Company Profile |
SEC |
Zacks Reports |
StockTalk |
News |
Chart |
Request a new note
C
A N
S L
I M
|
LULU
-
NASDAQ
Lululemon Athletica
MANUFACTURING - Textile Manufacturing
|
$53.61
|
-0.27
-0.50% |
$54.00
|
533,551
49.79% of 50 DAV
50 DAV is 1,071,700
|
$54.77
-2.12%
|
10/8/2010
|
$47.66
|
PP = $46.67
|
|
MB = $49.00
|
Most Recent Note - 11/24/2010 4:14:03 PM
G - It is extended from its prior base after 7 consecutive gains. Prior highs in the $46-48 area define chart support to watch along with its 50 DMA line.
>>> The latest Featured Stock Update with an annotated graph appeared on 10/8/2010. Click here.
View all notes |
Alert me of new notes |
CANSLIM.net Company Profile |
SEC |
Zacks Reports |
StockTalk |
News |
Chart |
Request a new note
C
A N
S L
I M
|
MWIV
-
NASDAQ
M W I Veterinary Supply
HEALTH SERVICES - Medical Instruments and; Supplies
|
$61.00
|
+0.03
0.05% |
$61.40
|
11,206
19.49% of 50 DAV
50 DAV is 57,500
|
$63.94
-4.60%
|
11/4/2010
|
$61.79
|
PP = $59.60
|
|
MB = $62.58
|
Most Recent Note - 11/26/2010 1:15:36 PM
Y - Quiet gain on today's holiday-shortened session, finishing 2 cents under its best ever close. Its 50 DMA line has been repeatedly noted as a very important support level. It stalled after hitting its all-time high on 11/04/10, yet held its ground stubbornly above its short-term average.
>>> The latest Featured Stock Update with an annotated graph appeared on 11/2/2010. Click here.
View all notes |
Alert me of new notes |
CANSLIM.net Company Profile |
SEC |
Zacks Reports |
StockTalk |
News |
Chart |
Request a new note
C
A N
S L
I M
|
NEOG
-
NASDAQ
Neogen Corp
DRUGS - Diagnostic Substances
|
$37.27
|
-0.31
-0.82% |
$37.97
|
12,121
14.43% of 50 DAV
50 DAV is 84,000
|
$37.72
-1.19%
|
9/1/2010
|
$30.79
|
PP = $30.49
|
|
MB = $32.01
|
Most Recent Note - 11/24/2010 4:00:05 PM
G - Rallied to a new all-time high with today's 5th consecutive gain on light volume. It is extended from any sound base, and its 50 DMA line recently has been a reliable support level.
>>> The latest Featured Stock Update with an annotated graph appeared on 10/13/2010. Click here.
View all notes |
Alert me of new notes |
CANSLIM.net Company Profile |
SEC |
Zacks Reports |
StockTalk |
News |
Chart |
Request a new note
C
A N
S L
I M
|
NFLX
-
NASDAQ
Netflix Inc
SPECIALTY RETAIL - Music and Video Stores
|
$191.90
|
+3.13
1.66% |
$192.48
|
3,037,763
52.96% of 50 DAV
50 DAV is 5,736,000
|
$192.10
-0.10%
|
11/9/2010
|
$173.10
|
PP = $184.84
|
|
MB = $194.08
|
Most Recent Note - 11/24/2010 4:28:46 PM
Y - Perched at all-time highs after a gap up gain with above average volume on 11/22/10. NFLX had been noted as a riskier "late stage" set-up, and the gap up gain amounted to a new (or add-on) technical buy signal. However, a follow-through day from at least one of the major averages is also needed as a confirmation of a new rally since recent concerns were raised about the M criteria.
>>> The latest Featured Stock Update with an annotated graph appeared on 11/24/2010. Click here.
View all notes |
Alert me of new notes |
CANSLIM.net Company Profile |
SEC |
Zacks Reports |
StockTalk |
News |
Chart |
Request a new note
C
A N
S L
I M
|
Symbol/Exchange
Company Name
Industry Group |
PRICE |
CHANGE
(%Change) |
Day High |
Volume
(% DAV)
(% 50 day avg vol) |
52 Wk Hi
% From Hi |
Featured
Date |
Price
Featured |
Pivot Featured |
|
Max Buy |
NTAP
-
NASDAQ
Netapp Inc
COMPUTER HARDWARE - Data Storage Devices
|
$51.05
|
-0.34
-0.66% |
$51.14
|
1,753,096
23.53% of 50 DAV
50 DAV is 7,451,800
|
$57.96
-11.92%
|
9/8/2010
|
$46.98
|
PP = $44.99
|
|
MB = $47.24
|
Most Recent Note - 11/26/2010 1:25:03 PM
G - Losses this week led to a slump below its 50 DMA line and prior highs. On 11/19/10 it was noted - "It has not formed a sound base, and the weakness suggests that it may be due for a longer and deeper consolidation."
>>> The latest Featured Stock Update with an annotated graph appeared on 11/3/2010. Click here.
View all notes |
Alert me of new notes |
CANSLIM.net Company Profile |
SEC |
Zacks Reports |
StockTalk |
News |
Chart |
Request a new note
C
A N
S L
I M
|
ORCL
-
NASDAQ
Oracle Corp
COMPUTER SOFTWARE and SERVICES - Application Software
|
$27.49
|
-0.25
-0.90% |
$27.62
|
12,882,952
33.60% of 50 DAV
50 DAV is 38,343,400
|
$29.82
-7.81%
|
9/20/2010
|
$27.32
|
PP = $26.73
|
|
MB = $28.07
|
Most Recent Note - 11/26/2010 1:22:47 PM
G- Color code was changed to green after it sank below its DMA line and under the latest chart low, raising concerns. Gains above its short-term average are needed for its outlook to improve.
>>> The latest Featured Stock Update with an annotated graph appeared on 11/18/2010. Click here.
View all notes |
Alert me of new notes |
CANSLIM.net Company Profile |
SEC |
Zacks Reports |
StockTalk |
News |
Chart |
Request a new note
C
A N
S L
I M
|
PAY
-
NYSE
Verifone Systems Inc
COMPUTER HARDWARE - Transaction Automation Systems
|
$34.70
|
-0.30
-0.86% |
$35.10
|
500,966
36.34% of 50 DAV
50 DAV is 1,378,600
|
$35.94
-3.45%
|
8/25/2010
|
$24.30
|
PP = $23.74
|
|
MB = $24.93
|
Most Recent Note - 11/24/2010 3:57:31 PM
G - Considerable gain today with near average volume. It has the look of an advanced "ascending base" pattern after an impressive rally from its 7/26/10 breakout.
>>> The latest Featured Stock Update with an annotated graph appeared on 10/25/2010. Click here.
View all notes |
Alert me of new notes |
CANSLIM.net Company Profile |
SEC |
Zacks Reports |
StockTalk |
News |
Chart |
Request a new note
C
A N
S L
I M
|
RAX
-
NYSE
Rackspace Hosting Inc
INTERNET - Internet Software and; Services
|
$28.49
|
-0.11
-0.38% |
$28.96
|
449,867
16.85% of 50 DAV
50 DAV is 2,670,400
|
$29.35
-2.93%
|
9/21/2010
|
$22.84
|
PP = $23.61
|
|
MB = $24.79
|
Most Recent Note - 11/24/2010 3:48:05 PM
G - Perched -3% away from its all-time high with no resistance remaining due to overhead supply, but it is extended from any sound base.
>>> The latest Featured Stock Update with an annotated graph appeared on 11/17/2010. Click here.
View all notes |
Alert me of new notes |
CANSLIM.net Company Profile |
SEC |
Zacks Reports |
StockTalk |
News |
Chart |
Request a new note
C
A N
S L
I M
|
ROVI
-
NASDAQ
Rovi Corp
COMPUTER SOFTWARE andamp; SERVICES - Security Software andamp; Services
|
$54.90
|
+0.41
0.75% |
$55.25
|
216,395
14.21% of 50 DAV
50 DAV is 1,523,100
|
$55.00
-0.18%
|
10/29/2010
|
$49.99
|
PP = $53.10
|
|
MB = $55.76
|
Most Recent Note - 11/26/2010 1:36:06 PM
Y - Finished the holiday-shortened week at its best close of 2010 after posting small gains without great volume conviction. Confirming gains on heavy volume coupled with a follow-through day from at least one of the major market averages (M criteria) could trigger new (or add-on) technical buy signals. Meanwhile, its 50 DMA line defines important support to watch.
>>> The latest Featured Stock Update with an annotated graph appeared on 10/20/2010. Click here.
View all notes |
Alert me of new notes |
CANSLIM.net Company Profile |
SEC |
Zacks Reports |
StockTalk |
News |
Chart |
Request a new note
C
A N
S L
I M
|
Symbol/Exchange
Company Name
Industry Group |
PRICE |
CHANGE
(%Change) |
Day High |
Volume
(% DAV)
(% 50 day avg vol) |
52 Wk Hi
% From Hi |
Featured
Date |
Price
Featured |
Pivot Featured |
|
Max Buy |
SHOO
-
NASDAQ
Steven Madden Limited
CONSUMER NON-DURABLES - Textile - Apparel Footwear
|
$44.96
|
-0.08
-0.18% |
$45.52
|
60,047
17.09% of 50 DAV
50 DAV is 351,400
|
$45.92
-2.09%
|
11/23/2010
|
$44.61
|
PP = $44.95
|
|
MB = $47.20
|
Most Recent Note - 11/26/2010 1:08:43 PM
Y - Perched at new 2010 highs after a streak of 6 consecutive gains. Color code was changed to yellow with new pivot point cited. No resistance remains due to overhead supply. Recently found support above its 50 DMA line and prior chart highs in the $40 area.
>>> The latest Featured Stock Update with an annotated graph appeared on 11/23/2010. Click here.
View all notes |
Alert me of new notes |
CANSLIM.net Company Profile |
SEC |
Zacks Reports |
StockTalk |
News |
Chart |
Request a new note
C
A N
S L
I M
|
SLW
-
NYSE
Silver Wheaton Corp
METALS and; MINING - Silver
|
$35.15
|
-0.49
-1.37% |
$35.36
|
4,399,339
46.51% of 50 DAV
50 DAV is 9,458,500
|
$37.20
-5.51%
|
8/25/2010
|
$21.40
|
PP = $21.99
|
|
MB = $23.09
|
Most Recent Note - 11/24/2010 4:20:28 PM
G - Small gain today with light volume for its second-best close ever. Last week's lows define support above its 50 DMA line.
>>> The latest Featured Stock Update with an annotated graph appeared on 10/18/2010. Click here.
View all notes |
Alert me of new notes |
CANSLIM.net Company Profile |
SEC |
Zacks Reports |
StockTalk |
News |
Chart |
Request a new note
C
A N
S L
I M
|
UA
-
NYSE
Under Armour Inc Cl A
CONSUMER NON-DURABLES - Textile - Apparel Clothing
|
$56.50
|
-0.08
-0.14% |
$57.22
|
248,673
33.65% of 50 DAV
50 DAV is 739,000
|
$57.14
-1.12%
|
9/9/2010
|
$39.99
|
PP = $40.10
|
|
MB = $42.11
|
Most Recent Note - 11/24/2010 4:16:32 PM
G - Volume was above average today as it posted a 7th consecutive gain for a new 52-week high. The high-ranked Apparel - Clothing firm is very extended from any sound base and well above support at its 50 DMA line.
>>> The latest Featured Stock Update with an annotated graph appeared on 11/4/2010. Click here.
View all notes |
Alert me of new notes |
CANSLIM.net Company Profile |
SEC |
Zacks Reports |
StockTalk |
News |
Chart |
Request a new note
C
A N
S L
I M
|
ULTA
-
NASDAQ
Ulta Salon Cosm & Frag
SPECIALTY RETAIL - Specialty Retail, Other
|
$34.99
|
+0.52
1.51% |
$35.05
|
163,270
36.51% of 50 DAV
50 DAV is 447,200
|
$35.00
-0.03%
|
9/3/2010
|
$26.36
|
PP = $25.89
|
|
MB = $27.18
|
Most Recent Note - 11/26/2010 1:30:42 PM
G - Today's 4th consecutive gain helped it hit a new 52-week high, approaching its all-time high of $35.63 from Nov '07. Meanwhile, its 50 DMA line defines initial support to watch.
>>> The latest Featured Stock Update with an annotated graph appeared on 11/1/2010. Click here.
View all notes |
Alert me of new notes |
CANSLIM.net Company Profile |
SEC |
Zacks Reports |
StockTalk |
News |
Chart |
Request a new note
C
A N
S L
I M
|
VIT
-
NYSE
Vanceinfo Tech Inc Ads
COMPUTER SOFTWARE and SERVICES - Business Software and Services
|
$37.50
|
-0.17
-0.45% |
$37.94
|
167,986
25.62% of 50 DAV
50 DAV is 655,800
|
$38.43
-2.42%
|
7/8/2010
|
$25.20
|
PP = $26.58
|
|
MB = $27.91
|
Most Recent Note - 11/26/2010 1:34:12 PM
G - Completed a Public Offering this week and it is perched near all-time highs. It 50 DMA line has acted as support recently, but it has not formed a sound base.
>>> The latest Featured Stock Update with an annotated graph appeared on 10/21/2010. Click here.
View all notes |
Alert me of new notes |
CANSLIM.net Company Profile |
SEC |
Zacks Reports |
StockTalk |
News |
Chart |
Request a new note
C
A N
S L
I M
|
Symbol/Exchange
Company Name
Industry Group |
PRICE |
CHANGE
(%Change) |
Day High |
Volume
(% DAV)
(% 50 day avg vol) |
52 Wk Hi
% From Hi |
Featured
Date |
Price
Featured |
Pivot Featured |
|
Max Buy |