You are not logged in.
This means you
CAN ONLY VIEW reports that were published prior to Monday, April 14, 2025.
You
MUST UPGRADE YOUR MEMBERSHIP if you want to see any current reports.
AFTER MARKET UPDATE - WEDNESDAY, NOVEMBER 25TH, 2009
Previous After Market Report Next After Market Report >>>
|
|
|
|
DOW |
+30.69 |
10,464.40 |
+0.29% |
|
Volume |
795,068,470 |
-16% |
|
Volume |
1,436,630,430 |
-25% |
|
NASDAQ |
+6.87 |
2,176.05 |
+0.32% |
|
Advancers |
1,978 |
63% |
|
Advancers |
1,232 |
43% |
|
S&P 500 |
+4.98 |
1,110.63 |
+0.45% |
|
Decliners |
1,020 |
33% |
|
Decliners |
1,464 |
52% |
|
Russell 2000 |
-0.39 |
592.19 |
-0.07% |
|
52 Wk Highs |
168 |
|
|
52 Wk Highs |
84 |
|
|
S&P 600 |
-0.71 |
312.77 |
-0.23% |
|
52 Wk Lows |
5 |
|
|
52 Wk Lows |
11 |
|
|
 |
Light Volume Action Ahead Of Thanksgiving Holiday
Adam Sarhan, Contributing Writer,
The major averages advanced on Wednesday as the greenback slid to a 14-year low against the yen after the latest round of economic data was released. As expected, volume, a critical component of institutional demand, was lower than Tuesday's levels ahead of the the Thanksgiving day holiday. The stock market will be closed on Thursday and is slated to close early on Friday (1pm EST) in observance of the holiday. Advancers led decliners by about a 2-to-1 ratio on the NYSE but trailed by a narrow margin on the Nasdaq exchange. There were 22 high-ranked companies from the CANSLIM.net Leaders List making a new 52-week high and appearing on the CANSLIM.net BreakOuts Page, higher from the 12 issues that appeared on the prior session. In terms of new leadership, it was encouraging to see new 52-week highs outnumber new 52-week lows on the NYSE and Nasdaq exchange.
Stocks rallied on anemic volume the day before thanksgiving thanks to an array of factors. First, the US dollar got smacked which helped the bulls send stocks higher. For months, we have written about the inverse relationship between the US dollar and dollar denominated assets (i.e. stocks and commodities). The dollar index lost over -1.1% which was its largest single day percentage drop in nearly four months! Wednesday's decline put the dollar Index at a fresh 12-month low. The second factor that helped stocks advance today was a series of economic data. Home sales, jobless claims and consumer confidence were relatively healthy which helped support the notion that the economic recovery is strengthening. The other positive data point came from higher oil prices. The government said that energy demand rose for a second consecutive week (thanks to a stronger economy) which sent crude oil up nearly $2 a barrel. Gold also hit a new all time high as the dollar fell and a report was released that the Indian central bank may buy more bullion for its reserves.
On the economic front, the government said that weekly jobless claims fell to their lowest level since September 2008 which led many to speculate that the worst is over for the labor market. The Labor Department said the number of Americans filing claims for unemployment benefits fell to 466,000 last week which was a welcomed sign. The Reuters/University of Michigan index of consumer confidence was 67.4, higher than the average estimate of 67. Meanwhile, the Commerce Department said consumer spending rose +0.7% last month which topped the Street's estimate for a +0.5% reading and new home sales jumped by +6.2%. On Tuesday, the Federal Reserve raised its forecast for 2010 economic growth to a range of 2.5%-to-3.5%, up from +2.1%-to-+3.3%. The Fed also signaled that it will be more accepting of a weaker US dollar in the near term to help spur economic growth.
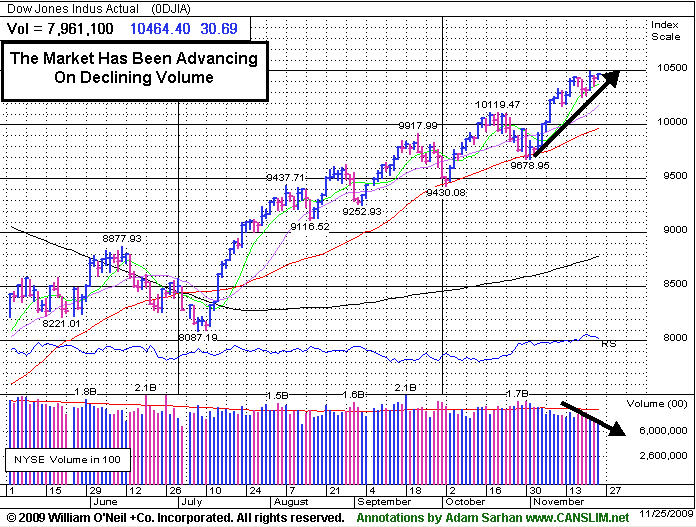
Looking at the market, the current rally remains intact as the major averages refuse to go down and continue marching higher. This is a strong sign of institutional sponsorship but concerns remain as volume continues to dry up as the the market crawls higher and leadership remains inordinately thin. This action suggests anything is possible but until a broad based sell off occurs, the bulls remain in control.
PICTURED: The Dow Jones Industrial Average's chart shows how the market has recently been advancing on lighter (and below average) volume.
|
|
|
 |
Gold & Silver Index Rallies To Another 2009 High Close
Kenneth J. Gruneisen - Passed the CAN SLIM® Master's Exam
The financial group continued to sputter as the Bank Index ($BKX -0.18%) and Broker/Dealer Index ($XBD -0.04%) edged lower. Tech shares showed a positive bias as the Semiconductor Index ($SOX +0.83%) outpaced the Networking Index ($NWX +0.38%), Internet Index ($IIX +0.46%), and Biotechnology Index ($BTK +0.17%). The Retail Index ($RLX +1.40%) was among Wednesday's positive influences as it posted a solid gain. Defensive groups were gainers. The Healthcare Index ($HMO +0.31%) posted a small gain. Energy shares rose, lifting the Oil Services Index ($OSX +0.93%) and Integrated Oil Index ($XOI +0.95%)
Charts courtesy www.stockcharts.com

PICTURED: The Gold & Silver Index ($XAU +2.70%) rallied to new 2009 high close. The classic "safe haven" area has attracted increased buying demand from investors speculating that the US dollar's deterioration will continue.
| Oil Services |
$OSX |
194.54 |
+1.80 |
+0.93% |
+60.26% |
| Healthcare |
$HMO |
1,375.86 |
+4.29 |
+0.31% |
+43.29% |
| Integrated Oil |
$XOI |
1,101.91 |
+10.41 |
+0.95% |
+12.48% |
| Semiconductor |
$SOX |
315.09 |
+2.59 |
+0.83% |
+48.51% |
| Networking |
$NWX |
226.05 |
+0.86 |
+0.38% |
+57.10% |
| Internet |
$IIX |
226.83 |
+1.03 |
+0.46% |
+69.57% |
| Broker/Dealer |
$XBD |
113.71 |
-0.05 |
-0.04% |
+46.78% |
| Retail |
$RLX |
409.68 |
+5.66 |
+1.40% |
+46.70% |
| Gold & Silver |
$XAU |
190.80 |
+5.01 |
+2.70% |
+54.06% |
| Bank |
$BKX |
44.22 |
-0.08 |
-0.18% |
-0.23% |
| Biotech |
$BTK |
892.31 |
+1.48 |
+0.17% |
+37.88% |
|
|
|
 |
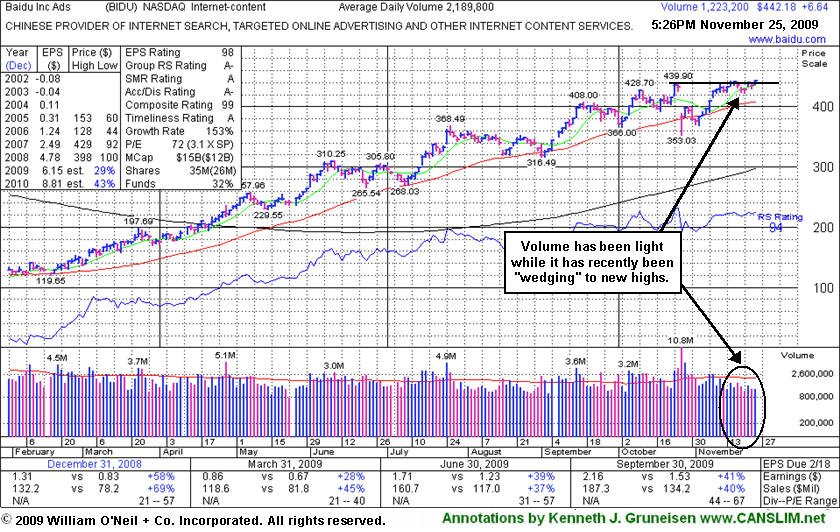
Wedging To New Highs With Light Volume Behind Gains
Kenneth J. Gruneisen - Passed the CAN SLIM® Master's Exam
Baidu.com, Inc. (BIDU +$6.64 or +1.52% to $442.18) posted a gain on light volume today for a new all-time high close. It proved resilient near its 50-day moving average (DMA) line after its 10/27/09 gap down. That was a sign of great institutional support, making a stand near its important short-term average line. However, as it clawed its way to new all-time high closes on light volume recently, the light volume leaves questions as to how much appetite the large investors have for accumulating a greater interest.
BIDU was featured in yellow in the 9/08/09 Mid-Day BreakOuts Report (read here). The number of top-rated funds owning BIDU's shares rose from 112 in Sept '08 to 169 in Sep '09, clear evidence its shares were being accumulated by the institutional (I criteria) crowd. An earlier FSU section appearance described some of the more extensive prior coverage this Chinese Internet search provider has received (read here).
|
|
|
Color Codes Explained :
Y - Better candidates highlighted by our
staff of experts.
G - Previously featured
in past reports as yellow but may no longer be buyable under the
guidelines.
***Last / Change / Volume quote data in this table corresponds with the timestamp on the note***
Symbol/Exchange
Company Name
Industry Group |
Last |
Chg. |
Vol
% DAV |
Date Featured |
Price Featured |
Latest Pivot Point
Featured |
Status |
| Latest Max Buy Price |
ARST
-
|
$24.43
|
+0.28
|
137,468
23% DAV
608,300
|
9/1/2009
(Date
Featured) |
$19.91
(Price
Featured) |
PP = $20.90 |
G |
| MB = $21.95 |
Most Recent Note - 11/25/2009 5:24:13 PM
G - Small gain today on very light volume, closing near its 50 DMA line. ARST was first featured in yellow at $19.91 in the 9/01/09 mid-day report with an annotated daily graph (read here).
>>> The latest Featured Stock Update with an annotated graph appeared on 11/19/2009. click here.
|
|
C
A
S
I |
News |
Chart |
SEC
View all notes Alert
me of new notes
Company
Profile
|
ASIA
-
|
$25.65
|
+0.33
|
382,843
37% DAV
1,022,300
|
10/14/2009
(Date
Featured) |
$23.05
(Price
Featured) |
PP = $22.19 |
G |
| MB = $23.30 |
Most Recent Note - 11/25/2009 5:25:32 PM
G - Small gain on light volume today, hovering near its 2009 highs, extended from its latest sound base. Featured 10/14/09 in the mid-day report (read here) as it gapped up for a new 52-week high with 5 times average volume, triggering a technical buy signal by blasting above its pivot point. First featured in the August 2009 CANSLIM.net News (read here).
>>> The latest Featured Stock Update with an annotated graph appeared on 11/24/2009. click here.
|
|
C
A
S
I |
News |
Chart |
SEC
View all notes Alert
me of new notes
Company
Profile
|
BIDU
- NASDAQ
Baidu Inc Ads
INTERNET - Internet Information Providers
|
$442.18
|
+6.64
|
1,224,776
55% DAV
2,238,500
|
9/8/2009
(Date
Featured) |
$351.80
(Price
Featured) |
PP = $368.59 |
G |
| MB = $387.02 |
Most Recent Note - 11/25/2009 5:34:32 PM
G - Small gain on light volume today for a new all-time high close. Proved resilient near its 50 DMA line after its 10/27/09 gap down. As recently noted, "Choppy action has not allowed it to form a sound base in recent weeks." BIDU traded up as much as +23% from its price when featured in yellow in the 9/08/09 Mid-Day BreakOuts Report (read here).
>>> The latest Featured Stock Update with an annotated graph appeared on 11/25/2009. click here.
|
|
C
A
S
I |
News |
Chart |
SEC
View all notes Alert
me of new notes
Company
Profile
|
CACC
- NASDAQ
Credit Acceptance Corp
FINANCIAL SERVICES - Credit Services
|
$34.67
|
-0.32
|
15,370
42% DAV
36,500
|
9/29/2009
(Date
Featured) |
$33.48
(Price
Featured) |
PP = $37.10 |
Y |
| MB = $38.96 |
Most Recent Note - 11/25/2009 5:36:39 PM
Y - Small loss today on below average volume. Color code was changed to yellow with new pivot point and max buy levels noted. After a 5-week flat base it is continuing its consolidation in a very orderly fashion above prior chart highs and its 50 DMA line in the $32 area. The Finance - Consumer/Commercial Loans firm has maintained a great track record of annual and quarterly sales revenues and earnings increases. It was featured on 9/29/09 in yellow in the mid-day report (read here).
>>> The latest Featured Stock Update with an annotated graph appeared on 11/16/2009. click here.
|
|
C
A
S
I |
News |
Chart |
SEC
View all notes Alert
me of new notes
Company
Profile
|
CRM
- NYSE
Salesforce.com Inc
INTERNET - Internet Software & Services
|
$65.09
|
-0.35
|
901,151
51% DAV
1,770,600
|
8/16/2009
(Date
Featured) |
$47.12
(Price
Featured) |
PP = $45.59 |
G |
| MB = $47.87 |
Most Recent Note - 11/25/2009 5:37:41 PM
G - Small loss today on light volume. After finding support at its 50 DMA line it is consolidating within close range of its prior high. It has not formed any recent base, and distributional pressure has raised concerns.
>>> The latest Featured Stock Update with an annotated graph appeared on 11/23/2009. click here.
|
|
C
A
S
I |
News |
Chart |
SEC
View all notes Alert
me of new notes
Company
Profile
|
GMCR
- NASDAQ
Green Mtn Coffee Roastrs
FOOD & BEVERAGE - Processed & Packaged Goods
|
$63.36
|
-0.60
|
783,269
57% DAV
1,383,400
|
10/5/2009
(Date
Featured) |
$71.11
(Price
Featured) |
PP = $75.89 |
G |
| MB = $79.68 |
Most Recent Note - 11/25/2009 5:39:23 PM
G - Down on light volume today, but recent action has been indicative of distributional pressure. It recently triggered a sell signal by its 50 DMA line violation. Gapped down on 11/12/09 after reporting strong quarterly results for the period ended Sept 30, 2009. As recently noted, "Its choppy action in recent weeks has not allowed for a sound new base to form."
>>> The latest Featured Stock Update with an annotated graph appeared on 11/20/2009. click here.
|
|
C
A
S
I |
News |
Chart |
SEC
View all notes Alert
me of new notes
Company
Profile
|
HEAT
-
|
$13.07
|
+0.74
|
1,083,111
166% DAV
653,300
|
11/17/2009
(Date
Featured) |
$12.00
(Price
Featured) |
PP = $12.61 |
Y |
| MB = $13.24 |
Most Recent Note - 11/25/2009 5:43:24 PM
Y - Gain today with above average volume, rallying back near its "max buy" level. Consolidating since the prior week's gains on heavy volume drew attention. It was first featured in yellow in the 11/17/09 mid-day report (read here) when technically rising from a "double bottom" base, reaching a new all-time high. On 9/18/09 it completed an additional share offering. There is limited history for this small Chinese firm in the Pollution Control - Equipment group, however its reported annual earnings (A criteria) history has been strong, and the 3 latest quarters show sales revenues and earnings increases well above the +25% guideline.
>>> The latest Featured Stock Update with an annotated graph appeared on 11/17/2009. click here.
|
|
C
A
S
I |
News |
Chart |
SEC
View all notes Alert
me of new notes
Company
Profile
|
LFT
-
|
$35.37
|
+0.28
|
152,501
31% DAV
491,500
|
11/17/2009
(Date
Featured) |
$31.77
(Price
Featured) |
PP = $33.04 |
G |
| MB = $34.69 |
Most Recent Note - 11/25/2009 5:44:44 PM
G -Gain on light volume today for a new all-time high close. Last week it rose from a choppy 14-week base. Recent highs in the $31 area are an initial support level to watch. A proposed offering of additional shares on 11/16/09 seems well received by the market. Its fundamentals remain strong.
>>> The latest Featured Stock Update with an annotated graph appeared on 11/18/2009. click here.
|
|
C
A
S
I |
News |
Chart |
SEC
View all notes Alert
me of new notes
Company
Profile
|
|
|
|
THESE ARE NOT BUY RECOMMENDATIONS!
Comments contained in the body of this report are technical
opinions only. The material herein has been obtained
from sources believed to be reliable and accurate, however,
its accuracy and completeness cannot be guaranteed.
This site is not an investment advisor, hence it does
not endorse or recommend any securities or other investments.
Any recommendation contained in this report may not
be suitable for all investors and it is not to be deemed
an offer or solicitation on our part with respect to
the purchase or sale of any securities. All trademarks,
service marks and trade names appearing in this report
are the property of their respective owners, and are
likewise used for identification purposes only.
This report is a service available
only to active Paid Premium Members.
You may opt-out of receiving report notifications
at any time. Questions or comments may be submitted
by writing to Premium Membership Services 665 S.E. 10 Street, Suite 201 Deerfield Beach, FL 33441-5634 or by calling 1-800-965-8307
or 954-785-1121.
|
|
|


