You are not logged in.
This means you
CAN ONLY VIEW reports that were published prior to Sunday, March 9, 2025.
You
MUST UPGRADE YOUR MEMBERSHIP if you want to see any current reports.
AFTER MARKET UPDATE - TUESDAY, NOVEMBER 24TH, 2009
Previous After Market Report Next After Market Report >>>
|
|
|
|
DOW |
-17.24 |
10,433.71 |
-0.16% |
|
Volume |
951,963,800 |
-3% |
|
Volume |
1,907,293,780 |
+2% |
|
NASDAQ |
-6.83 |
2,169.18 |
-0.31% |
|
Advancers |
1,391 |
44% |
|
Advancers |
1,110 |
39% |
|
S&P 500 |
-0.59 |
1,105.65 |
-0.05% |
|
Decliners |
1,628 |
52% |
|
Decliners |
1,607 |
56% |
|
Russell 2000 |
-2.23 |
592.58 |
-0.37% |
|
52 Wk Highs |
91 |
|
|
52 Wk Highs |
55 |
|
|
S&P 600 |
-1.37 |
313.48 |
-0.44% |
|
52 Wk Lows |
6 |
|
|
52 Wk Lows |
13 |
|
|
 |
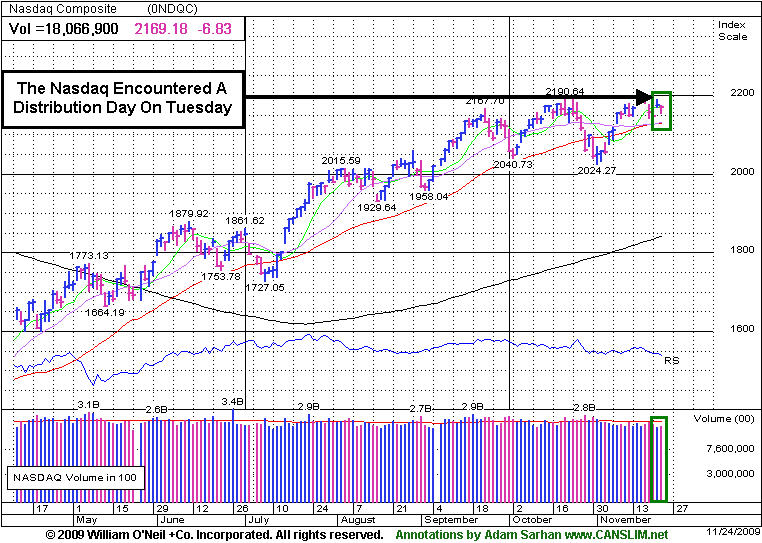
Leadership Wanes As Nasdaq Encounters More Mild Distributional Pressure
Adam Sarhan, Contributing Writer,
Stocks closed lower on a very busy day on Wall Street. Volume, a critical component of institutional demand, was mixed compared to Monday's levels; higher on the Nasdaq and lower on the NYSE. That marked a distribution day for the Nasdaq but the lower volume helped the NYSE indices avoid distribution day. Decliners led advancers narrowly on the NYSE and by approximately a 3-to-2 ratio on the Nasdaq exchange. There were 12 high-ranked companies from the CANSLIM.net Leaders List making a new 52-week high and appearing on the CANSLIM.net BreakOuts Page, higher from the 41 issues that appeared on the prior session. In terms of new leadership, it was encouraging to see new 52-week highs outnumber new 52-week lows on the NYSE and Nasdaq exchange.
Stocks opened lower after five of China’s largest banks announced plans to regulators to raise additional capital. The led many people to question how long the economic recovery will fare in China. Elsewhere, the Commerce Department said the US economy grew at a +2.8% annual rate last quarter which was less than the government's initial reading last month. The downtick illustrates a strained consumer and leads many to question the strength of the upcoming holiday shopping season. The government released a separate report that showed that US consumer spending, which accounts for over +70% of the world’s largest economy, increased at a +2.9% pace in the third quarter. This was lower than the initial estimate of a +3.2% expected by economists.
The Managing Director of the International Monetary Fund (IMF), Dominique Strauss-Kahn, said that financial institutions have revealed only about half of their losses from last year's economic crisis. Investors digested more data from the troubled housing market. The S&P/Case-Shiller home-price index for 20 cities rose +0.27% in September from the prior month on a seasonally adjusted basis. In September, the reading plunged -9.36% from September 2008 which was the smallest year-over-year decline since the end of 2007. Another economic report was released by the C onference Board’s consumer confidence index. The index unexpectedly rose to 49.5 in November which was higher the Street's estimate of 47.3.
Looking at the market, the fact that the market has been holding up rather well in recent weeks and refuses to go down is a very positive sign of strong institutional sponsorship. However, high quality leadership remains very narrow which is a serious concern for this somewhat unconventional rally. Ideally, one would like to see leadership expand over the next few weeks as the major averages continue advancing.
PICTURED: The Nasdaq Composite Index encountered distributional pressure, but managed to close in the upper half of its intra-day range. Volume was higher than the prior session, but below average, which helped offset concerns.
|
|
|
 |
Biotech Index's Standout Gain Still Leaves It Below 50-Day Average
Kenneth J. Gruneisen - Passed the CAN SLIM® Master's Exam
Financial shares edged lower on Tuesday as the Broker/Dealer Index ($XBD -1.31%) and Bank Index ($BKX -0.65%) created a drag on the major averages. The Gold & Silver Index ($XAU -0.64%) suffered a modest loss. Tech shares were mixed as the Internet Index ($IIX -0.59%) and Networking Index ($NWX -0.32%) edged lower, yet the Semiconductor Index ($SOX +0.31%) posted a small gain. While the Retail Index ($RLX -0.03%) ended essentially flat, energy shares had a slightly positive bias as the Integrated Oil Index ($XOI +0.26%) and Oil Services Index ($OSX +0.43%) closed with small gains. The Healthcare Index ($HMO +1.42%) posted a solid gain, making it among the standouts on the plus side.
Charts courtesy www.stockcharts.com
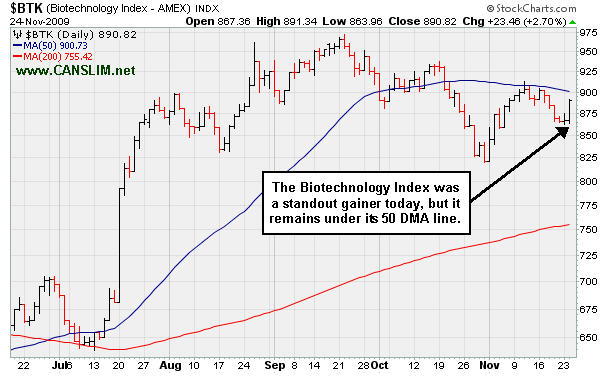
PICTURED: The Biotechnology Index ($BTK +2.70%) was another standout gainer, but even after its considerable gain today it remains below its 50-day moving average line.
| Oil Services |
$OSX |
192.74 |
+0.82 |
+0.43% |
+58.78% |
| Healthcare |
$HMO |
1,371.57 |
+19.25 |
+1.42% |
+42.85% |
| Integrated Oil |
$XOI |
1,091.50 |
+2.86 |
+0.26% |
+11.41% |
| Semiconductor |
$SOX |
312.50 |
+0.98 |
+0.31% |
+47.29% |
| Networking |
$NWX |
225.19 |
-0.72 |
-0.32% |
+56.50% |
| Internet |
$IIX |
225.80 |
-1.33 |
-0.59% |
+68.80% |
| Broker/Dealer |
$XBD |
113.76 |
-1.51 |
-1.31% |
+46.84% |
| Retail |
$RLX |
404.02 |
-0.13 |
-0.03% |
+44.68% |
| Gold & Silver |
$XAU |
185.79 |
-1.20 |
-0.64% |
+50.01% |
| Bank |
$BKX |
44.30 |
-0.29 |
-0.65% |
-0.05% |
| Biotech |
$BTK |
890.82 |
+23.46 |
+2.70% |
+37.65% |
|
|
|
 |
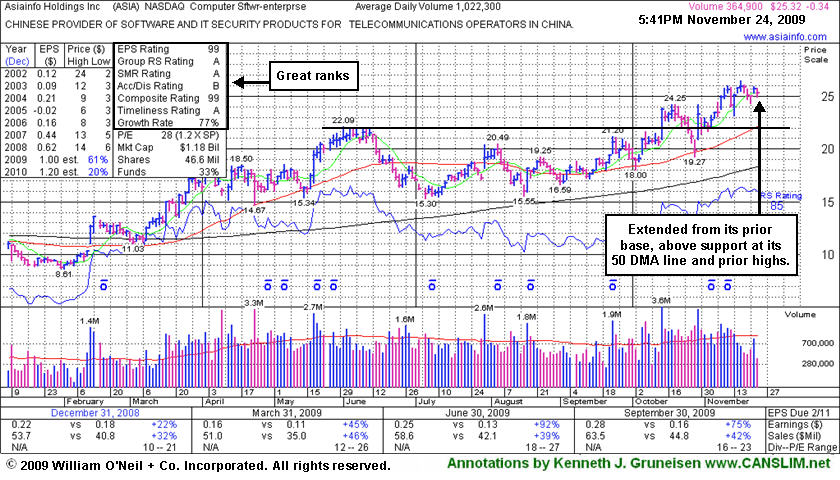
High-Ranked Leader Still Extended From Prior Base
Kenneth J. Gruneisen - Passed the CAN SLIM® Master's Exam
AsiaInfo Holdings, Inc. (ASIA -$0.34 or -1.33% to $25.32) suffered a small loss today with lighter than average volume. It is still extended from its latest sound base. Gains with above average volume helped it rally to new 2009 highs following a 10/29/09 gap up for a big gain after reporting solid earnings for the period ended Sept 30, 2009 that beat expectations as it also raised guidance. It found prompt support near its 50-day moving average (DMA) line, a textbook chart support level, after a 7 session losing streak with losses on high volume triggered technical sell signals and briefly negated its latest breakout.
ASIA was featured 10/14/09 in the mid-day report (read here) as it gapped up for a new 52-week high with 5 times average volume, triggering a technical buy signal by blasting above its pivot point. Disciplined entries and exits are critical to investors' success with the investment system. ASIA was first featured in the August 2009 CANSLIM.net News (read here).
|
|
|
Color Codes Explained :
Y - Better candidates highlighted by our
staff of experts.
G - Previously featured
in past reports as yellow but may no longer be buyable under the
guidelines.
***Last / Change / Volume quote data in this table corresponds with the timestamp on the note***
Symbol/Exchange
Company Name
Industry Group |
Last |
Chg. |
Vol
% DAV |
Date Featured |
Price Featured |
Latest Pivot Point
Featured |
Status |
| Latest Max Buy Price |
ARST
-
|
$24.15
|
-0.49
|
177,599
29% DAV
608,300
|
9/1/2009
(Date
Featured) |
$19.91
(Price
Featured) |
PP = $20.90 |
G |
| MB = $21.95 |
Most Recent Note - 11/24/2009 4:54:42 PM
G - Small loss today on very light volume, closing just under its 50 DMA line (now $24.26). ARST was first featured in yellow at $19.91 in the 9/01/09 mid-day report with an annotated daily graph (read here).
>>> The latest Featured Stock Update with an annotated graph appeared on 11/19/2009. click here.
|
|
C
A
S
I |
News |
Chart |
SEC
View all notes Alert
me of new notes
Company
Profile
|
ASIA
-
|
$25.32
|
-0.34
|
369,155
36% DAV
1,022,300
|
10/14/2009
(Date
Featured) |
$23.05
(Price
Featured) |
PP = $22.19 |
G |
| MB = $23.30 |
Most Recent Note - 11/24/2009 4:57:37 PM
G - Small loss on light today, hovering near its 2009 highs, extended from its latest sound base. Featured 10/14/09 in the mid-day report (read here) as it gapped up for a new 52-week high with 5 times average volume, triggering a technical buy signal by blasting above its pivot point. First featured in the August 2009 CANSLIM.net News (read here).
>>> The latest Featured Stock Update with an annotated graph appeared on 11/24/2009. click here.
|
|
C
A
S
I |
News |
Chart |
SEC
View all notes Alert
me of new notes
Company
Profile
|
BIDU
- NASDAQ
Baidu Inc Ads
INTERNET - Internet Information Providers
|
$435.54
|
-3.46
|
1,213,223
54% DAV
2,238,500
|
9/8/2009
(Date
Featured) |
$351.80
(Price
Featured) |
PP = $368.59 |
G |
| MB = $387.02 |
Most Recent Note - 11/24/2009 5:00:50 PM
G - Small loss light volume today while hovering near all-time highs. Proved resilient near its 50 DMA line after its 10/27/09 gap down. As recently noted, "Choppy action has not allowed it to form a sound base in recent weeks." BIDU traded up as much as +23% from its price when featured in yellow in the 9/08/09 Mid-Day BreakOuts Report (read here).
>>> The latest Featured Stock Update with an annotated graph appeared on 11/10/2009. click here.
|
|
C
A
S
I |
News |
Chart |
SEC
View all notes Alert
me of new notes
Company
Profile
|
CACC
- NASDAQ
Credit Acceptance Corp
FINANCIAL SERVICES - Credit Services
|
$34.99
|
+0.01
|
17,505
48% DAV
36,500
|
9/29/2009
(Date
Featured) |
$33.48
(Price
Featured) |
PP = $37.10 |
Y |
| MB = $38.96 |
Most Recent Note - 11/24/2009 5:02:51 PM
Y - Small gain today on near average volume. Color code was changed to yellow with new pivot point and max buy levels noted. After a 5-week flat base it is continuing its consolidation in a very orderly fashion above prior chart highs and its 50 DMA line in the $32 area. The Finance - Consumer/Commercial Loans firm has maintained a great track record of annual and quarterly sales revenues and earnings increases. It was featured on 9/29/09 in yellow in the mid-day report (read here).
>>> The latest Featured Stock Update with an annotated graph appeared on 11/16/2009. click here.
|
|
C
A
S
I |
News |
Chart |
SEC
View all notes Alert
me of new notes
Company
Profile
|
CRM
- NYSE
Salesforce.com Inc
INTERNET - Internet Software & Services
|
$65.44
|
+0.94
|
1,859,208
105% DAV
1,770,600
|
8/16/2009
(Date
Featured) |
$47.12
(Price
Featured) |
PP = $45.59 |
G |
| MB = $47.87 |
Most Recent Note - 11/24/2009 5:06:32 PM
G - After finding support at its 50 DMA line it is consolidating within close range of its prior high. It has not formed any recent base, and distributional pressure has raised concerns.
>>> The latest Featured Stock Update with an annotated graph appeared on 11/23/2009. click here.
|
|
C
A
S
I |
News |
Chart |
SEC
View all notes Alert
me of new notes
Company
Profile
|
GMCR
- NASDAQ
Green Mtn Coffee Roastrs
FOOD & BEVERAGE - Processed & Packaged Goods
|
$63.96
|
-1.48
|
1,630,651
118% DAV
1,383,400
|
10/5/2009
(Date
Featured) |
$71.11
(Price
Featured) |
PP = $75.89 |
G |
| MB = $79.68 |
Most Recent Note - 11/24/2009 5:09:19 PM
G - Loss today on slightly above average volume, action still indicative of distributional pressure. It recently triggered a sell signal by its 50 DMA line violation. Gapped down on 11/12/09 after reporting strong quarterly results for the period ended Sept 30, 2009. As recently noted, "Its choppy action in recent weeks has not allowed for a sound new base to form."
>>> The latest Featured Stock Update with an annotated graph appeared on 11/20/2009. click here.
|
|
C
A
S
I |
News |
Chart |
SEC
View all notes Alert
me of new notes
Company
Profile
|
HEAT
-
|
$12.33
|
-1.42
|
1,352,157
207% DAV
653,300
|
11/17/2009
(Date
Featured) |
$12.00
(Price
Featured) |
PP = $12.61 |
Y |
| MB = $13.24 |
Most Recent Note - 11/24/2009 5:15:04 PM
Y - Gapped down today and suffered a considerable loss on heavy volume, retreating under its pivot point. Its color code was changed to yellow, however the weak action is distributional and raises concerns. It hit a new 52-week high with its early gain on the prior session, then reversed to close in the middle of its intra-day range. Last week's gains on heavy volume drew attention since it was first featured in yellow in the 11/17/09 mid-day report (read here) when technically rising from a "double bottom" base, reaching a new all-time high. On 9/18/09 it completed an additional share offering. There is limited history for this small Chinese firm in the Pollution Control - Equipment group, however its reported annual earnings (A criteria) history has been strong, and the 3 latest quarters show sales revenues and earnings increases well above the +25% guideline.
>>> The latest Featured Stock Update with an annotated graph appeared on 11/17/2009. click here.
|
|
C
A
S
I |
News |
Chart |
SEC
View all notes Alert
me of new notes
Company
Profile
|
LFT
-
|
$35.09
|
+0.42
|
367,973
75% DAV
491,500
|
11/17/2009
(Date
Featured) |
$31.77
(Price
Featured) |
PP = $33.04 |
G |
| MB = $34.69 |
Most Recent Note - 11/24/2009 5:26:07 PM
G -Gain on light volume today for a new high close following a negative reversal after hitting a new all-time high on the prior session. Last week it rose from a choppy 14-week base. Recent highs in the $31 area are an initial support level to watch. A proposed offering of additional shares on 11/16/09 seems well received by the market. Its fundamentals remain strong.
>>> The latest Featured Stock Update with an annotated graph appeared on 11/18/2009. click here.
|
|
C
A
S
I |
News |
Chart |
SEC
View all notes Alert
me of new notes
Company
Profile
|
|
|
|
THESE ARE NOT BUY RECOMMENDATIONS!
Comments contained in the body of this report are technical
opinions only. The material herein has been obtained
from sources believed to be reliable and accurate, however,
its accuracy and completeness cannot be guaranteed.
This site is not an investment advisor, hence it does
not endorse or recommend any securities or other investments.
Any recommendation contained in this report may not
be suitable for all investors and it is not to be deemed
an offer or solicitation on our part with respect to
the purchase or sale of any securities. All trademarks,
service marks and trade names appearing in this report
are the property of their respective owners, and are
likewise used for identification purposes only.
This report is a service available
only to active Paid Premium Members.
You may opt-out of receiving report notifications
at any time. Questions or comments may be submitted
by writing to Premium Membership Services 665 S.E. 10 Street, Suite 201 Deerfield Beach, FL 33441-5634 or by calling 1-800-965-8307
or 954-785-1121.
|
|
|


