***Last / Change / Volume data in this table is the closing quote data***
Symbol/Exchange
Company Name
Industry Group |
PRICE |
CHANGE
(%Change) |
Day High |
Volume
(% DAV)
(% 50 day avg vol) |
52 Wk Hi
% From Hi |
Featured
Date |
Price
Featured |
Pivot Featured |
|
Max Buy |
ABV
-
NYSE
Comp De Bebidas Adr
FOOD and BEVERAGE - Beverages - Brewers
|
$139.72
|
-3.97
-2.76% |
$143.00
|
552,472
84.40% of 50 DAV
50 DAV is 654,600
|
$145.36
-3.88%
|
11/4/2010
|
$142.35
|
PP = $143.63
|
|
MB = $150.81
|
 Most Recent Note - 11/23/2010 5:27:48 PM
Y - Down today amid widespread weakness. Confirming gains to new highs on heavy volume would be a reassuring sign of institutional demand. Meanwhile, a recent low ($133.38 on 10/27/10) defines support above its 50 DMA line.
>>> The latest Featured Stock Update with an annotated graph appeared on 10/11/2010. Click here.
View all notes |
Alert me of new notes |
CANSLIM.net Company Profile |
SEC |
Zacks Reports |
StockTalk |
News |
Chart |
Request a new note
C
A N
S L
I M


|
ARUN
-
NASDAQ
Aruba Networks Inc
COMPUTER HARDWARE - Networking andamp; Communication Dev
|
$23.26
|
-0.96
-3.96% |
$23.94
|
2,396,141
95.55% of 50 DAV
50 DAV is 2,507,800
|
$24.28
-4.20%
|
8/30/2010
|
$18.12
|
PP = $18.51
|
|
MB = $19.44
|
Most Recent Note - 11/23/2010 4:24:54 PM
G - Gapped down today amid widespread market weakness. On the prior session it had rallied to a new all-time high, eclipsing its 2007 best for the first time. Its 50 DMA line and an upward trendline connecting May - November lows define support to watch.
>>> The latest Featured Stock Update with an annotated graph appeared on 10/26/2010. Click here.
View all notes |
Alert me of new notes |
CANSLIM.net Company Profile |
SEC |
Zacks Reports |
StockTalk |
News |
Chart |
Request a new note
C
A N
S L
I M
|
BIDU
-
NASDAQ
Baidu Inc Ads
INTERNET - Internet Information Providers
|
$106.31
|
-2.56
-2.35% |
$107.67
|
7,743,017
62.91% of 50 DAV
50 DAV is 12,308,400
|
$115.04
-7.59%
|
9/17/2010
|
$85.73
|
PP = $88.42
|
|
MB = $92.84
|
Most Recent Note - 11/23/2010 5:05:58 PM
G - Consolidating above its 50 DMA line, extended from a sound base pattern. Noted as a riskier "late stage" candidate after ongoing coverage.
>>> The latest Featured Stock Update with an annotated graph appeared on 10/7/2010. Click here.
View all notes |
Alert me of new notes |
CANSLIM.net Company Profile |
SEC |
Zacks Reports |
StockTalk |
News |
Chart |
Request a new note
C
A N
S L
I M
|
CACC
-
NASDAQ
Credit Acceptance Corp
FINANCIAL SERVICES - Credit Services
|
$59.85
|
+0.06
0.10% |
$60.00
|
8,890
33.55% of 50 DAV
50 DAV is 26,500
|
$63.45
-5.67%
|
11/22/2010
|
$59.97
|
PP = $62.00
|
|
MB = $65.10
|
Most Recent Note - 11/23/2010 5:07:15 PM
Y - Stayed above its 50 DMA line today with light volume behind a 5th consecutive gain. Color code was changed to yellow with a new slightly lower pivot point cited while currently building on a "double bottom" type base pattern. Its 11/16/10 low ($54.12) defines initial support above its 200 DMA line.
>>> The latest Featured Stock Update with an annotated graph appeared on 10/29/2010. Click here.
View all notes |
Alert me of new notes |
CANSLIM.net Company Profile |
SEC |
Zacks Reports |
StockTalk |
News |
Chart |
Request a new note
C
A N
S L
I M
|
CMG
-
NYSE
Chipotle Mexican Grill
LEISURE - Restaurants
|
$243.90
|
+0.98
0.40% |
$243.96
|
891,730
107.85% of 50 DAV
50 DAV is 826,800
|
$243.98
-0.03%
|
9/1/2010
|
$158.31
|
PP = $155.52
|
|
MB = $163.30
|
Most Recent Note - 11/22/2010 3:20:25 PM
G - Gain today for another new all-time high. It is extended from any sound base pattern. Its 50 DMA line (now $196) defines the nearest chart support level.
>>> The latest Featured Stock Update with an annotated graph appeared on 10/28/2010. Click here.
View all notes |
Alert me of new notes |
CANSLIM.net Company Profile |
SEC |
Zacks Reports |
StockTalk |
News |
Chart |
Request a new note
C
A N
S L
I M
|
Symbol/Exchange
Company Name
Industry Group |
PRICE |
CHANGE
(%Change) |
Day High |
Volume
(% DAV)
(% 50 day avg vol) |
52 Wk Hi
% From Hi |
Featured
Date |
Price
Featured |
Pivot Featured |
|
Max Buy |
CTRP
-
NASDAQ
Ctrip.Com Intl Ltd Adr
LEISURE - Resorts and Casinos
|
$46.41
|
-0.59
-1.26% |
$46.77
|
1,292,501
63.24% of 50 DAV
50 DAV is 2,043,900
|
$53.16
-12.70%
|
9/24/2010
|
$46.75
|
PP = $47.11
|
|
MB = $49.47
|
Most Recent Note - 11/22/2010 4:54:42 PM
G - Remains below its 50 DMA line which may now act as a resistance level. Gains lacked volume conviction after losses with above average volume raised concerns, and subsequent losses below its recent low ($45.05 on 11/16/10) would raise even greater concerns.
>>> The latest Featured Stock Update with an annotated graph appeared on 11/22/2010. Click here.
View all notes |
Alert me of new notes |
CANSLIM.net Company Profile |
SEC |
Zacks Reports |
StockTalk |
News |
Chart |
Request a new note
C
A N
S L
I M
|
DECK
-
NASDAQ
Deckers Outdoor Corp
CONSUMER NON-DURABLES - Textile - Apparel Footwear
|
$69.07
|
+0.85
1.25% |
$69.79
|
1,604,519
133.32% of 50 DAV
50 DAV is 1,203,500
|
$69.00
0.10%
|
10/27/2010
|
$54.16
|
PP = $54.86
|
|
MB = $57.60
|
Most Recent Note - 11/22/2010 3:34:48 PM
G - Today's 4th consecutive gain marks another new all-time high. Extended from its latest sound base, its prior highs and its 50 DMA line define the nearest chart support.
>>> The latest Featured Stock Update with an annotated graph appeared on 10/27/2010. Click here.
View all notes |
Alert me of new notes |
CANSLIM.net Company Profile |
SEC |
Zacks Reports |
StockTalk |
News |
Chart |
Request a new note
C
A N
S L
I M
|
EZPW
-
NASDAQ
Ezcorp Inc Cl A
SPECIALTY RETAIL - Specialty Retail, Other
|
$24.61
|
-0.11
-0.44% |
$24.69
|
146,691
48.36% of 50 DAV
50 DAV is 303,300
|
$25.65
-4.05%
|
11/5/2010
|
$24.02
|
PP = $23.85
|
|
MB = $25.04
|
Most Recent Note - 11/23/2010 5:18:57 PM
G - Stubbornly holding its ground with volume totals cooling while consolidating in a tight range near its all-time high. Prior highs in the $22-23 area define chart support to watch above its 50 DMA line.
>>> The latest Featured Stock Update with an annotated graph appeared on 11/6/2010. Click here.
View all notes |
Alert me of new notes |
CANSLIM.net Company Profile |
SEC |
Zacks Reports |
StockTalk |
News |
Chart |
Request a new note
C
A N
S L
I M
|
FFIV
-
NASDAQ
F 5 Networks Inc
INTERNET - Internet Software and Services
|
$129.14
|
-2.80
-2.12% |
$131.50
|
2,301,888
82.98% of 50 DAV
50 DAV is 2,773,900
|
$132.20
-2.31%
|
6/16/2010
|
$74.50
|
PP = $74.10
|
|
MB = $77.81
|
Most Recent Note - 11/23/2010 5:26:03 PM
G - Consolidating at all-time highs, extended from any sound base pattern. Prior highs in the $112 area define initial chart support.
>>> The latest Featured Stock Update with an annotated graph appeared on 11/15/2010. Click here.
View all notes |
Alert me of new notes |
CANSLIM.net Company Profile |
SEC |
Zacks Reports |
StockTalk |
News |
Chart |
Request a new note
C
A N
S L
I M
|
FOSL
-
NASDAQ
Fossil Inc
CONSUMER DURABLES - Recreational Goods, Other
|
$67.27
|
-1.46
-2.12% |
$68.30
|
755,072
95.93% of 50 DAV
50 DAV is 787,100
|
$70.07
-4.00%
|
10/20/2010
|
$54.12
|
PP = $55.61
|
|
MB = $58.39
|
Most Recent Note - 11/23/2010 5:11:59 PM
G - Stubbornly holding its ground in a tight range, extended from any sound base. An upward trendline connecting its July-October lows defines support to watch above its 50 DMA line.
>>> The latest Featured Stock Update with an annotated graph appeared on 10/5/2010. Click here.
View all notes |
Alert me of new notes |
CANSLIM.net Company Profile |
SEC |
Zacks Reports |
StockTalk |
News |
Chart |
Request a new note
C
A N
S L
I M
|
Symbol/Exchange
Company Name
Industry Group |
PRICE |
CHANGE
(%Change) |
Day High |
Volume
(% DAV)
(% 50 day avg vol) |
52 Wk Hi
% From Hi |
Featured
Date |
Price
Featured |
Pivot Featured |
|
Max Buy |
HMSY
-
NASDAQ
H M S Holdings Corp
COMPUTER SOFTWARE and SERVICES - Healthcare Information Service
|
$62.37
|
+0.04
0.06% |
$62.56
|
122,571
56.46% of 50 DAV
50 DAV is 217,100
|
$62.91
-0.86%
|
11/19/2010
|
$61.89
|
PP = $63.01
|
|
MB = $66.16
|
Most Recent Note - 11/23/2010 5:32:01 PM
Y - Gains with light volume this week helped it inch up for best its closes of the year, and no resistance remains due to overhead supply. A new pivot point was cited based on its 52-week high plus ten cents, and a subsequent breakout with volume conviction could trigger a new (or add-on) buy signal. Any violation of its 50 DMA line could raise greater concerns.
>>> The latest Featured Stock Update with an annotated graph appeared on 11/19/2010. Click here.
View all notes |
Alert me of new notes |
CANSLIM.net Company Profile |
SEC |
Zacks Reports |
StockTalk |
News |
Chart |
Request a new note
C
A N
S L
I M
|
HS
-
NYSE
Healthspring Inc
HEALTH SERVICES - Health Care Plans
|
$27.34
|
-0.46
-1.65% |
$27.56
|
343,493
48.32% of 50 DAV
50 DAV is 710,800
|
$29.80
-8.26%
|
8/27/2010
|
$19.91
|
PP = $19.75
|
|
MB = $20.74
|
Most Recent Note - 11/23/2010 5:17:31 PM
G - Hovering -8.3% off its 52-week high, and volume totals are still cooling while consolidating above its 50 DMA line which acted as support.
>>> The latest Featured Stock Update with an annotated graph appeared on 10/22/2010. Click here.
View all notes |
Alert me of new notes |
CANSLIM.net Company Profile |
SEC |
Zacks Reports |
StockTalk |
News |
Chart |
Request a new note
C
A N
S L
I M
|
IGTE
-
NASDAQ
Igate Corp
COMPUTER SOFTWARE and SERVICES - Information Technology Service
|
$24.10
|
+0.42
1.77% |
$24.13
|
514,559
73.81% of 50 DAV
50 DAV is 697,100
|
$23.99
0.45%
|
10/26/2010
|
$17.29
|
PP = $19.55
|
|
MB = $20.53
|
Most Recent Note - 11/22/2010 3:32:53 PM
G - Posting a 3rd consecutive gain today with below average volume for a new 52-week high. Extended from its latest base, its prior chart highs in the $19 area define initial chart support above its 50 DMA line.
>>> The latest Featured Stock Update with an annotated graph appeared on 11/11/2010. Click here.
View all notes |
Alert me of new notes |
CANSLIM.net Company Profile |
SEC |
Zacks Reports |
StockTalk |
News |
Chart |
Request a new note
C
A N
S L
I M
|
JOBS
-
NASDAQ
Fifty One Job Inc Ads
DIVERSIFIED SERVICES - Staffing and; Outsourcing Service
|
$49.82
|
+2.27
4.77% |
$50.14
|
217,112
99.05% of 50 DAV
50 DAV is 219,200
|
$51.75
-3.73%
|
10/13/2010
|
$42.07
|
PP = $40.60
|
|
MB = $42.63
|
Most Recent Note - 11/23/2010 5:15:01 PM
G - Posted a 5th consecutive gain today with volume picking up from lighter levels, rallying near its 52-week high. Its 50 DMA line defines important support to watch.
>>> The latest Featured Stock Update with an annotated graph appeared on 11/16/2010. Click here.
View all notes |
Alert me of new notes |
CANSLIM.net Company Profile |
SEC |
Zacks Reports |
StockTalk |
News |
Chart |
Request a new note
C
A N
S L
I M
|
LFT
-
NYSE
Longtop Financl Tech Ads
COMPUTER SOFTWARE and SERVICES - Business Software and Services
|
$40.29
|
+0.31
0.78% |
$40.50
|
200,812
36.61% of 50 DAV
50 DAV is 548,500
|
$42.86
-6.00%
|
11/5/2010
|
$41.83
|
PP = $40.96
|
|
MB = $43.01
|
Most Recent Note - 11/22/2010 3:48:26 PM
Y - Recently consolidating above support near its 50 DMA line. Color code was changed to yellow after a rebound above the $40 level helped its outlook.
>>> The latest Featured Stock Update with an annotated graph appeared on 10/14/2010. Click here.
View all notes |
Alert me of new notes |
CANSLIM.net Company Profile |
SEC |
Zacks Reports |
StockTalk |
News |
Chart |
Request a new note
C
A N
S L
I M
|
Symbol/Exchange
Company Name
Industry Group |
PRICE |
CHANGE
(%Change) |
Day High |
Volume
(% DAV)
(% 50 day avg vol) |
52 Wk Hi
% From Hi |
Featured
Date |
Price
Featured |
Pivot Featured |
|
Max Buy |
LULU
-
NASDAQ
Lululemon Athletica
MANUFACTURING - Textile Manufacturing
|
$53.43
|
+0.18
0.34% |
$54.77
|
1,568,267
145.24% of 50 DAV
50 DAV is 1,079,800
|
$53.43
0.00%
|
10/8/2010
|
$47.66
|
PP = $46.67
|
|
MB = $49.00
|
Most Recent Note - 11/23/2010 1:02:57 PM
G - It is extended from its prior base and hit another new 52-week high today after 5 consecutive gains marked by ever-increasing volume. Prior highs in the $46-48 area define chart support to watch along with its 50 DMA line.
>>> The latest Featured Stock Update with an annotated graph appeared on 10/8/2010. Click here.
View all notes |
Alert me of new notes |
CANSLIM.net Company Profile |
SEC |
Zacks Reports |
StockTalk |
News |
Chart |
Request a new note
C
A N
S L
I M
|
MWIV
-
NASDAQ
M W I Veterinary Supply
HEALTH SERVICES - Medical Instruments and; Supplies
|
$59.03
|
-0.16
-0.27% |
$59.04
|
47,791
82.26% of 50 DAV
50 DAV is 58,100
|
$63.94
-7.68%
|
11/4/2010
|
$61.79
|
PP = $59.60
|
|
MB = $62.58
|
Most Recent Note - 11/22/2010 3:38:50 PM
Y - Perched near its 50 DMA line which has been repeatedly noted as a very important support level. It stalled after hitting its all-time high on 11/04/10, yet held its ground stubbornly above its short-term average.
>>> The latest Featured Stock Update with an annotated graph appeared on 11/2/2010. Click here.
View all notes |
Alert me of new notes |
CANSLIM.net Company Profile |
SEC |
Zacks Reports |
StockTalk |
News |
Chart |
Request a new note
C
A N
S L
I M
|
NEOG
-
NASDAQ
Neogen Corp
DRUGS - Diagnostic Substances
|
$36.51
|
+0.18
0.50% |
$36.61
|
51,351
60.56% of 50 DAV
50 DAV is 84,800
|
$36.90
-1.06%
|
9/1/2010
|
$30.79
|
PP = $30.49
|
|
MB = $32.01
|
Most Recent Note - 11/23/2010 5:34:52 PM
G - Today's 4th consecutive gain on light volume led to a finish 39 cents off its best ever close. Rallied up from its 50 DMA line which recently has been a reliable support level. Any subsequent violation could raise concerns and trigger sell signals. It recently stalled after quietly claiming a new all-time high.
>>> The latest Featured Stock Update with an annotated graph appeared on 10/13/2010. Click here.
View all notes |
Alert me of new notes |
CANSLIM.net Company Profile |
SEC |
Zacks Reports |
StockTalk |
News |
Chart |
Request a new note
C
A N
S L
I M
|
NFLX
-
NASDAQ
Netflix Inc
SPECIALTY RETAIL - Music and Video Stores
|
$187.71
|
-0.61
-0.32% |
$192.10
|
6,813,918
123.71% of 50 DAV
50 DAV is 5,508,000
|
$188.70
-0.52%
|
11/9/2010
|
$173.10
|
PP = $184.84
|
|
MB = $194.08
|
Most Recent Note - 11/23/2010 1:07:58 PM
Y - The strong close after a gap up on the prior session may be a new (or add-on) technical buy signal, but 3 out of 4 stocks tend to follow the direction of the major averages. At an all-time high today, NFLX had been noted as a riskier "late stage" set-up. A follow-through day from at least one of the major averages is also needed as a confirmation of a new rally since recent concerns were raised about the M criteria.
>>> The latest Featured Stock Update with an annotated graph appeared on 10/1/2010. Click here.
View all notes |
Alert me of new notes |
CANSLIM.net Company Profile |
SEC |
Zacks Reports |
StockTalk |
News |
Chart |
Request a new note
C
A N
S L
I M
|
NTAP
-
NASDAQ
Netapp Inc
COMPUTER HARDWARE - Data Storage Devices
|
$50.85
|
-1.37
-2.62% |
$51.96
|
6,353,618
82.14% of 50 DAV
50 DAV is 7,735,100
|
$57.96
-12.27%
|
9/8/2010
|
$46.98
|
PP = $44.99
|
|
MB = $47.24
|
Most Recent Note - 11/23/2010 5:10:09 PM
G - Small loss today on light volume led to a close just below its 50 DMA line and prior highs. On 11/19/10 it was noted - "It has not formed a sound base, and the weakness suggests that it may be due for a longer and deeper consolidation."
>>> The latest Featured Stock Update with an annotated graph appeared on 11/3/2010. Click here.
View all notes |
Alert me of new notes |
CANSLIM.net Company Profile |
SEC |
Zacks Reports |
StockTalk |
News |
Chart |
Request a new note
C
A N
S L
I M
|
Symbol/Exchange
Company Name
Industry Group |
PRICE |
CHANGE
(%Change) |
Day High |
Volume
(% DAV)
(% 50 day avg vol) |
52 Wk Hi
% From Hi |
Featured
Date |
Price
Featured |
Pivot Featured |
|
Max Buy |
ORCL
-
NASDAQ
Oracle Corp
COMPUTER SOFTWARE and SERVICES - Application Software
|
$27.19
|
-0.86
-3.07% |
$27.82
|
31,241,325
80.56% of 50 DAV
50 DAV is 38,778,300
|
$29.82
-8.82%
|
9/20/2010
|
$27.32
|
PP = $26.73
|
|
MB = $28.07
|
Most Recent Note - 11/23/2010 5:01:16 PM
G- Color code is changed to green after it sank below its DMA line and under the latest chart low today, raising concerns amid widespread market weakness. Gains above its short-term average are needed for its outlook to improve.
>>> The latest Featured Stock Update with an annotated graph appeared on 11/18/2010. Click here.
View all notes |
Alert me of new notes |
CANSLIM.net Company Profile |
SEC |
Zacks Reports |
StockTalk |
News |
Chart |
Request a new note
C
A N
S L
I M
|
PAY
-
NYSE
Verifone Systems Inc
COMPUTER HARDWARE - Transaction Automation Systems
|
$33.69
|
-0.51
-1.49% |
$33.74
|
1,719,213
125.22% of 50 DAV
50 DAV is 1,372,900
|
$35.94
-6.26%
|
8/25/2010
|
$24.30
|
PP = $23.74
|
|
MB = $24.93
|
Most Recent Note - 11/23/2010 5:24:33 PM
G - Consolidating above prior highs ($31.40) and its 50 DMA line, it gapped down today under mild distributional pressure. It has the look of an advanced "ascending base" pattern after an impressive rally from its 7/26/10 breakout.
>>> The latest Featured Stock Update with an annotated graph appeared on 10/25/2010. Click here.
View all notes |
Alert me of new notes |
CANSLIM.net Company Profile |
SEC |
Zacks Reports |
StockTalk |
News |
Chart |
Request a new note
C
A N
S L
I M
|
RAX
-
NYSE
Rackspace Hosting Inc
INTERNET - Internet Software and; Services
|
$27.71
|
-0.57
-2.02% |
$28.00
|
1,453,811
54.24% of 50 DAV
50 DAV is 2,680,100
|
$29.35
-5.59%
|
9/21/2010
|
$22.84
|
PP = $23.61
|
|
MB = $24.79
|
Most Recent Note - 11/22/2010 3:16:11 PM
G - A 4th consecutive gain today has it -3.4% away from its all-time high with no resistance remaining due to overhead supply. It is extended from any sound base.
>>> The latest Featured Stock Update with an annotated graph appeared on 11/17/2010. Click here.
View all notes |
Alert me of new notes |
CANSLIM.net Company Profile |
SEC |
Zacks Reports |
StockTalk |
News |
Chart |
Request a new note
C
A N
S L
I M
|
ROVI
-
NASDAQ
Rovi Corp
COMPUTER SOFTWARE andamp; SERVICES - Security Software andamp; Services
|
$54.06
|
-0.64
-1.17% |
$54.48
|
922,097
58.32% of 50 DAV
50 DAV is 1,581,200
|
$55.00
-1.71%
|
10/29/2010
|
$49.99
|
PP = $53.10
|
|
MB = $55.76
|
Most Recent Note - 11/22/2010 3:47:17 PM
Y - Hit another new 2010 high today with a 4th consecutive small gain without great volume conviction. Confirming gains on heavy volume coupled with a follow-through day from at least one of the major market averages (M criteria) could help trigger a new (or add-on) technical buy signal. Meanwhile, its 50 DMA line defines important support to watch.
>>> The latest Featured Stock Update with an annotated graph appeared on 10/20/2010. Click here.
View all notes |
Alert me of new notes |
CANSLIM.net Company Profile |
SEC |
Zacks Reports |
StockTalk |
News |
Chart |
Request a new note
C
A N
S L
I M
|
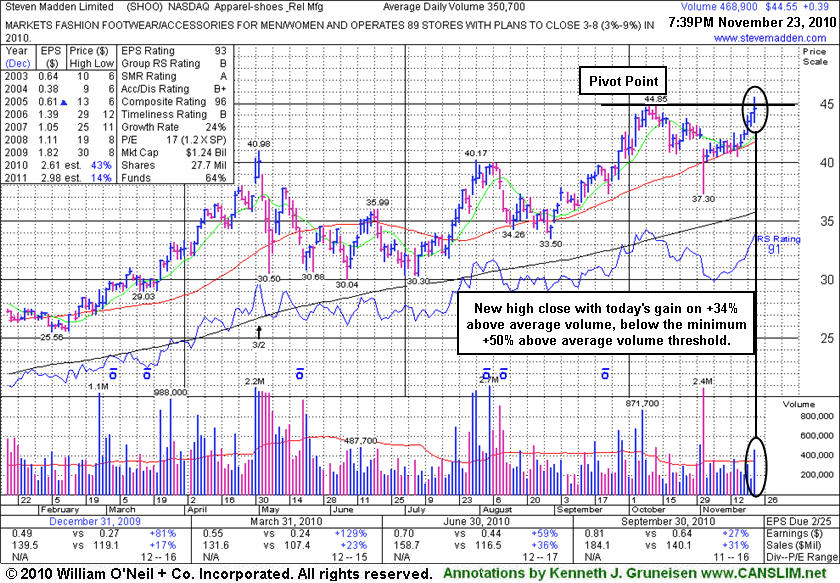
SHOO
-
NASDAQ
Steven Madden Limited
CONSUMER NON-DURABLES - Textile - Apparel Footwear
|
$44.61
|
+0.45
1.02% |
$45.58
|
475,007
134.41% of 50 DAV
50 DAV is 353,400
|
$44.85
-0.54%
|
11/23/2010
|
$44.61
|
PP = $44.95
|
|
MB = $47.20
|
Most Recent Note - 11/23/2010 8:14:00 PM
Y - Color code is changed to yellow with new pivot point cited. No resistance remains due to overhead supply, and above average volume was behind today's 5th consecutive gain as it hit and closed at new 2010 highs. Recently found support above its 50 DMA line and prior chart highs in the $40 area.
>>> The latest Featured Stock Update with an annotated graph appeared on 11/23/2010. Click here.
View all notes |
Alert me of new notes |
CANSLIM.net Company Profile |
SEC |
Zacks Reports |
StockTalk |
News |
Chart |
Request a new note
C
A N
S L
I M
|
Symbol/Exchange
Company Name
Industry Group |
PRICE |
CHANGE
(%Change) |
Day High |
Volume
(% DAV)
(% 50 day avg vol) |
52 Wk Hi
% From Hi |
Featured
Date |
Price
Featured |
Pivot Featured |
|
Max Buy |
SLW
-
NYSE
Silver Wheaton Corp
METALS and; MINING - Silver
|
$35.52
|
-0.61
-1.69% |
$35.94
|
11,258,374
121.71% of 50 DAV
50 DAV is 9,250,000
|
$37.20
-4.52%
|
8/25/2010
|
$21.40
|
PP = $21.99
|
|
MB = $23.09
|
Most Recent Note - 11/22/2010 3:11:31 PM
G - Poised for a new high close today with its 4th consecutive gain. Last week's lows define support above its 50 DMA line.
>>> The latest Featured Stock Update with an annotated graph appeared on 10/18/2010. Click here.
View all notes |
Alert me of new notes |
CANSLIM.net Company Profile |
SEC |
Zacks Reports |
StockTalk |
News |
Chart |
Request a new note
C
A N
S L
I M
|
UA
-
NYSE
Under Armour Inc Cl A
CONSUMER NON-DURABLES - Textile - Apparel Clothing
|
$55.52
|
+0.53
0.96% |
$55.73
|
662,256
86.66% of 50 DAV
50 DAV is 764,200
|
$55.09
0.78%
|
9/9/2010
|
$39.99
|
PP = $40.10
|
|
MB = $42.11
|
Most Recent Note - 11/23/2010 5:29:59 PM
G - Today's 6th consecutive gain for a new 52-week high has it very extended from any sound base and support at its 50 DMA line.
>>> The latest Featured Stock Update with an annotated graph appeared on 11/4/2010. Click here.
View all notes |
Alert me of new notes |
CANSLIM.net Company Profile |
SEC |
Zacks Reports |
StockTalk |
News |
Chart |
Request a new note
C
A N
S L
I M
|
ULTA
-
NASDAQ
Ulta Salon Cosm & Frag
SPECIALTY RETAIL - Specialty Retail, Other
|
$33.48
|
+0.80
2.45% |
$33.22
|
410,691
88.84% of 50 DAV
50 DAV is 462,300
|
$33.50
-0.06%
|
9/3/2010
|
$26.36
|
PP = $25.89
|
|
MB = $27.18
|
Most Recent Note - 11/23/2010 5:16:12 PM
G - Gain today helped it match its 52-week high. Making progress toward its all-time high of $35.63 in Nov '07, meanwhile its 50 DMA line defines initial support to watch.
>>> The latest Featured Stock Update with an annotated graph appeared on 11/1/2010. Click here.
View all notes |
Alert me of new notes |
CANSLIM.net Company Profile |
SEC |
Zacks Reports |
StockTalk |
News |
Chart |
Request a new note
C
A N
S L
I M
|
VIT
-
NYSE
Vanceinfo Tech Inc Ads
COMPUTER SOFTWARE and SERVICES - Business Software and Services
|
$36.74
|
-1.14
-3.01% |
$36.96
|
1,140,607
177.42% of 50 DAV
50 DAV is 642,900
|
$38.43
-4.40%
|
7/8/2010
|
$25.20
|
PP = $26.58
|
|
MB = $27.91
|
Most Recent Note - 11/23/2010 1:22:22 PM
G - Gapped down today after 4 consecutive gains, and yet it is perched only -4% off its all-time high with no overhead supply. A positive reversal at its 50 DMA line on 11/17/10 was an indication of prompt support.
>>> The latest Featured Stock Update with an annotated graph appeared on 10/21/2010. Click here.
View all notes |
Alert me of new notes |
CANSLIM.net Company Profile |
SEC |
Zacks Reports |
StockTalk |
News |
Chart |
Request a new note
C
A N
S L
I M
|