You are not logged in.
This means you
CAN ONLY VIEW reports that were published prior to Wednesday, April 23, 2025.
You
MUST UPGRADE YOUR MEMBERSHIP if you want to see any current reports.
AFTER MARKET UPDATE - MONDAY, NOVEMBER 23RD, 2009
Previous After Market Report Next After Market Report >>>
|
|
|
|
DOW |
+132.79 |
10,450.95 |
+1.29% |
|
Volume |
979,846,620 |
-14% |
|
Volume |
1,871,166,390 |
-6% |
|
NASDAQ |
+29.97 |
2,176.01 |
+1.40% |
|
Advancers |
2,331 |
75% |
|
Advancers |
1,939 |
68% |
|
S&P 500 |
+14.86 |
1,106.24 |
+1.36% |
|
Decliners |
672 |
22% |
|
Decliners |
793 |
28% |
|
Russell 2000 |
+10.13 |
594.81 |
+1.73% |
|
52 Wk Highs |
190 |
|
|
52 Wk Highs |
129 |
|
|
S&P 600 |
+5.78 |
314.85 |
+1.87% |
|
52 Wk Lows |
1 |
|
|
52 Wk Lows |
12 |
|
|
 |
Breadth Positive As Major Averages Trade Up
Adam Sarhan, Contributing Writer,
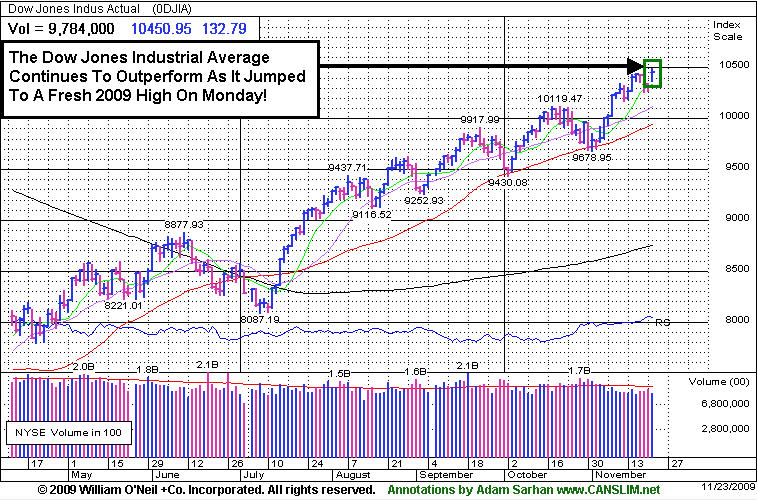
The major averages opened sharply higher Monday as the US dollar plunged after the latest round of economic data was released. Volume, a critical component of institutional demand, was lower than Friday's levels on the NYSE and on the Nasdaq exchange which was expected since a series of options expired on Friday inflating the trading totals. Advancers led decliners by over a 3-to-1 ratio on the NYSE and by over a 2-to-1 ratio on the Nasdaq exchange. There were 41 high-ranked companies from the CANSLIM.net Leaders List making a new 52-week high and appearing on the CANSLIM.net BreakOuts Page, higher from the 12 issues that appeared on the prior session. In terms of new leadership, it was encouraging to see new 52-week highs outnumber new 52-week lows on the NYSE and Nasdaq exchange.
Investors sent stocks higher after the National Association of Realtors released a report which showed that sales of existing homes topped estimates. Sales rose +10% in October to the highest level since February 2007 which helped offset concern that the housing recovery was in jeopardy. Last week, stocks got hit after a series of weaker-than-expected housing market reports were released. So Monday's news was a welcomed sign that record low interest rates and a national home buyer credit would aid this ailing sector.
Gold surged to a fresh all-time high overnight as the dollar snapped a 3-day winning streak. Crude oil jumped above $79 a barrel and copper jumped to a 14-month high before pulling back. Commodity markets rallied and the dollar fell after Iran's military ran some exercises in the Middle East.
Charles Evans, president of the Federal Reserve Bank of Chicago, told the Financial Times that US interest rates may stay near record lows (just above zero) until "late 2010, perhaps later." This helped allay concern that the Fed may begin raising rates in early 2010. In other central bank news, the Bank of Israel unexpectedly raised their benchmark interest rate for a second time since the recovery began at the end of Q1 2009. The bank said economic growth had accelerated and inflation approached the top of its target range. The Tel Aviv 25 Index rose +1% on the news.
PICTURED: The Dow Jones Industrial Average continues to outperform its peers as it jumped to a fresh 2009 high on Monday!
|
|
|
 |
Defensive Areas Among Monday's Leading Gainers
Kenneth J. Gruneisen - Passed the CAN SLIM® Master's Exam
Defensive areas were some of Monday's standout gainers as the Healthcare Index ($HMO +3.59%) posted a solid gain and the Integrated Oil Index ($XOI +1.45%), Oil Services Index ($OSX +1.55%), and Gold & Silver Index ($XAU +1.47%) rose. The Semiconductor Index ($SOX +1.15%) and Internet Index ($IIX +1.62%) also posted solid gains, meanwhile the Networking Index ($NWX +0.49%) and Biotechnology Index ($BTK +0.12%) posted smaller gains. The Retail Index ($RLX +0.90%) posted a modest gain and helped the major averages' positive bias. The Bank Index ($BKX +2.11%) also traded with a positive bias, meanwhile the Broker/Dealer Index ($XBD -0.48%) lagged. Both influential financial indexes are still struggling below their 50-day moving average (DMA) lines.
Charts courtesy www.stockcharts.com
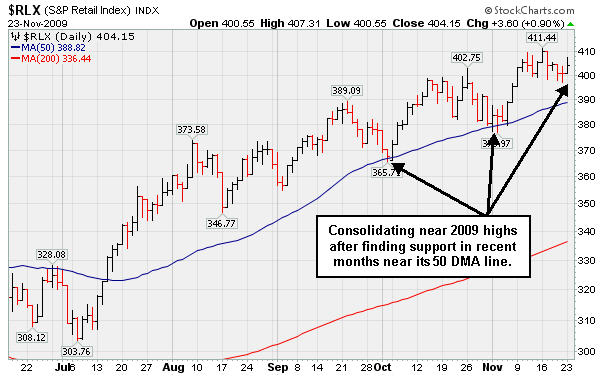
PICTURED: The Retail Index ($RLX +0.90%) is consolidating near 2009 highs after finding support in recent months near its 50-day moving average (DMA) line.
| Oil Services |
$OSX |
191.92 |
+2.93 |
+1.55% |
+58.10% |
| Healthcare |
$HMO |
1,352.32 |
+46.82 |
+3.59% |
+40.84% |
| Integrated Oil |
$XOI |
1,088.64 |
+15.55 |
+1.45% |
+11.12% |
| Semiconductor |
$SOX |
311.52 |
+3.55 |
+1.15% |
+46.83% |
| Networking |
$NWX |
225.91 |
+1.11 |
+0.49% |
+57.00% |
| Internet |
$IIX |
227.13 |
+3.61 |
+1.62% |
+69.79% |
| Broker/Dealer |
$XBD |
115.27 |
-0.56 |
-0.48% |
+48.79% |
| Retail |
$RLX |
404.15 |
+3.60 |
+0.90% |
+44.72% |
| Gold & Silver |
$XAU |
186.99 |
+2.71 |
+1.47% |
+50.98% |
| Bank |
$BKX |
44.59 |
+0.92 |
+2.11% |
+0.61% |
| Biotech |
$BTK |
867.36 |
+1.08 |
+0.12% |
+34.02% |
|
|
|
 |
High-Ranked Leader Gapped Up Today
Kenneth J. Gruneisen - Passed the CAN SLIM® Master's Exam
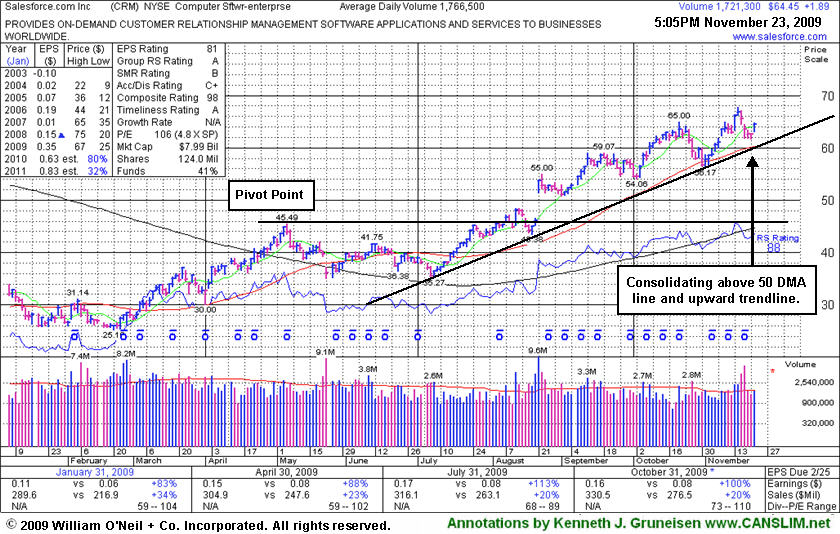
Salesforce.com, Inc. (CRM +$1.94 or +3.10% to $64.50) gapped up today for a solid gain on average volume after 4 consecutive losing sessions. Not long ago it found prompt support at its 50-day moving average (DMA) line then rallied to a new 52-week high. It pulled back after reporting another strong quarter of sales and earnings increases for the period ended October 31, 2009. It has not spend a lot of time basing since its big gap up in August. Patience may allow it to form a sound new base and offer disciplined investors another idea entry point. Meanwhile, its 50 DMA line and upward trendline connecting prior chart lows are initial chart support levels to watch.
|
|
|
Color Codes Explained :
Y - Better candidates highlighted by our
staff of experts.
G - Previously featured
in past reports as yellow but may no longer be buyable under the
guidelines.
***Last / Change / Volume quote data in this table corresponds with the timestamp on the note***
Symbol/Exchange
Company Name
Industry Group |
Last |
Chg. |
Vol
% DAV |
Date Featured |
Price Featured |
Latest Pivot Point
Featured |
Status |
| Latest Max Buy Price |
ARST
-
|
$24.64
|
+0.22
|
333,001
54% DAV
613,400
|
9/1/2009
(Date
Featured) |
$19.91
(Price
Featured) |
PP = $20.90 |
G |
| MB = $21.95 |
Most Recent Note - 11/23/2009 5:35:47 PM
G - Small gain today on much lighter than average volume, consolidating near its 50 DMA line (now $24.16). ARST was first featured in yellow at $19.91 in the 9/01/09 mid-day report with an annotated daily graph (read here).
>>> The latest Featured Stock Update with an annotated graph appeared on 11/19/2009. click here.
|
|
C
A
S
I |
News |
Chart |
SEC
View all notes Alert
me of new notes
Company
Profile
|
ASIA
-
|
$25.66
|
+0.68
|
868,303
86% DAV
1,011,100
|
10/14/2009
(Date
Featured) |
$23.05
(Price
Featured) |
PP = $22.19 |
G |
| MB = $23.30 |
Most Recent Note - 11/23/2009 5:36:39 PM
G - Gapped up today on higher volume after consecutive losses on light volume for 3 sessions. Hovering near its 2009 highs, extended from its latest sound base. Featured 10/14/09 in the mid-day report (read here) as it gapped up for a new 52-week high with 5 times average volume, triggering a technical buy signal by blasting above its pivot point. First featured in the August 2009 CANSLIM.net News (read here).
>>> The latest Featured Stock Update with an annotated graph appeared on 11/12/2009. click here.
|
|
C
A
S
I |
News |
Chart |
SEC
View all notes Alert
me of new notes
Company
Profile
|
BIDU
- NASDAQ
Baidu Inc Ads
INTERNET - Internet Information Providers
|
$439.00
|
+11.41
|
1,426,636
64% DAV
2,245,200
|
9/8/2009
(Date
Featured) |
$351.80
(Price
Featured) |
PP = $368.59 |
G |
| MB = $387.02 |
Most Recent Note - 11/23/2009 5:37:56 PM
G - Gapped up today for a gain on light volume after small losses on the 3 prior sessions while hovering near all-time highs. Proved resilient near its 50 DMA line after its 10/27/09 gap down. As recently noted, "Choppy action has not allowed it to form a sound base in recent weeks." BIDU traded up as much as +23% from its price when featured in yellow in the 9/08/09 Mid-Day BreakOuts Report (read here).
>>> The latest Featured Stock Update with an annotated graph appeared on 11/10/2009. click here.
|
|
C
A
S
I |
News |
Chart |
SEC
View all notes Alert
me of new notes
Company
Profile
|
CACC
- NASDAQ
Credit Acceptance Corp
FINANCIAL SERVICES - Credit Services
|
$34.98
|
+0.40
|
32,162
89% DAV
36,200
|
9/29/2009
(Date
Featured) |
$33.48
(Price
Featured) |
PP = $37.10 |
Y |
| MB = $38.96 |
Most Recent Note - 11/23/2009 5:39:06 PM
Y - Small gain today on near average volume. Color code was changed to yellow with new pivot point and max buy levels noted. After a 5-week flat base it is continuing its consolidation in a very orderly fashion above prior chart highs and its 50 DMA line in the $32 area. The Finance - Consumer/Commercial Loans firm has maintained a great track record of annual and quarterly sales revenues and earnings increases. It was featured on 9/29/09 in yellow in the mid-day report (read here).
>>> The latest Featured Stock Update with an annotated graph appeared on 11/16/2009. click here.
|
|
C
A
S
I |
News |
Chart |
SEC
View all notes Alert
me of new notes
Company
Profile
|
CRM
- NYSE
Salesforce.com Inc
INTERNET - Internet Software & Services
|
$64.50
|
+1.94
|
1,750,282
99% DAV
1,766,500
|
8/16/2009
(Date
Featured) |
$47.12
(Price
Featured) |
PP = $45.59 |
G |
| MB = $47.87 |
Most Recent Note - 11/23/2009 5:41:00 PM
G - Gapped up today after losses on the 4 prior sessions following another strong quarterly report for the period ended October 31, 2009. It is not near any sound base, but after finding prompt support at its 50 DMA line it is within close range of its prior high.
>>> The latest Featured Stock Update with an annotated graph appeared on 11/23/2009. click here.
|
|
C
A
S
I |
News |
Chart |
SEC
View all notes Alert
me of new notes
Company
Profile
|
GMCR
- NASDAQ
Green Mtn Coffee Roastrs
FOOD & BEVERAGE - Processed & Packaged Goods
|
$65.44
|
+0.43
|
1,278,244
92% DAV
1,388,300
|
10/5/2009
(Date
Featured) |
$71.11
(Price
Featured) |
PP = $75.89 |
G |
| MB = $79.68 |
Most Recent Note - 11/23/2009 5:42:08 PM
G - Small gain today on near average volume. It recently triggered a sell signal by its 50 DMA line violation. Gapped down on 11/12/09 after reporting strong quarterly results for the period ended Sept 30, 2009. As recently noted, "Its choppy action in recent weeks has not allowed for a sound new base to form."
>>> The latest Featured Stock Update with an annotated graph appeared on 11/20/2009. click here.
|
|
C
A
S
I |
News |
Chart |
SEC
View all notes Alert
me of new notes
Company
Profile
|
HEAT
-
|
$13.75
|
+0.11
|
838,891
131% DAV
639,600
|
11/17/2009
(Date
Featured) |
$12.00
(Price
Featured) |
PP = $12.61 |
G |
| MB = $13.24 |
Most Recent Note - 11/23/2009 5:42:54 PM
G - Hit a new 52-week high with its early gain today yet reversed to close in the middle of its intra-day range. Last week's gains on heavy volume drew attention since it was first featured in yellow in the 11/17/09 mid-day report (read here) when technically rising from a "double bottom" base, reaching a new all-time high. On 9/18/09 it completed an additional share offering. There is limited history for this small Chinese firm in the Pollution Control - Equipment group, however its reported annual earnings (A criteria) history has been strong, and the 3 latest quarters show sales revenues and earnings increases well above the +25% guideline.
>>> The latest Featured Stock Update with an annotated graph appeared on 11/17/2009. click here.
|
|
C
A
S
I |
News |
Chart |
SEC
View all notes Alert
me of new notes
Company
Profile
|
LFT
-
|
$34.67
|
-0.40
|
567,014
116% DAV
487,100
|
11/17/2009
(Date
Featured) |
$31.77
(Price
Featured) |
PP = $33.04 |
G |
| MB = $34.69 |
Most Recent Note - 11/23/2009 5:46:04 PM
G - Negatively reversed today after hitting a new all-time high. Last week it rose from a choppy 14-week base. Recent highs in the $31 area are an initial support level to watch. A proposed offering of additional shares on 11/16/09 seems well received by the market. Its fundamentals remain strong.
>>> The latest Featured Stock Update with an annotated graph appeared on 11/18/2009. click here.
|
|
C
A
S
I |
News |
Chart |
SEC
View all notes Alert
me of new notes
Company
Profile
|
|
 |
| Subscriber Questions: |
November 23, 2009 |
Ken,
I had a question about the featured stock CACC because the Acc/Dis ratio is a C- and the DAV is about 36,000. Isn't that not following the canslim rules? It looks to me that it's not under accumulation and the trading volume seems very volatile. I understand the 8% sell rule, but it seems to me that one could easily be whipsawed if an institutional investor decided one day to sell it's shares.
Also wanted to say thanks for the excellent analysis so far and the daily updates to the website. Checking the website has become a daily habit for me and I'm learning quite a lot
Sincerely,
Andy |
| Ken's Response: |
November 23, 2009 |
Dear Andy,
Thanks for your feedback on the website and on the analysis we provide, and thanks for the great questions concerning Credit Acceptance Corp (CACC). The stock's Accumulation/Distribution Rank was B- when first featured and appearing in the Featured Stock Update section with an annotated graph under the headline "Breakout With Twice Average Volume For Strong Financial Firm" - 9/29/2009 (read here). The rank has indeed slumped due to noted distribution in recent weeks while it has been consolidating in a tight trading range above its 50-day moving average and prior highs.
It does not concern us that average daily volume is in the 36,000 range, especially when all other criteria are so strong. However, the small float of only 5.89 million versus 31.0 million total shares outstanding is a concern to the degree that there is always the potential for insiders (management owns 81% of shares) to eventually engage the help of underwriters to offer out large blocks of shares. Such offerings can hinder upward price progress for the near-term when they happen, yet they could also be considered part of the maturation process of small growth companies, and the offerings can increase the level of institutional participation (I criteria). Overall, it can lead to more institutional interest and support. Heavy ownership by insiders also keeps the management keenly focused on maintaining and building shareholder value, which is a nice reassurance.
None of the above offers any guarantee CACC will do from here. The best way investors can stack the odds in their favor under the investment system rules is to make disciplined entries and exists. Right now the stock is extended from its prior base, building a base-on-base type pattern, which is considered a bullish and very strong set-up pattern. Disciplined investors might watch for another convincing breakout, which is why we noted the new pivot point after a sufficient base period. Only with the substantial volume behind gains necessary to trigger a new technical buy signal would disciplined investors consider initial buying efforts or add-on buying efforts. Meanwhile it looks like a great company to have on your watch list.
If you have any other questions or concerns related to CANSLIM.net services please do not hesitate to contact me directly or write in using the inquiry form again.
Sincerely,

Kenneth J. Gruneisen
Founder & Contributing Writer for CANSLIM.net
www.canslim.net |
|
|
|
THESE ARE NOT BUY RECOMMENDATIONS!
Comments contained in the body of this report are technical
opinions only. The material herein has been obtained
from sources believed to be reliable and accurate, however,
its accuracy and completeness cannot be guaranteed.
This site is not an investment advisor, hence it does
not endorse or recommend any securities or other investments.
Any recommendation contained in this report may not
be suitable for all investors and it is not to be deemed
an offer or solicitation on our part with respect to
the purchase or sale of any securities. All trademarks,
service marks and trade names appearing in this report
are the property of their respective owners, and are
likewise used for identification purposes only.
This report is a service available
only to active Paid Premium Members.
You may opt-out of receiving report notifications
at any time. Questions or comments may be submitted
by writing to Premium Membership Services 665 S.E. 10 Street, Suite 201 Deerfield Beach, FL 33441-5634 or by calling 1-800-965-8307
or 954-785-1121.
|
|
|


